

Despite the cooler weather we’ve experienced the last couple of weeks, temperatures from April 1st through 26th averaged 2.3°F above normal for the entire state (Figure 1). Departures have steadily declined as the weather pattern shifted to cold and dry as a result of an upper atmosphere blocking pattern. Since April 21st, temperatures averaged 9-12°F below normal, and a large portion of the state experienced a hard freeze on April 24th (Figure 2). Indianapolis recorded a low temperature of 28°F, which tied the record low set in 1910. Many locations experienced additional frost events throughout the week, posing a risk to nearly all horticultural crops.
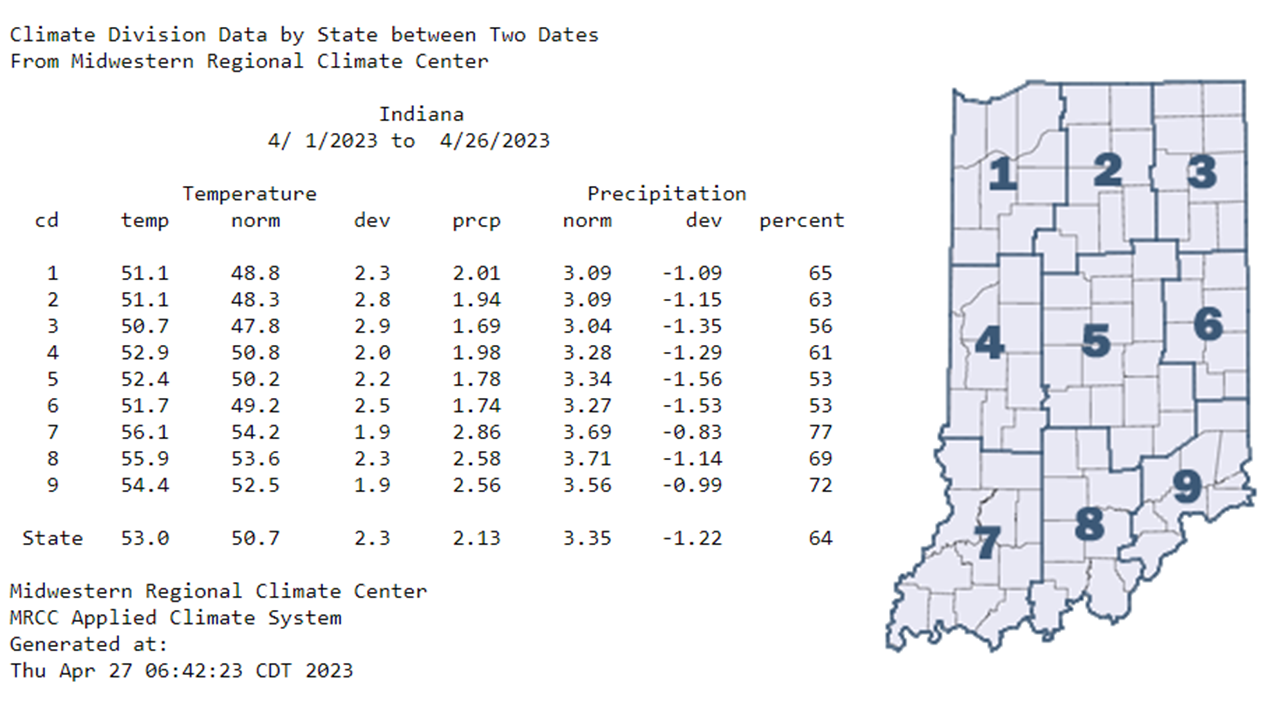
Figure 1: Indiana climate division and state temperature, normal temperature, temperature departure from normal, precipitation, normal precipitation, precipitation departure from normal, and percent of mean precipitation for April 1-26, 2023.
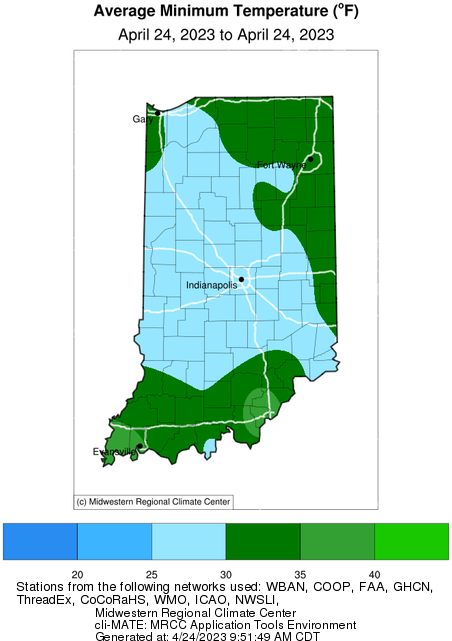
Figure 2: An interpolated map displaying average Minimum Temperatures for the April 24, 2023 freeze event.
Modified Growing Degree Days (MGDDs), being temperature driven, ran above normal for nearly the whole state (Figure 3). As of late, accumulations have slowed, and the highest departures occurred in northwestern Indiana. Soil temperatures have dropped slightly with the colder air temperatures but have continued to meander between 40-55°F statewide (Figure 4). Many producers planted over the past few weeks and have yet to see crops emerge, which is likely a good thing in light of the ongoing frost and freeze events. Soil moisture, especially in the topsoil, has dried due to the lack of rain and the rapid drying events this month (high wind, low humidity, abundant sun, etc.). Statewide, precipitation ran 1.22 inches below normal (64 percent of normal) for April 1st through 26th and does not look to rebound at least for the next couple of weeks.
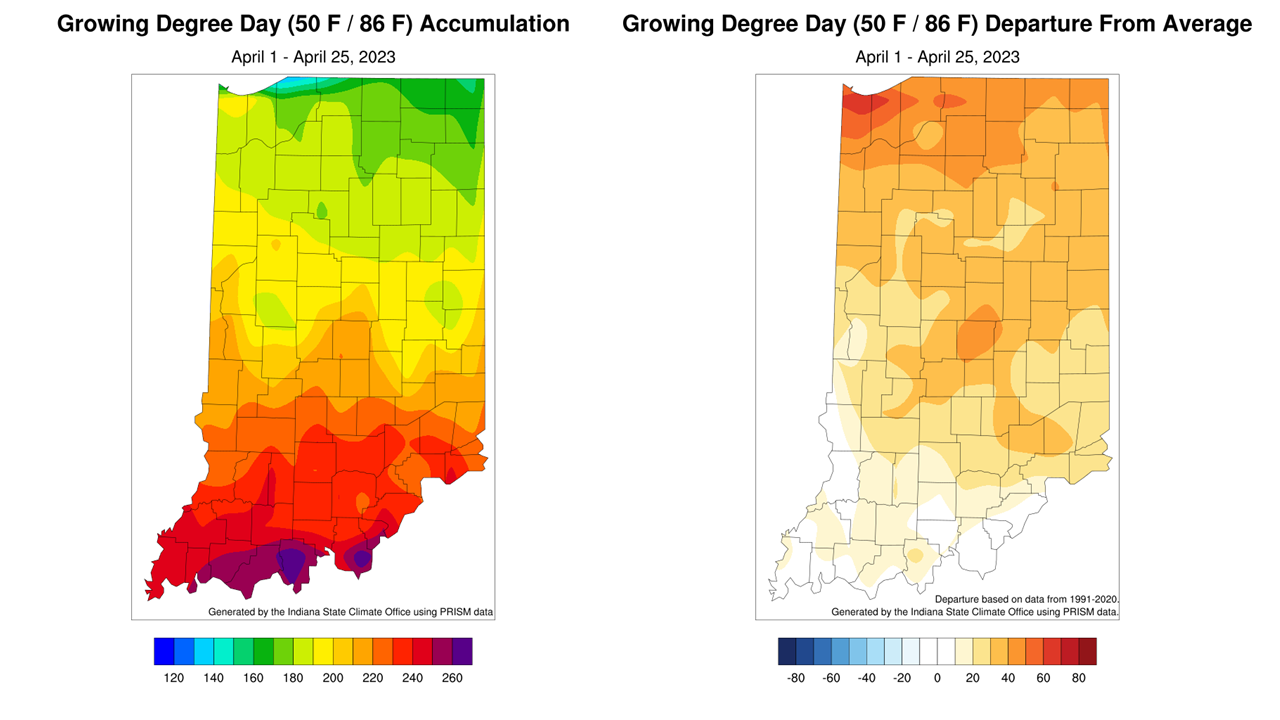
Figure 3: Total Accumulated Indiana Modified Growing Degree Days (MGDDs) April 1-25, 2023 (left) and Total Accumulated MGDDs represented as the departure from the 1991-2020 climatological normal (right).
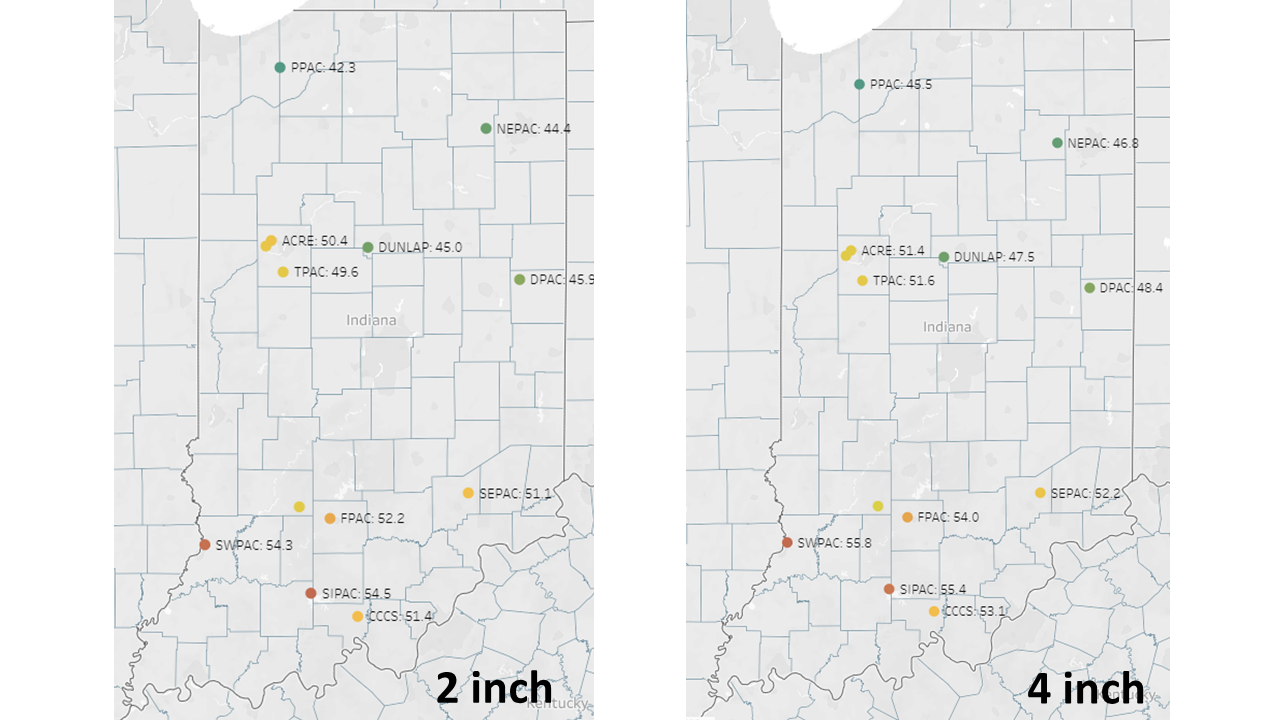
Figure 4: Two-inch (left) and four-inch (right) soil temperatures for stations located at Purdue Mesonet sites in Indiana. Data can be obtained from the Purdue Mesonet Data Hub.
The Weather Prediction Center’s 7-day forecast expects 0.01-1.00 inch of precipitation, with the heaviest amounts along the Ohio River (Figure 5). This pattern continues providing agricultural producers the opportunity to conduct fieldwork. The Climate Prediction Center’s (CPC) below-normal precipitation outlooks through May 10th (Figures 6 and 7) are also conducive to accessible fields. Let’s get to the bad news, shall we? Temperatures do not look to rebound for the next couple of weeks as the CPC’s outlooks indicate elevated chances for below-normal temperatures. Current models hint at a few days with warm temperatures sprinkled in, but overall, we’re trending below normal through the first couple weeks of May. We certainly are not out of the woods for frost/freeze potential as models have low 30s forecast through May 5th. Be sure to pay attention to any alerts issued by your local National Weather Service Forecast Office.
Figure 5: NWS Weather Prediction Center 7-day quantitative precipitation forecasts for the continental United States.
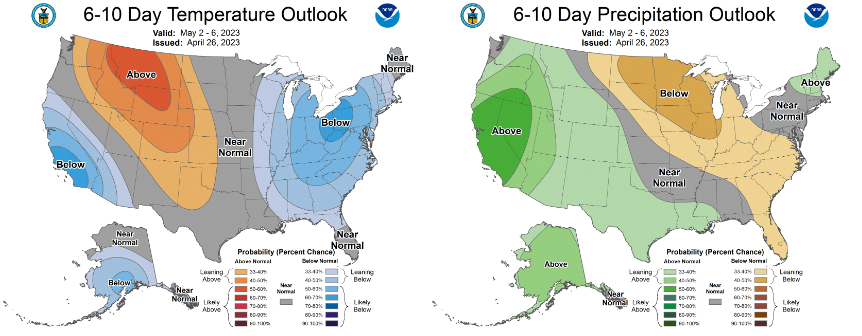
Figure 6: The CPC’s 6–10-day temperature and precipitation outlooks, valid for May 2-6, 2023.
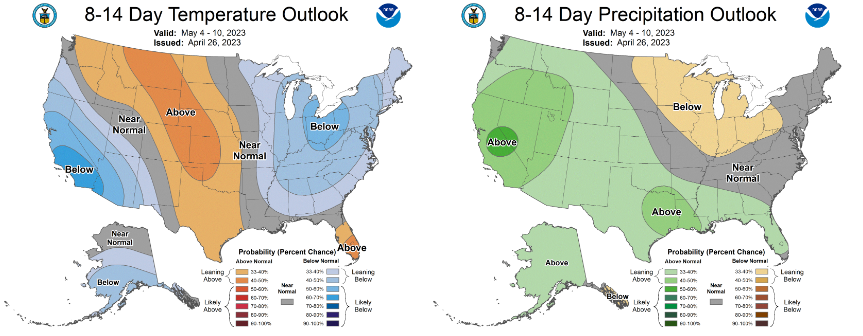
Figure 7: The CPC’s 8-14-day temperature and precipitation outlooks, valid for May 4-10, 2023.
