

Cooler weather has arrived as all of the Indiana climate divisions average temperatures were 1-1.8◦F above normal, compared to the 4-6◦F above normal temperature departures from a week ago. As of August 16, the statewide August average temperature was 74.2◦F (1.3◦F above normal) (Figure 1). Dips in the minimum temperatures were most notable as many stations recorded temperatures in the upper 40s to mid-50s throughout the week. Tipton County recorded a minimum temperature of 49◦F on August 14, which also coincided with a heavy dew event. Prolonged leaf wetness could lead to the onset of agricultural crop disease development across the state. Overall, though, average minimum temperatures ran 1-2◦F above normal for central and northern Indiana. Southern Indiana has experienced 2-4◦F above normal minimum temperatures so far for the month. Maximum temperatures have been normal for central and northern Indiana; whereas, southern Indiana maximum temperatures were 1-2◦F below normal. Modified Growing Degree Days (MGDDs) continued to run near normal to 104 percent of normal in south-central Indiana since April 1, 2022 (Figure 2).
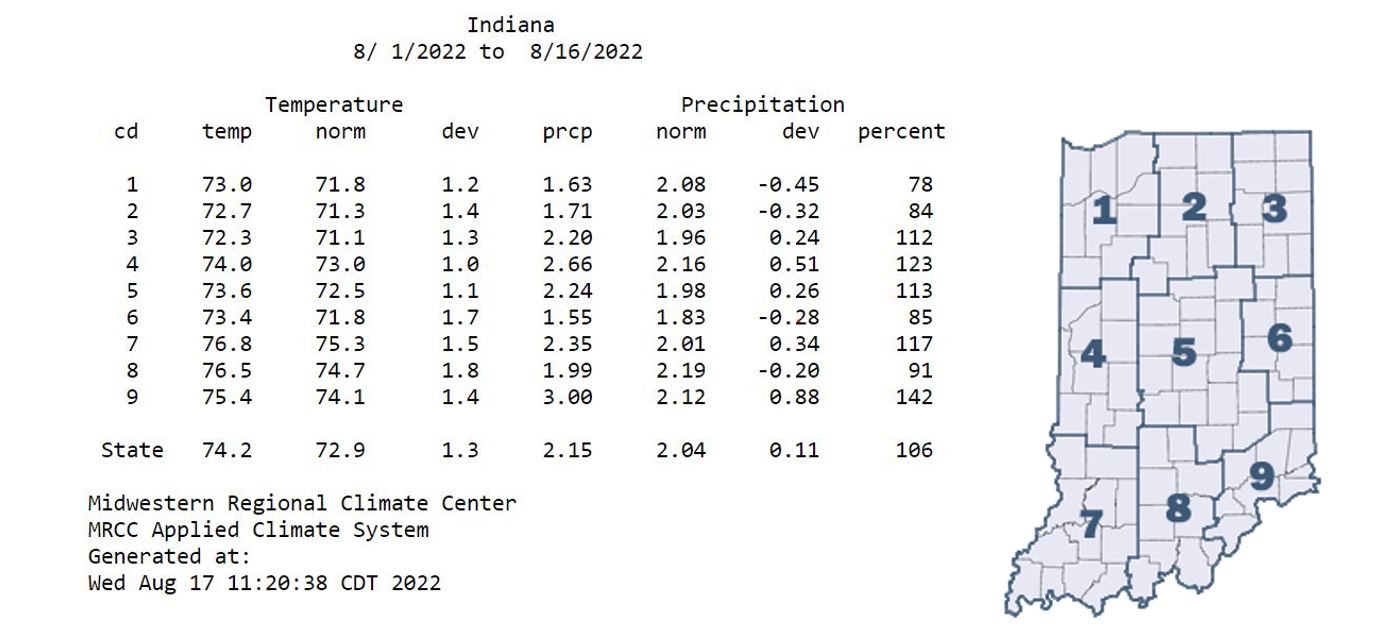
Figure 1. August 1-16, 2022 climate division and state average temperatures, normal temperatures, and temperature deviations, average precipitation, normal precipitation, precipitation deviations, and percent of normal precipitation compared to the 1991-2020 climatological averages.
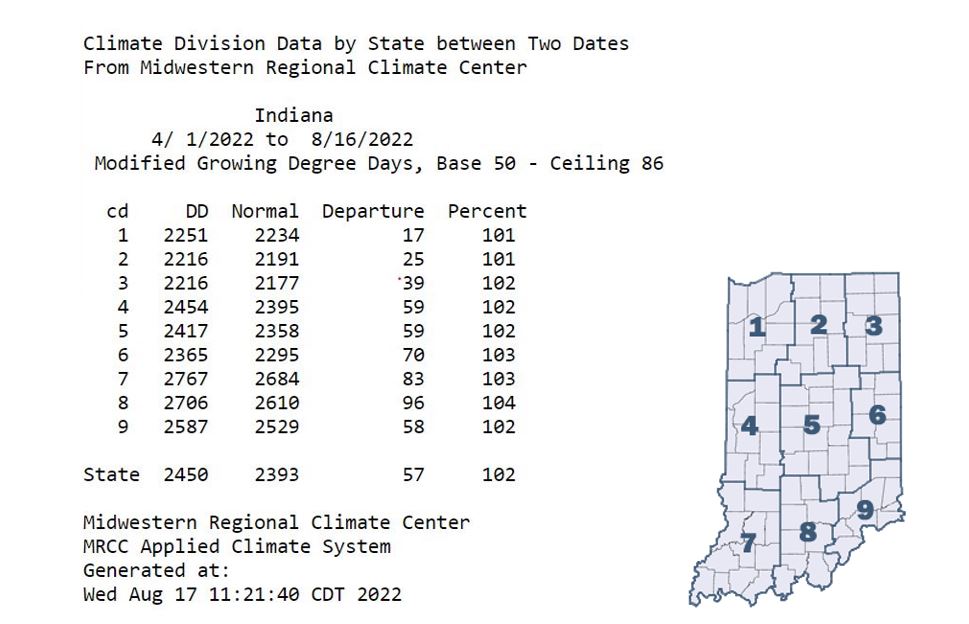
Figure 2. April 1 – August 16, 2022 climate division and state average MGDDs (Base 50◦F, Ceiling 86◦F), normal MGDDs, MGDDs departure from normal, and percent of normal MGDDs using the 1991-2020 climatological averages.
Regional differences in rainfall occurred across the state as northwestern and east-central Indiana received shy of 2 inches (Figure 1) through August 16, which was less than 80 percent of the 1991-2020 climatological average. Other locations in Indiana were 125-175 percent of normal (Figure 3). Extreme southeastern Indiana received in excess of 175 percent of normal rainfall. Patoka Lake (Dubois County) is still at the top of the list for total precipitation with 6.13 inches of rain, where 3.82 inches fell on August 6. Huntington County received the least amount of rainfall as 0.63 inches fell, which was 1.11 inches below normal. Many of the central Indiana USGS stream gauges continued to run below normal through much of the north-central and western parts of the state (Figure 4). Despite these measurements, the August 16 US Drought Monitor (Figure 5) saw removal of the Moderate Drought (D1) category and reduced area in the Abnormally Dry (D0) category.
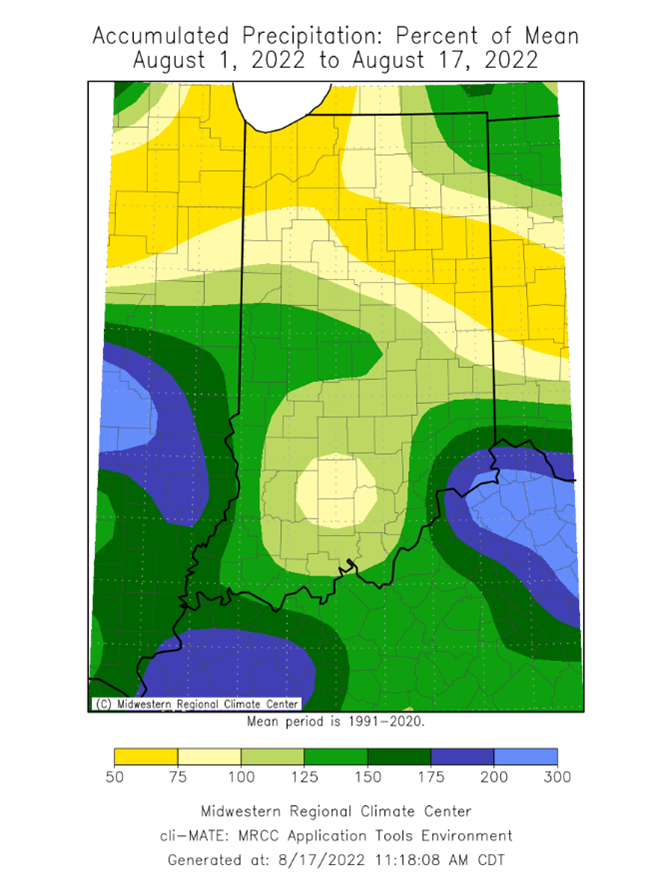
Figure 3. Accumulated precipitation from August 1-17, represented as the percent of the 1991-2020 normal precipitation that fell during that period.
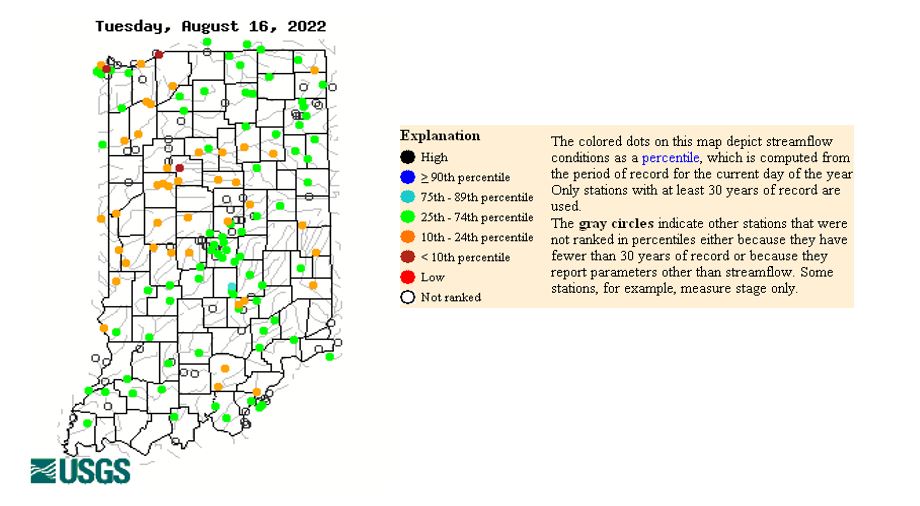
Figure 4. Seven-day average stream flows across Indiana as of Tuesday, August 16, 2022 using data from the USGS Water Watch.
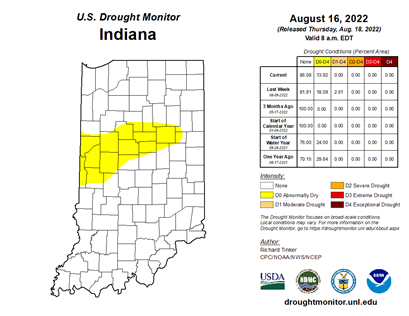
Figure 5. Indiana US Drought Monitor from August 16, 2022.
Turning attention to the Climate Prediction Center outlooks, the 6–10-day outlook (August 23-27) expects near normal temperatures to elevated chances of below normal temperatures (southwestern Indiana). There are increased chances of above normal precipitation in central and southern Indiana as well as near normal chances for the rest of the state (Figure 6). The 8–14-day outlook (August 25-31) follows similar confidence (Figure 7).
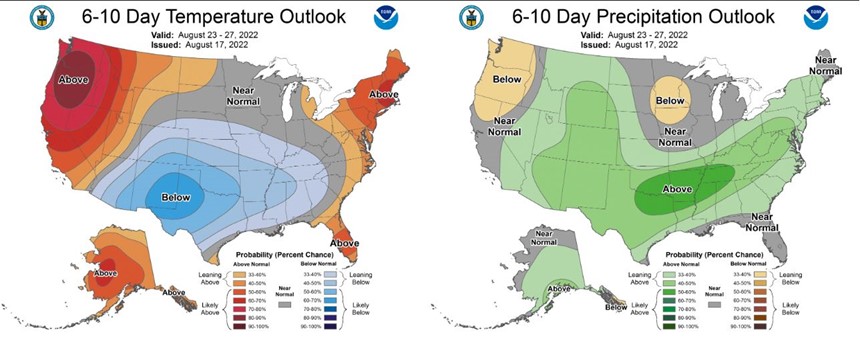
Figure 6. The CPC’s 6–10-day temperature (left) and precipitation (right) outlooks for August 23-27, 2022.
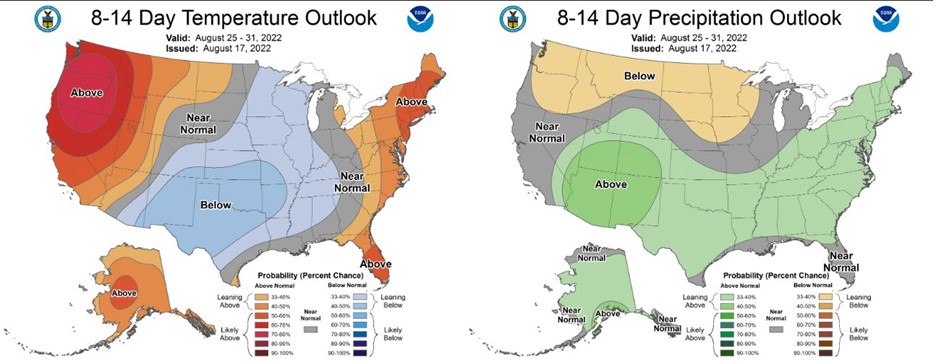
Figure 7. The CPC’s 8–14-day temperature (left) and precipitation (right) outlooks for August 25-31, 2022.
