
Pest & Crop Newsletter, Entomology Extension, Purdue University
- Overwintering Survival of Insects: Was It Too Cold For Them?
- Alfalfa Weevil Scouting Should Begin in Southern Indiana
- Pheromone Traps Have Detected Black Cutworm Arrival
- Black Cutworm Adult Pheromone Trap Report
- Glyphosate - Manganese Interactions And Impacts On Crop Production: The Controversy
- Keep An Eye Open For Sulfur Deficiency In Wheat
- Soybean Planting: Warm Temperatures and Itchy Trigger Fingers
Overwintering Survival of Insects: Was It Too Cold For Them? - (Christian Krupke and John Obermeyer)
- Cold winter temps probably not enough to affect overwintering pest populations.
- Below-ground (where insects overwinter) temperatures are typically not highly variable.
Although spring has come remarkably quickly, with April bringing some June-like temperatures to much of the Midwest, we are only a few weeks past what seems like a harsh, cold winter. In fact, while on the extension circuit during the winter, one of the most common questions I received was: “Will the cold kill some of our pest insects?” The answer is (as always): “It depends.” Most of our long-term established pests (rootworms, cutworms, corn borers) have been here for decades, and have experienced these extremes in the past, so its unlikely that their populations will suffer much. But it’s still worth a look at some actual data – weather station records – to see what preliminary conclusions we can make.
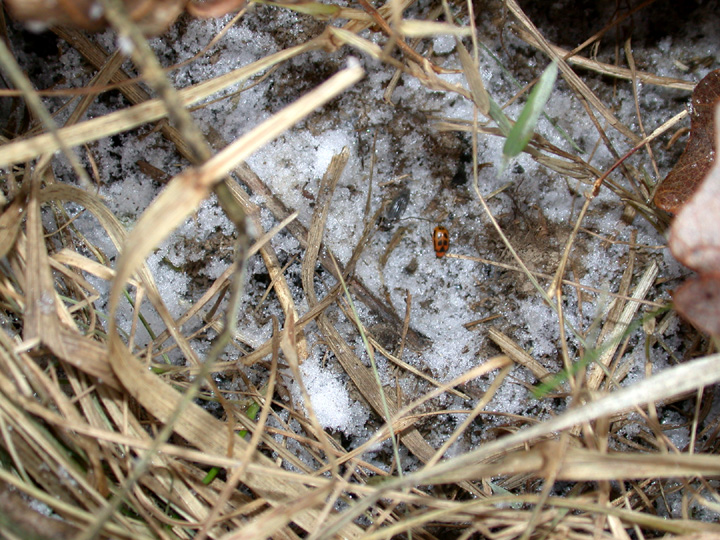
Bean leaf beetle overwintering under plant residues on a wood's edge
Consider the table below, which summarizes temperatures from the past eight winters. All data were taken at the Agronomy Center for Research and Extension (ACRE), not far from the main Purdue campus. Looking at the first data column from the left, we see the average air (or ambient) temperatures were lower last year than any others recently.
However, the more telling number appears in the next column, where the average temperatures at a 4” soil depth appear. Looking at this number, we see that the winter might not have been as harsh just a few inches below the surface. This is important because insects typically do not overwinter above-ground – seeking shelter and safety from the elements and predators below ground instead. This typically gives them much less variation in temperatures – the soil takes longer to warm up and cool down than the air does. Depending upon snow cover, temperatures in the soil will remain remarkably constant and often warmer than the air as the snow provides some insulation.
The point of this simple example is to show that insects have developed measures over the long-term for surviving what may look superficially like large fluctuations in temperature. Though this past winter was a cold one for those of us living and working above the ground, it’s unlikely that most overwintering insect populations were severely affected. The good news is that many field crop insects (e.g., western corn rootworm) went into wintering at very low numbers, due in part to another environmental extreme…saturated soils last spring. Now we will monitor to see how well they rebound during this growing season.
Winter |
Avg. Ambient Temp. (°F) |
Avg. 4" Bare Soil Temp (°F) |
|---|---|---|
| 09/10 | 25 | 31 |
| 08/09 | 29 | 31 |
| 07/08 | 28 | 32 |
| 06/07 | 29 | 33 |
| 05/06 | 31 | 35 |
| 04/05 | 30 | 35 |
| 03/04 | 29 | 31 |
| 02/03 | 26 | 32 |
![]()
Alfalfa Weevil Scouting Should Begin in Southern Indiana - (Christian Krupke and John Obermeyer)
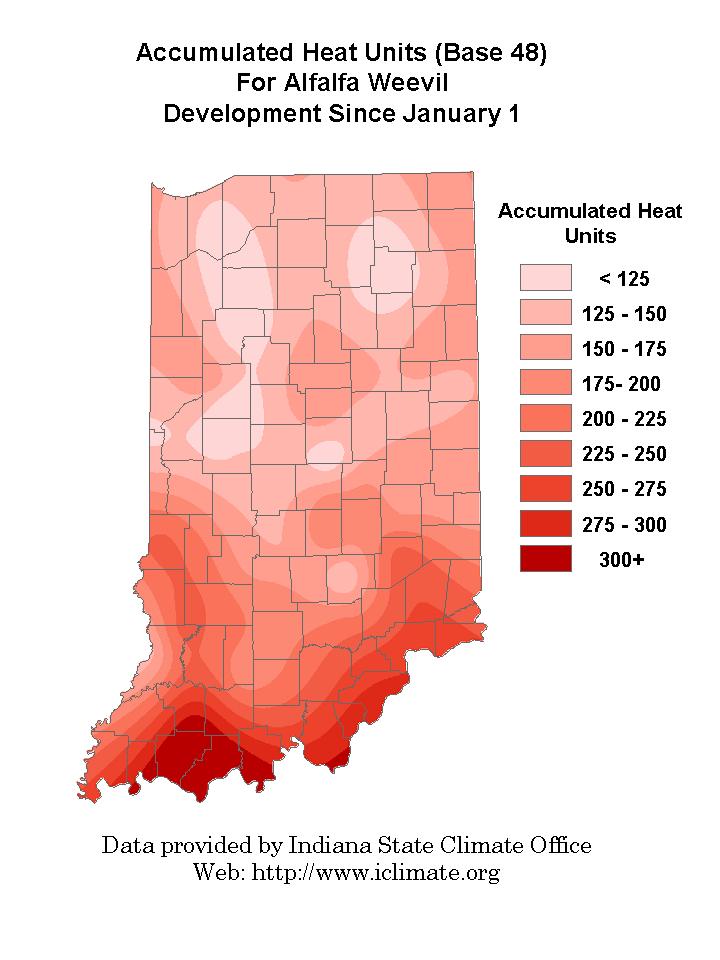
Field scouting for alfalfa weevil damage should begin when approximately 200 heat units, base 48°F, have accumulated from January 1 (see accompanying map). We have been racking up heat units over the past couple of weeks, so sampling should start in many areas. Sampling a field to determine the extent of alfalfa weevil damage and average stage of weevil development is best accomplished by walking through the field in an “M-shaped pattern.” Ten alfalfa stems should be examined in each of 5 representative areas of the field for a total of 50 stems from the entire field. Consider that south facing slopes and/or sandy soils warm sooner and should be included in the sampling. Each stem should be examined for: (1) evidence of tip feeding by alfalfa weevil larvae; and (2) maturity of the stem, i.e. pre-bud, bud and/or flowers. The average size (length) of weevil larvae should also be noted. Although large alfalfa weevil larvae are relatively easy to find, small larvae are difficult to see; thus, very close examination of leaves may be required to detect “pin-hole” feeding, small black fecal pellets and small off-white larvae.
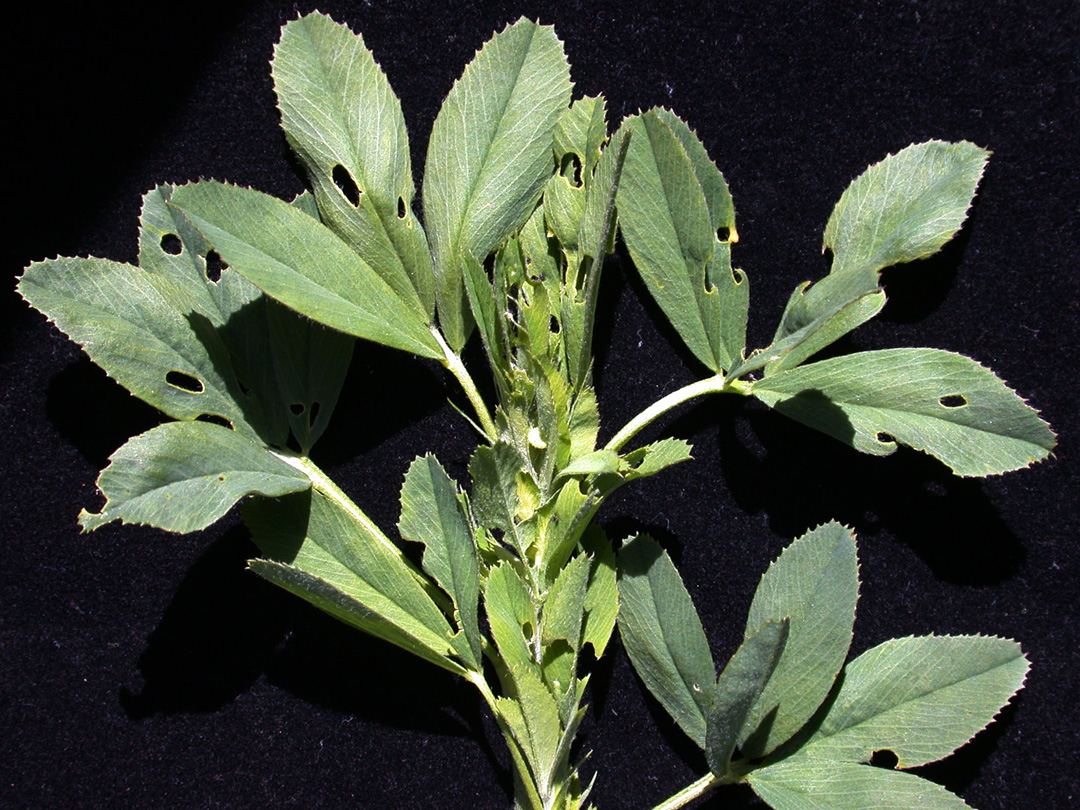
Early, "pin-hole," alfalfa weevil feeding
![]()
Pheromone Traps Have Detected Black Cutworm Arrival - (Christian Krupke and John Obermeyer)
- This pest is beginning its annual invasion to the Midwest.
- Moths arriving in mid to late April pose the greatest threat to crops.
- Heat unit accumulations from date of intense captures helps plan scouting activity.
Although catches are at barely detectable levels, our pheromone trap cooperators throughout the state are reporting that black cutworm moths are beginning their arrival into the Midwest from sites in south Texas and northern Mexico. Warm, moist air currents sweeping up from the Gulf Coast literally lift these moths up into the upper atmosphere and carry them into Midwestern states. The direction that these weather systems move and the number of moths that are carried within them will determine if they are brought into our area and whether or not they will pose a threat to our crops.
Our black cutworm pheromone trap cooperators throughout the state (see accompanying table), will continue to monitor the moth arrival. As we approach the more critical times for moth activity, namely mid to late April, we will be watching for what we refer to as an “intense capture.” This is defined as a period when 9 or more moths are caught in a trap over a two-day period. When and if this occurs, we will begin accumulating heat units (HU base 50°F) to determine when the first cutting of corn by the larvae should occur. This occurs approximately 300 HU after the intense capture. Watch for this information and Black Cutworm Adult Pheromone Trap Reports in future issues of the Pest&Crop.
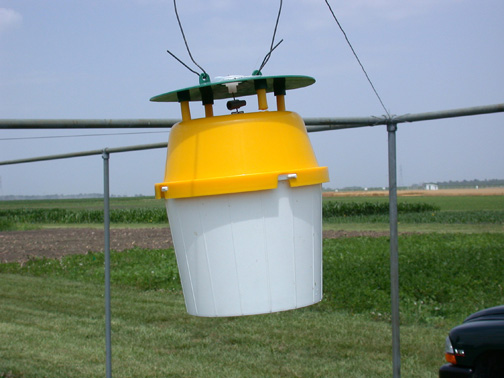
Black cutworm pheromone trap cooperators are using this bucket trap to monitor their arrival
![]()
Click here to view the Black Cutworm Adult Pheromone Trap Report
Glyphosate and Foliar Fertilizers - (Bill Johnson. Mike White, and Glenn Nice)
Manganese deficiency is occasionally observed in soybean grown in northern Indiana. Because Mn deficiency symptoms frequently appear near the time of postemergence glyphosate applications in glyphosate-resistant soybean, producers and custom applicators occasionally tank-mix glyphosate and foliar Mn fertilizer to reduce application costs. Research has shown that glyphosate efficacy is antagonized when it is tank-mixed with some Mn fertilizers and Mn-EDTA appears to be the least antagonistic of the Mn fertilizers.
We conducted a greenhouse study to evaluate the effect of a couple of Mn fertilizers on glyphosate efficacy on velvetleaf and common waterhemp, two weeds which have shown variable tolerance to glyphosate. To conduct this study, we planted velvetleaf and waterhemp seeds in styrofoam cups and allowed the weeds to grow to 4 to 6 inches in height. The treatments were applied with a greenhouse track sprayer calibrated to deliver 15 GPA. The glyphosate rate used was 11 oz/A or about 1/2 of the normal labeled rate. We used a low rate in an attempt to exaggerate the differences that can occur when spray conditions in the field are less than idea (i.e. big weeds, drought conditions). The treatments were applied in either de-ionized water or in well water. The well water is considered hard water with significant concentrations of calcium and iron in it. The Mn fertilizer solutions consisted of 6% Mn Sulfate applied at 32 oz/A and 6% Mn EDTA applied at 36 oz/A.
Figure 1 shows that hard water will reduce the ability of glyphosate to control of velvetleaf and waterhemp. Hard water reduced glyphosate efficacy on velvetleaf at least 20% at 1 and 4 weeks after treatment. Hard water reduced glyphosate efficacy on waterhemp 50% at 1 WAT and 30% at 4 WAT.
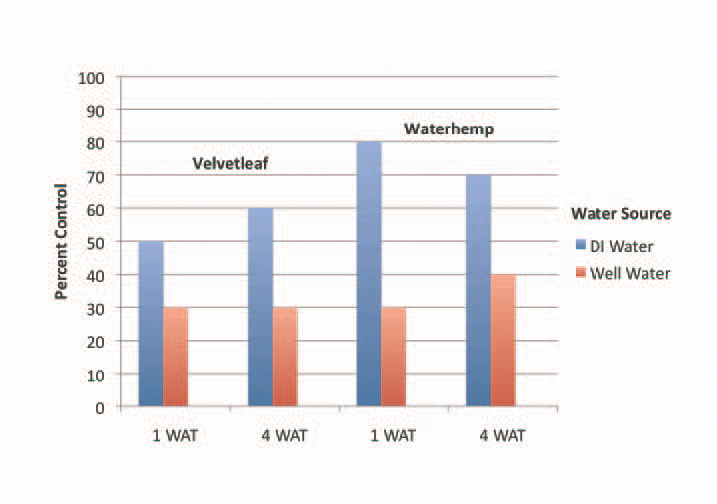
Figure 1. Velvetleaf and waterhemp control in deionized vs. well water
Figure 2 shows the effect of Mn fertilizers on glyphosate efficacy in deionized water. A reduction in efficacy was also noted when Mn sulfate and Mn EDTA were tankmixed with glyphosate in de-ionized water (Figure 2). Velvetleaf control was reduced at least 20% by the fertilizers and waterhemp control was reduced at least 30% by the fertilizers.
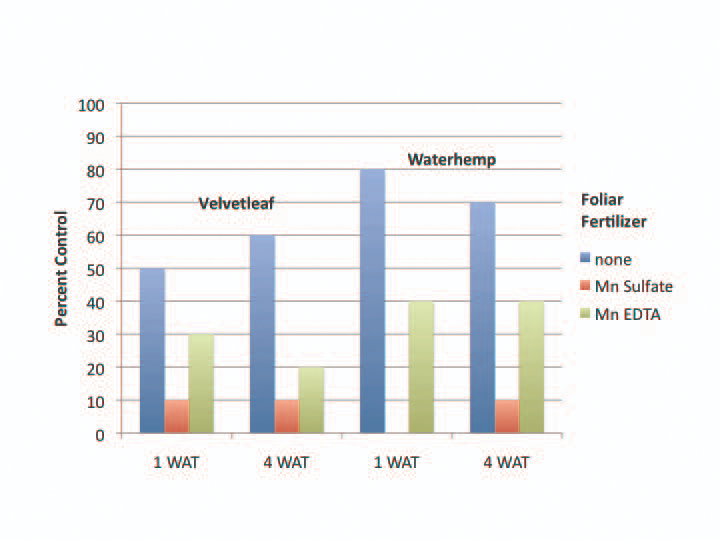
Figure 2. Velvetleaf and waterhemp control with glyphosate +foliar fertilizers in deionized water
Figure 3 shows the effect of Mn fertilizers on glyphosate efficacy in hard water. A slight reduction in efficacy on velvetleaf by foliar fertilizers was noted when treatments were applied in well water (Figure 3). On waterhemp, Mn sulfate reduced glyphosate efficacy at 1 and 4 WAT. Mn EDTA did not reduce glyphosate efficacy at 1 WAT, but did reduce glyphosate efficacy at 4 WAT. The antagonistic effect of the Mn fertilizers was less, but overall control was lower to start with.
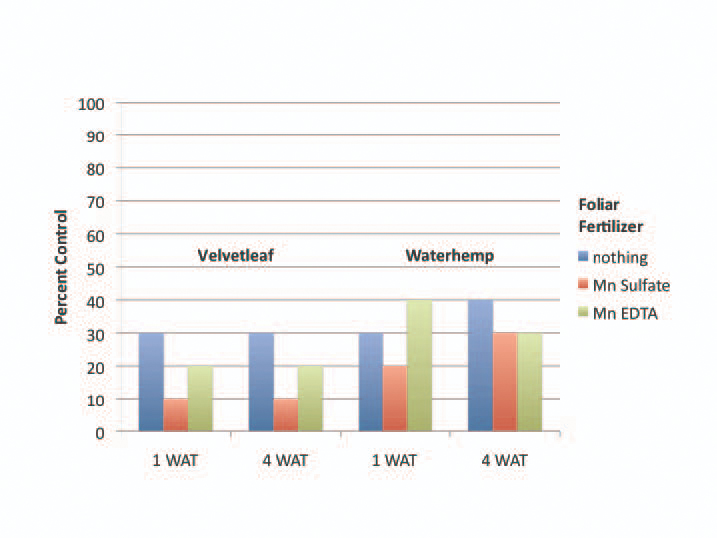
Figure 3. Velvetleaf and waterhemp control with glyphosate+foliar fertilizers in well water
Take Home Points:
1) Hard water can have a dramatic effect on herbicide activity. Remember to add ammonioum sulfate to the tank before herbicides are added to reduce the effect of hard water cations on glyphosate efficacy.
2) Mn EDTA is less antagonistic to glyphosate than Mn sulfate. However, both can reduce glyphosate efficacy on velvetleaf and waterhemp.
Soybean Disease Monitoring in 2010 – (Kiersten Wise)
As Indiana soybean producers well know, the risk of soybean rust to Indiana soybean production from year-to-year is hard to predict, and depends primarily on weather patterns and the level of disease that develops throughout the year in the southern U.S. Because of this, a sentinel plot system has been implemented in Indiana, and other soybean producing states, to monitor the seasonal, northward spread of soybean rust from the southern U.S. Indiana has participated in the national effort to monitor the soybean crop for soybean rust using the sentinel plot system since 2005, and through this program, we have been able to detect soybean rust infections at very low levels in Indiana in 2006, 2007, and 2009. This monitoring system greatly improves our ability to detect soybean rust early enough to issue fungicide spray advisories, if needed.
What Indiana soybean producers may not know is that the sentinel plot system in Indiana also provides observations on many other diseases within the state. Soybean sentinel plots are monitored for potential disease threats to the soybean crop, and used to help determine distribution and severity of foliar diseases such as frogeye leaf spot, brown spot, downy mildew, and Cercospora leaf blight, to name a few. The tools we use to provide updates on soybean rust, such as the email list serve, the toll-free hotline, and the ipmPIPE website, also serve to distribute updates on foliar diseases as well as damaging diseases like SDS, white mold, and charcoal rot.
Indiana will once again participate in the national sentinel plot system, and will monitor 11 fields on a weekly basis for soybean diseases, including rust, beginning in June. Support for the monitoring program is provided by the Indiana Soybean Alliance. Weekly updates on soybean growth stages, crop condition, and disease observations will be posted online at the ipmPIPE web site (http://www.sbrusa.net) by clicking on the state of Indiana on the national map. Producers are also able to track the movement of soybean rust at this website.
Indiana soybean producers can also subscribe to the Indiana soybean disease update list serve, at <https://lists.purdue.edu/mailman/listinfo/indiana-soybean-update>. This email alert service will provide convenient and timely updates on soybean disease monitoring in Indiana, and also provide information on fungicide spray applications if soybean rust reaches Indiana at a critical time during the growing season. Purdue University will continue to maintain a toll-free soybean disease hotline, which is updated weekly beginning in late June. The phone number is 866-458-RUST (7878). We will also provide updated commentary in the Pest&Crop newsletter as the season develops.
![]()
Scout Wheat Fields for Virus Diseases - (Kiersten Wise)
Wheat is at or approaching Feekes growth stage 6, also known as jointing, in most areas in southern Indiana. Wheat in Tippecanoe county is still at Feekes 4 to 5 in some fields. While most wheat is in good condition, scouting reports in southern Indiana indicate that wheat virus diseases may be present in some fields. Fall soil conditions were favorable for soil-borne wheat virus infection in 2009, and wheat spindle streak (or yellow) mosaic virus (WSSMV), and soil-borne wheat mosaic virus (SBWMV) were confirmed by the Purdue Plant and Pest Diagnostic Lab (P&PDL) in several wheat samples in Indiana last year.
Virus diseases of wheat are difficult to tell apart in the field and require lab testing for accurate diagnosis. Infected plants typically first appear in uneven patches of yellow or light green within a field, which can be confused with nitrogen deficiency or winter injury. Yellow-green streaks may be present on leaves and stunting and/or dieback of leaf tips can occur in infected plants. The level of symptom expression can depend on variety susceptibility. Soilborne wheat mosaic virus can also cause a rosette symptom in susceptible varieties, which results in excessive production of severely stunted tillers. Plants infected with either virus may produce fewer stems and heads, and have reduced kernel number.
Soilborne wheat mosaic and Wheat spindle streak mosaic virus infect wheat plants in the fall. Both viruses are transmitted to wheat roots by the soil-borne fungus Polymyxa graminis. This fungus does not cause damage to wheat by itself, but when cool, wet soil conditions are prevalent in fall, the fungus infects wheat roots and transmits the viruses to wheat plants. Symptoms of virus infection are not apparent until spring, and the severity of symptom expression depends on variety susceptibility and weather. Prolonged cool temperatures in spring (under 60°F) enhance symptom development of both diseases in infected fields.
Although no control methods are available to reduce symptoms in currently infected plants, it is still important to get an accurate diagnosis for management of future wheat plantings. Crop rotation may not prevent infection since the fungus that transmits the virus can survive in the soil for over 5 years. Therefore, the best way to manage these diseases is to plant resistant varieties in areas with a previous history of the diseases. Varieties are available with good resistance to one or both of the mosaic virus diseases. Be sure to check the variety if you have problems with both soilborne virus diseases in a single field, since some varieties are resistant to only one virus.
The P&PDL provides testing for the presence of WSSMV, SBWMV, Wheat streak mosaic virus (WSMV) and 5 strains of Barley yellow dwarf virus (BYDV) with a multiplexed PCR detection assay. For an accurate diagnosis it is important to dig and submit entire plants exhibiting symptoms (see submission information at <http://www.ppdl.purdue.edu>). A minimal virus testing fee of $25.00 is made possible through supplemental diagnostics grant funds provided by the National Plant Diagnostic Network <http://www.npdn.org/>.
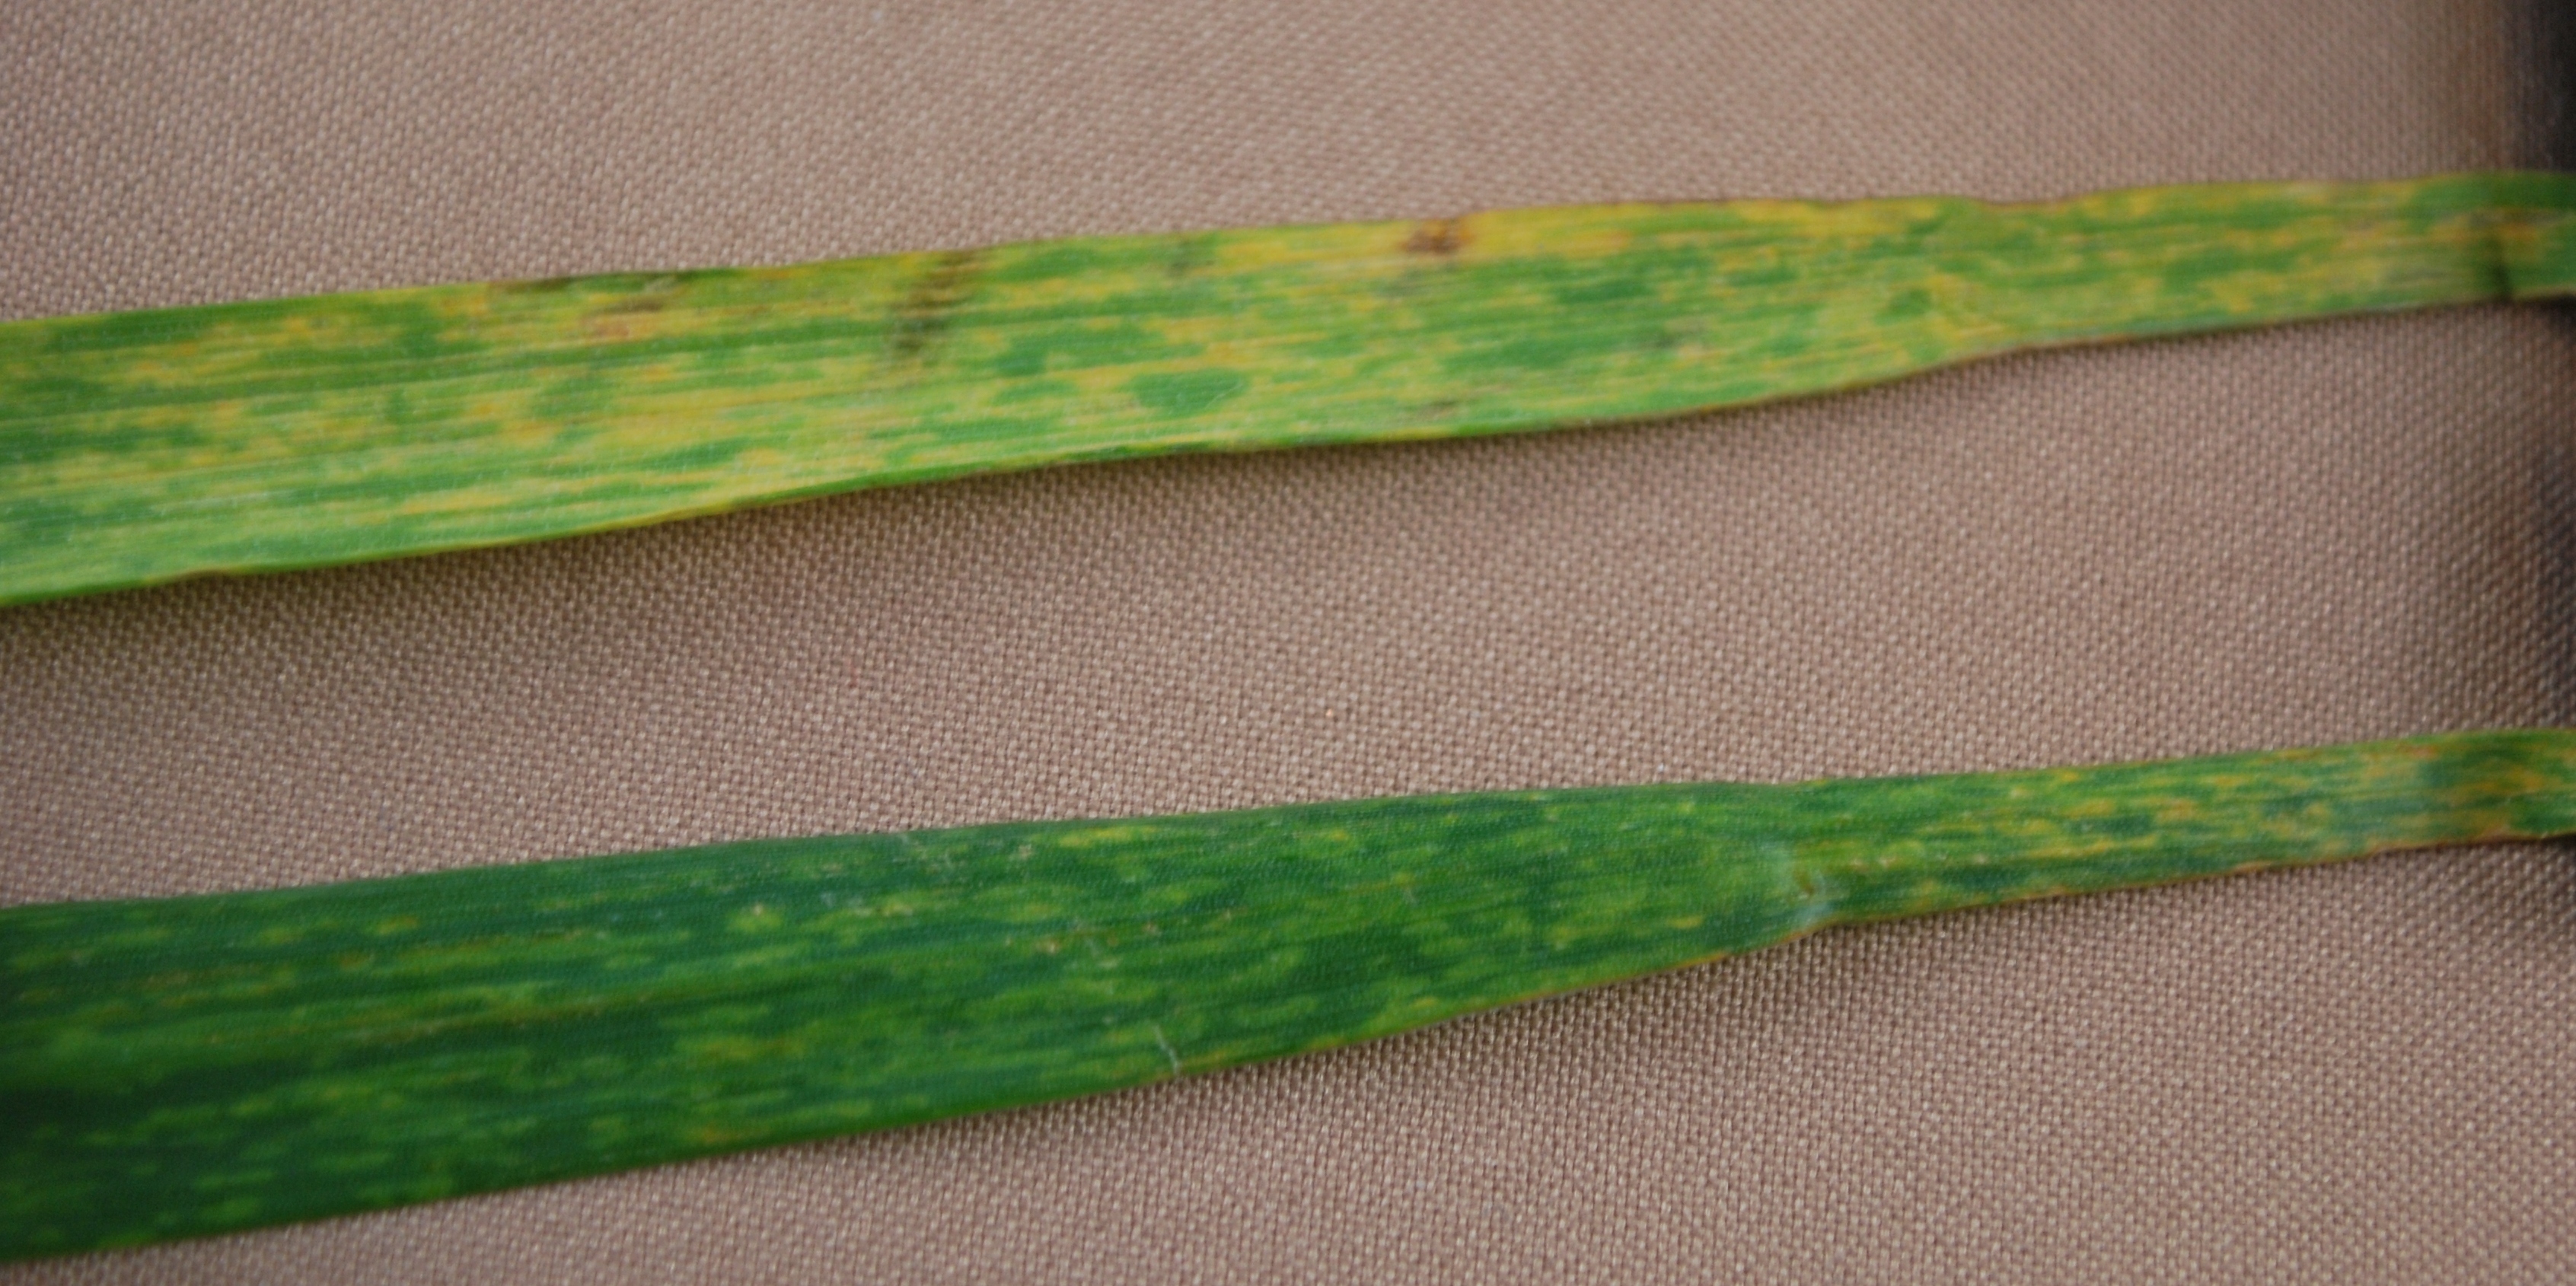
Figure 1. The yellow streaking on the wheat leaf is a common symptom of either mosaic virus disease
Glyphosate – Manganese Interactions and Impacts on Crop Production: The Controversy – (Jim Camberato, Kiersten Wise, and Bill Johnson)
We have been getting many phone calls concerning the recent No-Till Farmer article ‘Are We Shooting Ourselves in the Foot with the Silver Bullet?’ <http://fhrfarms1.com/notillglyphosate.pdf>. In this article based on an interview with Dr. Don Huber (retired plant pathologist from Purdue University), it is alleged that the non-judicious use of glyphosate has induced micronutrient deficiencies which have led to more plant disease. In our opinion the doomsday scenario painted by this article is greatly exaggerated. A more balanced assessment of the non-target effects of glyphosate is available in the article ‘Glyphosate Manganese Interactions in Roundup Ready Soybeans’ <http://www.weeds.iastate.edu/mgmt/2010/glymn.pdf> written by Dr. Bob Hartzler (weed scientist at Iowa State University). The extent of glyphosate and glyphosate-resistant crops on the manganese (Mn) nutrition of soybeans is not agreed upon, nor fully understood. We are concerned that the article in No-Till Farmer encourages growers to make drastic changes to their fertility, weed, and disease management programs out of fear, not understanding. We suggest the following approach to managing Mn deficiency in soybeans.
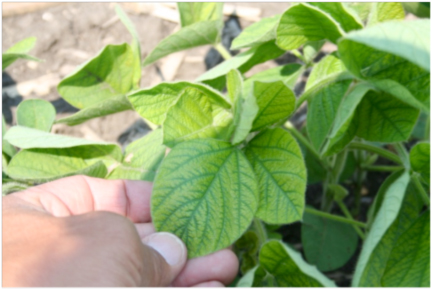
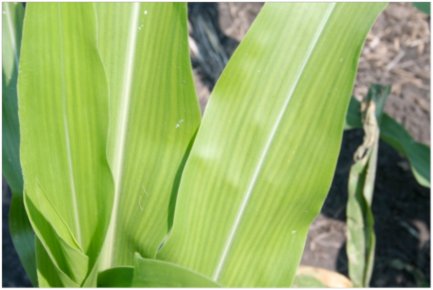
Figure 1. Classic symptoms of manganese deficiency on soybean and corn grown on high pH, high organic matter soils at the Pinney Purdue Agriculture Center, Wanatah, Indiana
Manganese deficiency of soybean is not a new phenomenon, being identified as a problem in particular soils of northern Indiana nearly 75 years ago. Manganese deficiency of corn is less common and less severe than in soybean, but occurs in the same soils and geographic region. Alleviating Mn deficiency still remains difficult even though we have known about it for a long time.
Manganese deficiency is not hard to spot. Symptoms of Mn deficiency are distinctive, interveinal yellowing of the leaf while the veins remain dark green (Photo 1). Analyzing the Mn concentration of the uppermost fully expanded trifoliate leaf of soybean or the earleaf of corn has traditionally been used to confirm Mn deficiency. In the past, leaf Mn greater than 20 parts per million (ppm) was considered sufficient for both crops. Recently however, Mn deficiency in soybean has been documented at leaf Mn greater than 30-40 ppm. A recent assessment of the corn leaf Mn critical level is not available.
Soil conditions promoting Mn deficiency are high pH and low soil moisture. In many northern Indiana soils high pH is an inherent characteristic of the soil, not a result of over-liming, so it is not easily changed by the farmer. Higher organic matter is also associated with increased Mn deficiency. Thus, Mn deficiency often occurs in depressional areas in mineral soils and on muck soils. The soil test Mn level needed for sufficiency is pH and soil organic matter dependent (Table 1). When liming is needed on mineral soils prone to Mn deficiency, maintain soil pH below 6.3. On organic soils keep pH below 5.8. Rainfall can alter the severity of Mn deficiency within and between seasons - the wetter the soil the greater the Mn availability. Manganese deficiency symptoms will often disappear during periods of high rainfall and get more severe with drought. Manganese availability is higher in soybean-corn rotations than in continuous soybean.
| Soil pH | Mineral Soils | Organic Soils1 |
|---|---|---|
| Soil Test Level Needed for Sufficiency, ppm2 | ||
5.8 |
1 |
8 |
6.0 |
3 |
14 |
6.2 |
7 |
19 |
6.4 |
11 |
25 |
6.6 |
14 |
30 |
6.8 |
18 |
35 |
7.0 |
21 |
51 |
1Greater than 20% organic matter content. |
||
Soil-applied fertilizer Mn is relatively ineffective at correcting Mn deficiency because it becomes unavailable soon after application. To maximize the availability of soil applications, band the Mn fertilizer in 2x2 placement with an acid-forming phosphorous-containing fertilizer, for example Mn sulfate and 10-34-0 (ammonium polyphosphate). Recommended rates of application are 1-12 pounds of Mn per acre and vary dependent on soil-test Mn, soil pH, and organic matter. In situations where Mn deficiency is expected to be severe a banded application may produce a large enough plant to spray with a foliar Mn fertilizer later.
Foliar-applied Mn is the most effective method for overcoming Mn deficiency in most situations. For maximum effectiveness apply Mn as soon as deficiency symptoms appear. Yield is decreased about 5% for each week delay in spraying after Mn deficiency symptoms first appear. Since Mn is not readily remobilized within the plant, deficiency symptoms often reappear requiring a 2nd or possibly 3rd application. A rate of 0.2-0.5 pounds of Mn per acre per application is sufficient for maximum yield in most cases. When sprayed alone (without glyphosate) most Mn fertilizers are equally effective, thus cost becomes the primary factor in choosing an economical Mn fertilizer.
All Mn fertilizers interact with glyphosate in a tank mix, some more than others, resulting in reduced herbicide efficacy and lower Mn availability. The reduction in herbicide efficacy is most likely noticed when attempting to control weeds that glyphosate has trouble with, such as velvetleaf (Photo 2). Manganese EDTA is the least antagonistic Mn fertilizer to glyphosate and it is preferred for tankmixing, especially when hard to control weeds are prevalent in the field to be treated. Alternatively, foliar Mn may be applied in a separate application 7-10 days after the glyphosate application. However, the delay in Mn application may result in yield loss, negating some of the benefit of separate Mn fertilizer and glyphosate applications.
Summary
Manganese deficiency symptoms on soybean are obvious and typically occur in the same fields and same areas of a field year after year. If you are farming a field with a history of Mn deficiency, be prepared to address it when it occurs. If deficiency is severe, consider banding Mn with an acidifying phosphorous-containing fertilizer to produce enough leaf area to treat with a foliar Mn fertilizer. Apply foliar Mn as soon as deficiency symptoms appear and again if they reappear. If tankmixing Mn with glyphosate, choose a form that is minimally antagonistic to the glyphosate. Yield reductions can occur when Mn is applied to soybean not needing Mn, so ‘insurance’ applications of Mn are not recommended. Routine applications of Mn or other micronutrients to alleviate the alleged impacts of glyphosate on plant disease are also not warranted. Glyphosate applications should be managed to avoid weed resistance. For more information on how to diagnose the development of glyphosate-resistant weed populations, use glyphosate most effectively, and control specific glyphosate-resistant weeds, go to the Glyphosate, Weeds, and Crops site at <http://www.glyphosateweedscrops.org>.
![]()
Keep an Eye Open for Sulfur Deficiency in Wheat – (Jim Camberato1 and Shaun Casteel)
Severe sulfur (S) deficiency in our wheat experiment (thankfully a S response trial) at the Southwest Purdue Ag. Center in Vincennes, IN has prompted us to alert farmers and their advisors to be aware of the potential for S deficiency in wheat as well as corn and alfalfa later in the season.
Sulfur Deficiency of Crops Will Become More Common in the Future
Atmospheric S deposition used to be substantial enough to satisfy crop needs. However because power plants have reduced S emissions, crops are reliant more on soil S supply. The incidence and severity of S deficiency is expected to increase as a result and applying fertilizer S will be necessary to provide sufficient S. Sulfur deficiency is most likely in sandy soil with low organic matter, but can also occur in silt loam soil with moderate organic matter levels. No-till systems and heavy residue are also thought to increase the chance of S deficiency.
Identifying Sulfur Deficiency
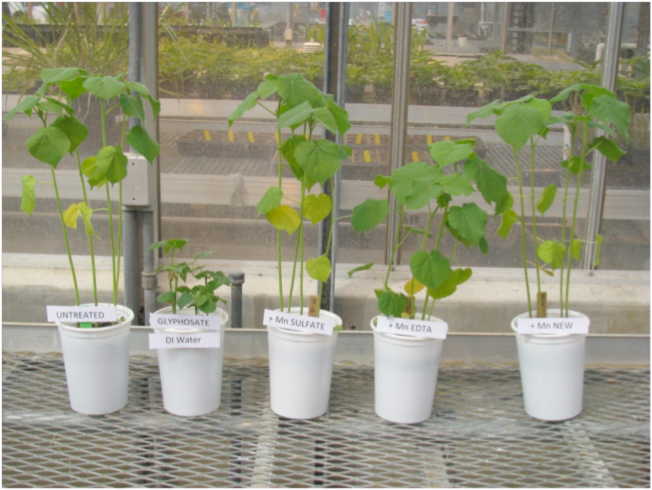
Sulfur deficient crops typically have an overall yellow appearance similar to N deficiency (Photo below). However S is not as mobile in the plant as N, so lower leaves do not show more severe deficiency symptoms than the upper leaves unlike N. In corn, S deficiency may also cause leaf striping in addition to an overall yellow color. Sulfur deficiency is more likely in corn, wheat, and alfalfa than in soybean. If S deficiency is misdiagnosed as a N deficiency the application of fertilizer N will make S deficiency worse, so tissue sampling is recommended to positively identify the limiting nutrient.

-Sulfur - Wheat with no sulfur fertilizer and 100 lb N/ac flanked by two 30 lb S/ac gtreatments (Photo Credit: Dennis Nowaskie)
In the plant, S is a component of two amino acids and occurs in protein in a ratio of 1 part S to about 15 parts N. Therefore the N:S ratio of plant tissue as well as the S concentration are used to identify S deficiency. The lower the S concentration and the higher the N:S ratio the more likely S is deficient in the plant. Tissue S less than 0.12% and N:S ratio greater than 20:1 are most likely S deficient. Sulfur is most likely adequate when tissue S is greater than 0.20% and N:S ratio is less than 12:1. Tissue S and N:S values in between these levels an go either way – deficient or adequate.
Soil Sulfur May Not Be Enough
Most soil S is in the organic form, however plants accumulate only sulfate-S. Organic-S is mineralized to sulfate by bacteria in much the same way as organic-N is ultimately converted to nitrate-N. Warm moist soils promote mineralization so S deficiencies are more likely to occur when soils are cold in the spring than during the remainder of the growing season. No-tillage and heavy residue may also decrease S mineralization. Sulfate, similar to nitrate, is highly mobile in soil, leaching below the root zone with excess rainfall. Soil testing for sulfate-S has not be considered reliable because of this mobility.

+Sulfur - Wheat with 30 lb sulfur/ac and 100 lb N/ac flanked by two 0 S/ac treatments
(Photo Credit: Dennis Nowaskie)
Correcting Sulfur Deficiency
Sulfur fertilizer should be applied as close to crop needed as possible to reduce the chance it will be lost from the root zone by leaching. Often including S in a fertilizer program to avoid S deficiency is more efficient and less costly than correcting a S deficiency once it occurs. Typically soil applications of 15-40 pounds of sulfate-S per acre are sufficient to prevent S deficiency.
Adding ammonium thiosulfate (12-0-0 26%S) to urea-ammonium nitrate solutions (*like 28-0-0) or blending ammonium sulfate (21-0-0 24%S) with urea (46-0-0) are convenient and cost effective ways to provide S. Potassium-magnesium sulfate (0-0-22 21%S 11%Mg) can be blended with muriate of potash (0-0-60) to provide S and K. Gypsum (about 20%S) if pelletized can be blended with other ertilizers or if ground, applied with a lime spreader.
1For more information, contact Jim Camberato (765-496-9338, jcambera@purdue.edu) or Shaun Casteel (765-494-0895, scasteel@purdue.edu).
![]()
Soybean Planting: Warm Temperatures and Itchy Trigger Fingers – (Shaun Casteel)
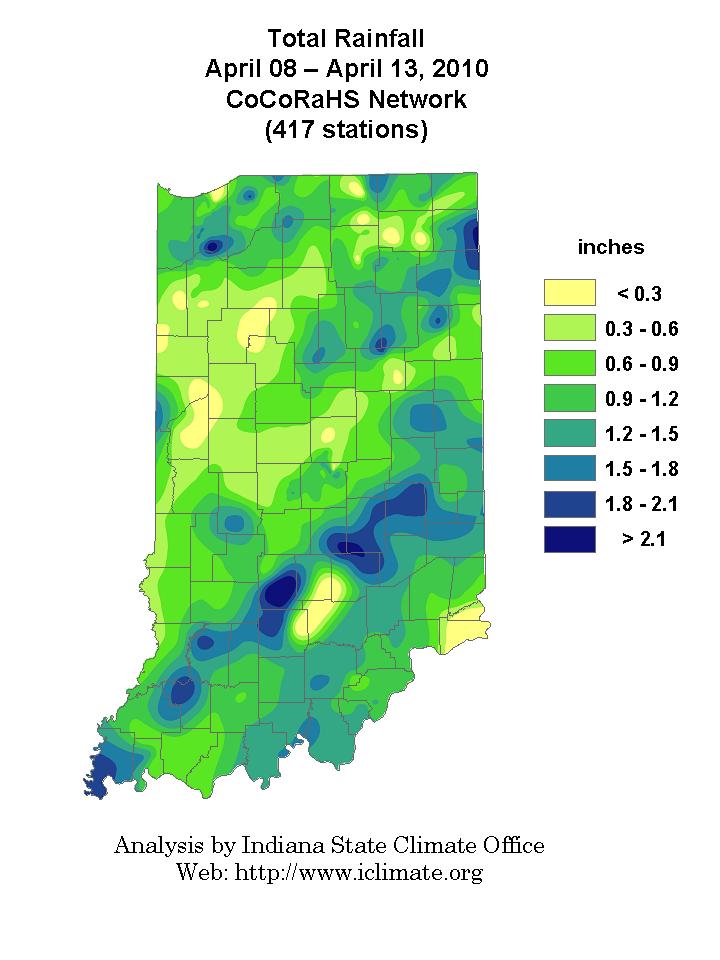
Spring has sprung … for now. Air temperatures were 4 to 8°F warmer than normal over the past 30 days and 8 to 12°F warmer than normal over the past 7 days across Indiana (www.iclimate.org). We welcome this spring weather as many are trying to catch up from the prolonged harvest this past fall which limited tillage and applications of fertilizers, lime, and herbicides. Our trigger finger for planting soybeans is itchy, and we need to discuss the optimal planting window for soybeans in Indiana.
Several producers and crop consultants from southern to northern Indiana told me this past winter that they shoot to have soybeans in the ground by tax day (some even earlier). I even heard of soybeans planted on April Fool’s Day this year. Let’s proceed with caution.
During the Purdue Crop Management Workshops in January, I asked “What is the optimal time to plant soybeans for high yields?” (Figure 1). Twenty six percent chose Late April followed by 46% for early May and 23% for mid-May when averaged over the regions of the state. Interestingly, the southern locations tended to chose later planting dates than the northern and central parts of Indiana.
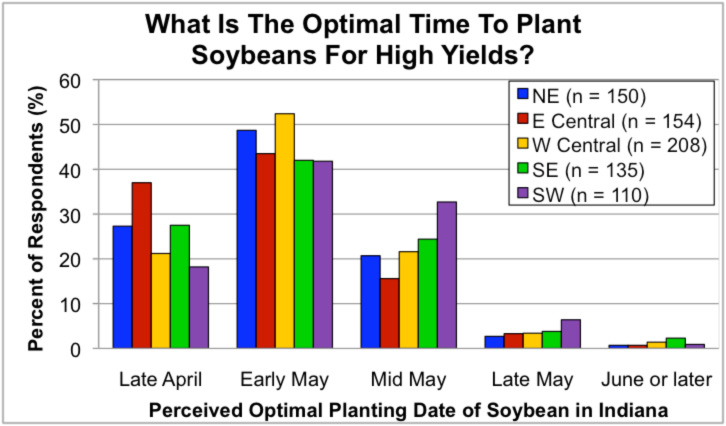
Figure 1. 2010 Purdue Crop Management Workshop participants' response to the optimal planting date for soybean. NE=northeastern IN, E Central=east central IN, W Central=west central IN, SE=southeastern IN, and SW=southwestern IN
Soybean yield potential and probability of success is greatest during the first three weeks of May across Indiana (Figure 2). The yield potential tends to be lower prior to May and it decreases substantially as planting dates are pushed beyond May. Soybean plantings in 2009 were late May to early June in many areas of Indiana yet yields were very good. Why? The cool growing season in 2009 reduced the heat stress during flowering thereby increasing flower retention, and adequate soil moisture allowed for good pod development. The good weather in August finished filling out the pods and seeds. Soybeans were able to fully mature without any early fall frosts. The combinations of these growing conditions allowed soybean yields to be good in spite of the later plantings. Optimal planting dates are the probability of success year in and year out.
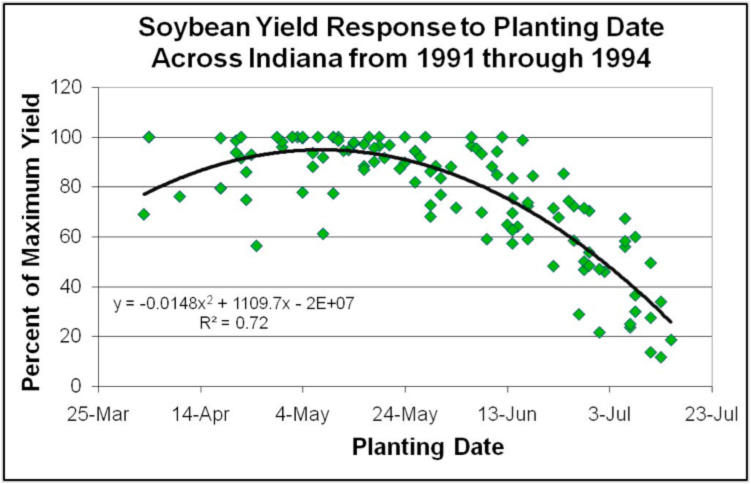
Figure 2. Soybean planting dates from southern to northern Indiana in 1991 to 1994
It is important to realize that these planting dates are based on soybean seed that is not treated with fungicides or insecticides. Soybean seed treatments have been on the rise over the past few years, which have impacts on our soybean management decisions. Theoretically, we should be able to plant soybeans earlier (typically cool, wet soils) with protection from diseases and with in-“vigor”-ration effects of various products. However, we do not presently have data to warrant an early shift in our planting date recommendations. We will discuss soybean seed treatments – fungicides, insecticides, inoculants, and plant growth promoters – in next week’s article.
![]()