
Pest & Crop Newsletter, Entomology Extension, Purdue University
- Western Bean Cutworm Season Begins With a Flurry
- Western Corn Rootworm Beetles Emerging
- Black Light Trap Catch Report
- Notched Leaf Edges in Corn
- Soil Sampling for Assessing Plant Available N Following Excessive Rain or Flooding
Western Bean Cutworm Season Begins With a Flurry- (Christian Krupke and John Obermeyer)
• Scouting in northwestern Indiana counties for egg masses/young larvae should begin when moth captures are frequent.
• Fields just beginning to tassel are most attractive for moth egg laying.
Pheromone trap cooperators started monitoring for moths sooner this year, good thing. Brad Rocke, southern LaPorte County caught a moth after putting out his trap on Thursday, June 17. This is ten days earlier than previous years’ captures. Since then, multiple moths have been captured by other cooperators in the northwestern counties. Brad’s trap has already accumulated over 150 moths to date. Wow, this is an impressive start. To boot, a western bean cutworm egg mass was found by Travis Brandenburg, Ceres Solutions, on a corn leaf in northern Jasper County. Reminding us that larvae are soon to follow!
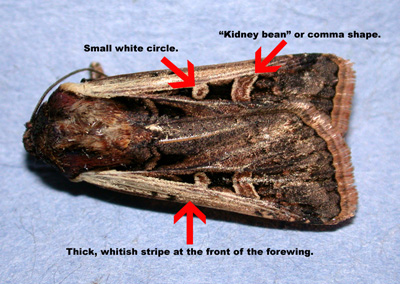
Key identification characteristics of the western bean cutworm moth
Scouting for western bean cutworm is likely only needed where moth numbers are high and damage was observed last year. From our limited experience with this pest, those are areas of sandy soils and continuous corn. Scouting should begin once moths are being captured with regular frequency. In five different areas of a field, inspect 20 consecutive plants for egg masses which are laid on the upper surface of the top leaves of corn and/or larvae that may have hatched and crawled to the whorl and begun to feed. Moths are most attracted to cornfields that are soon, or just beginning, to pollinate. Should a field have uneven growth, concentrate scouting efforts on corn closest to pollination. If pre-tassel corn is not available, moths will lay eggs on whorl stage corn. Damage from larvae, as they feed deep in the whorl (attacking the tassel), will resemble corn borer or fall armyworm damage. Initially the damage will be subtle, as the larvae grow so will their mouthparts and appetite.
A treatment threshold of 5% (lowered from 8% in the past) of the plants with an egg mass and/or larvae in the whorl of yellow-dent corn is suggested. Timeliness is critical, because as soon as pollination begins, larvae will make their way into the ear via the silks and become difficult to control. Because Cry1F (Bt protein found in Herculex 1 and Smartstax) has shown to be very effective in suppressing this pest, scouting should not be necessary. But don’t forget the refuge corn, obviously it is not protected. Extension Publication E-219-W, Corn Insect Control Recommendations - 2010, can be viewed at <http://extension.entm.purdue.edu/publications/E-219.pdf>.
This is just the beginning, in the weeks to follow, we will post updates and pheromone trap counts in future issues of the Pest&Crop.
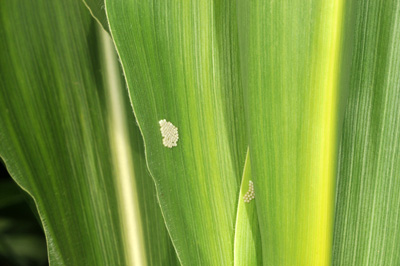
Freshly laid (whitish) egg mass on whorl leaves
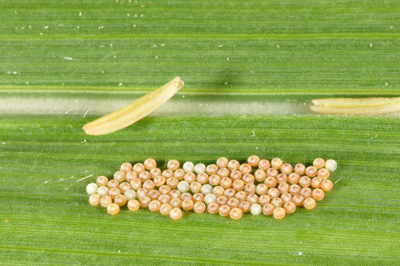
Developing western bean cutworm eggs
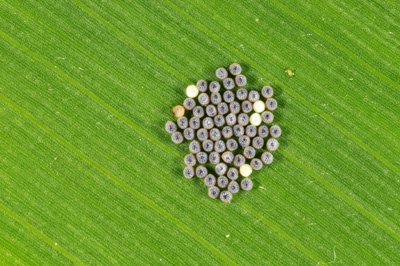
Eggs soon to hatch
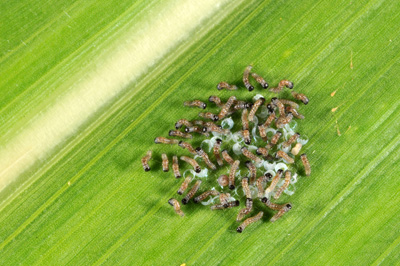
Hatching larvae eat the egg shells, leaving no trace behind
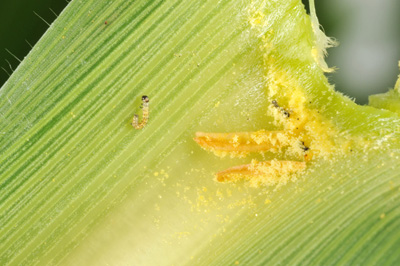
Just hatched larva in leaf axil of pollinating plant
![]()
Western Corn Rootworm Beetles Emerging - (Christian Krupke, John Obermeyer, and Larry Bledsoe)
• Beetles should not be a concern until fields are pollinating.
• Late planted/replanted fields could be a “trap crop” for beetles and egg laying.
Western corn rootworm beetles are beginning their annual emergence from the soil in Indiana. The male beetles are generally first to emerge and feed for several days until females begin emerging a few days later. Females mate, then feed and disperse, sometimes over long distances.
After emerging, beetles will begin to feed on corn leaves if pollen is not available. Leaf feeding damage is of no economic importance. However, pollinating plants with high beetle populations could suffer economic losses from the beetles clipping silks prior to the completion of pollination. Pest managers should closely watch their fields for this type of feeding activity when pollination begins.
Adult beetles survive for several weeks and are consistently attracted to pollen sources throughout their lifespan. Therefore, late-planted fields are particularly susceptible to silk-clipping. Fields with uneven growth and/or replanting may be more vulnerable than most. These delayed areas should be closely watched for silk clipping. For additional information on rootworm beetles and their control, see Extension Publication E-219-W, Corn Insect Control Recommendations - 2010, which can be viewed at <http://extension.entm.purdue.edu/publications/E-219.pdf>.
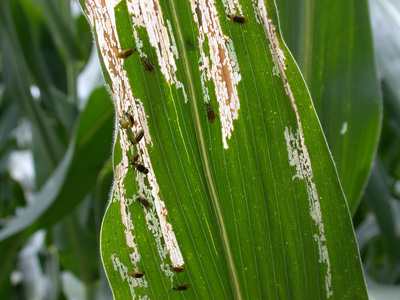
Rootworm beetles feeding on corn leaf
![]()
Click here to view the Black Light Trap Catch Report
Big Corn and Big Weeds – (Bill Johnson and Glenn Nice)
We have been flooded with calls on how to control big weeds in big corn. The recent wet spell has kept sprayers out of the field and many farmers have reduced their reliance on preemergence residual herbicides in corn production in favor of reliance on glyphosate postemergence. This year is a perfect example of why we should not rely totally on postemergence weed management strategies in corn. We have likely given up thousands of bushels of yield potential across the state because we were not able to protect crop yields from weed competition. Anyway, most of you know our stance on the value of residual herbicides and you probably expected this sermon.
What can you do? About a month ago we posted an article that showed the crop growth stage restrictions for postemergence herbicides in corn. Here is another chance to look at this table and see what your options are. Also, keep in mind the weed control efficacy table so you know what herbicides control specific weeds. Also, be realistic and if you have weeds over 1 foot tall, do not expect complete control. All you can really hope for is suppression and lessening the impact on final yield.
| Herbicide | Maximum Crop Size |
|---|---|
| 2,4-D Amine | Broadcast up to 8-inch corn; directed spray before tassel stage. |
| 2,4-D Ester | Broadcast up to 8-inch corn; directed spray before tassel stage. |
| Accent Q, NIC-IT | Broadcast up to 6 collars or 20-inch corn; directed spray up to 10 collars or 3-inch field corn. |
| Aim | Apply up to 8-collar corn. |
| Atrazine | Apply before corn is 12 inches tall. |
| Beacon | Broadcast 4 to 20-inch corn; directed spray before tassel emergence. |
| Bromoxynil | Apply before tassel emergence. |
| Bromoxynil+arazine | Apply before corn is 12 inches tall. |
| Cadet | Broadcast or directed from 2 collar stage up to 48 inches tall, and before tassel emergence. |
| Callisto | Apply up to 30-inch or 8-leaf corn. |
| Capreno | Apply broadcast from V1 to V6 corn; directed spray up to V7 corn. |
| Celebrity Plus | Broadcast up to 6 collars or 24-inch corn. |
| dicamba | Do not apply with COC when corn height exceeds 5 inches. Broadcast up to 5th-leaf stage or 8-inch corn’ directed spray up to 36-inch corn. |
| dicamba+atrazine | Do not apply with COC when corn height exceeds 5 inches. Apply broadcast up to 5-leaf stage or 8-inch corn. |
| Halex GT | Broadcast up to the V8 stage or 30” tall, whichever comes first. |
| Hornet | Broadcast up to 20-inch corn or 6 collars; directed spray up to 36-inch corn. |
| Ignite | Broadcast up to 5-collar corn. |
| Impact | Apply broadcast or directed up to 45 days before harvest. |
| Laddok | Apply before corn is 12 inches tall. |
| Laudis | Broadcast up to V8 corn. |
| Laudis-atrazine | Broadcast up to 12-inch corn. |
| Lightning | Broadcast up to V6 or 20-inch corn; directed spray up to 45 days before harvest. |
| Northstar | SURF, COC or MSO up to 12-inch corn. Only SURF between 12 and 36-inch corn. Broadcast 4 to 20-inch corn; directed spray up to 36-inch corn. |
| Option | Apply broadcast in the V1 to V6 stage; directed spray up to 36-inch corn. |
| Permit/Sandea Halomax | Apply through layby stage of corn. |
| Resolve | Broadcast up to 12-inch or 6 collar corn. |
| Resolve Q | Broadcast up to 20l-inch or 6 collar corn. |
| Shotgun | Apply before 12-inch corn. |
| Spirit | Broadcast 4 to 20-inch corn; directed spray up to 24-inch corn or after 7 collar corn. |
| Starane | Broadcast up to the V5 stage; directed spray after the V5 stage. |
| Status | Broadcast from 4 to 36-inch corn (rates up to 5 oz/A). |
| Steadfast Q | Broadcast up to and including 6 collars or 20-inch corn. |
| Stinger | Up to 24-inch corn. |
| WideMatch | Broadcast up to the V5 stage; directed spray after the V5 stage. |
| Yukon | Apply broadcast or directed up to 36-inch corn. |
Click here for Table 2. Weed Response to Postemergence Herbicides in Corn (PDF).
Conditions Favorable for Gray Leaf Spot in Corn – (Kiersten Wise)
The recent warm, humid, and wet weather has many people wondering if gray leaf spot will be severe this year in Indiana. We are just now starting to see early lesions of gray leaf spot on some susceptible hybrids and we recommend scouting fields to determine the level of disease present. The fungus that causes gray leaf spot, Cercospora zeae-maydis, infects the corn plant during prolonged warm (75°F to 85°F), humid (more than 90 percent relative humidity) periods. Symptoms are commonly observed following long periods of heavy dew and overcast days.
Early gray leaf spot symptoms are observed on leaves as small, pinpoint lesions surrounded by yellow halos. At this stage, it can be hard to correctly identify the disease, but as lesions mature, they elongate into narrow, rectangular, brown to gray spots (Figure 1). Lesions on susceptible hybrids expand parallel to leaf veins and may become 1.5 to 2 inches long.
Cercospora zeae-maydis spores can cease development during low humidity periods, and then resume the infection process once humidity rises. Each lesion can produce many spores, which are splashed or blown to the upper leaves or to other plants where they can survive until conditions are favorable for infection. This cycle makes it appear that the disease is moving up the plant.
Due to the length of the infection process, symptoms may not be noticeable for up to two weeks after infection, depending on weather conditions and hybrid susceptibility. Hot, dry weather will restrict disease development and spread.
Yield loss may depend on the number of lesions and how far up in the canopy they occur as the plant enters tasseling and pollination. If lesions have reached the ear leaf or higher during the two weeks before and after tasseling, yield loss could occur. If lesions develop on upper leaves later in the season, the economic impact will be less.
Preventative management strategies can reduce economic losses due to gray leaf spot. In-season disease management options, such as fungicides, are also available. Susceptible hybrids planted in no-till or reduced-till fields are at high risk for gray leaf spot development, but weather is the primary influence on disease development.
It is important to remember that a fungicide application is an additional cost to corn production, and growers must consider economic factors (corn market price, and fungicide application cost) and other disease factors before deciding whether to apply a fungicide for gray leaf spot management.
Research in Indiana indicates that strobilurin and strobilurin/triazole premix fungicides are most effective at preventing yield loss when applied in response to disease presence, and at the tasseling to early silking (VT-R1) growth stage. Scouting fields around V14, or just prior to tassel emergence, can help determine the level of disease pressure in a field.
Iowa State University developed guidelines to determine when a fungicide may be necessary to prevent yield loss. These thresholds and incorporate hybrid susceptibility ratings and disease levels prior to tasseling:
1. Consider a fungicide application if:
The hybrid is rated as susceptible or moderately susceptible AND 50 percent of the plants in a field have disease lesions present on the third leaf below the ear leaf or higher prior to tasseling
2. Consider a fungicide application if:
The hybrid is rated as moderately resistant AND 50 percent of the plants in a field have disease lesions present on the third leaf below the ear leaf or higher prior to tasseling AND additional factors or conditions that favor disease development are present (residue present, favorable weather conditions)
Scout even resistant hybrids for disease problems, but, in general, fungicide applications to these hybrids are not recommended and will not consistently result in increased yield.
The thresholds available for fungicide application decisions are not hard and fast rules. It is important to remember that gray leaf spot severity can be unpredictable in Indiana, even when factors favoring disease are present. Therefore, consider threshold guidelines, cropping practices, planting date, predicted weather conditions, and economic factors when deciding whether to use a fungicide to manage gray leaf spot.
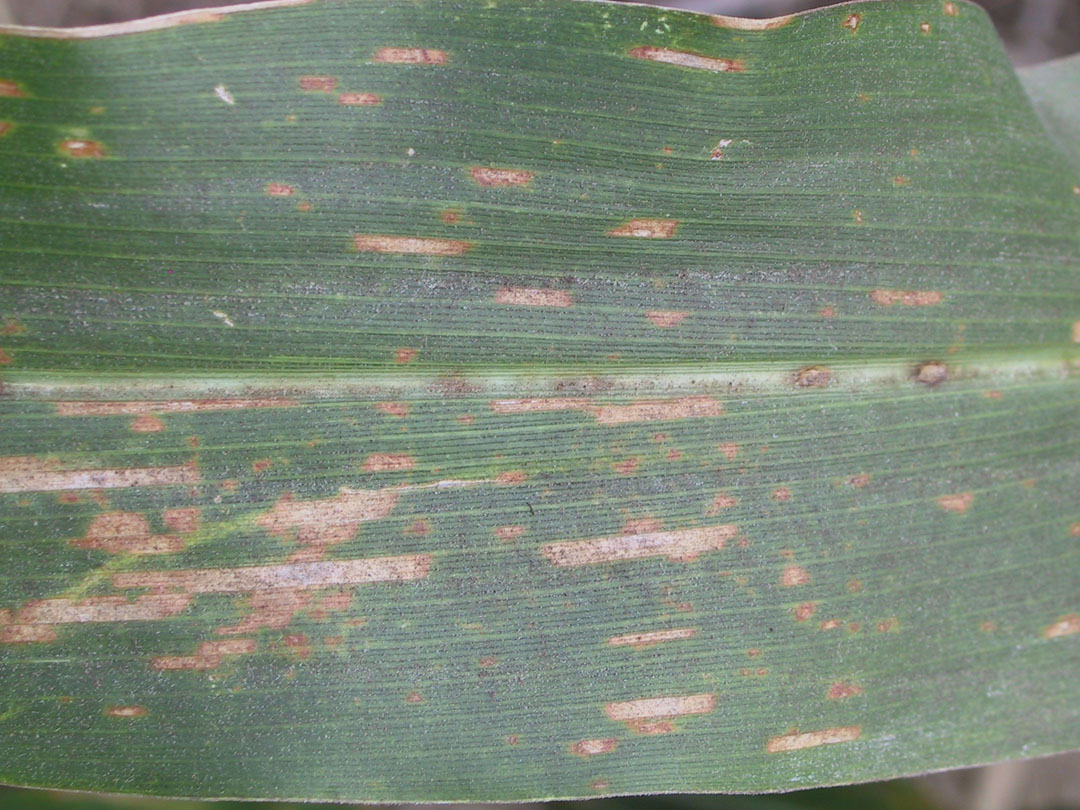
Figure 1. Gray leaf spot lesions on a corn leaf
Notched Leaf Edges in Corn - (Bob Nielsen)
The “notched leaf edge” symptom in corn is a curious genetic leaf “disorder” that appears in certain hybrid families during periods of rapid development. Affected leaves exhibit a ragged or notched edge that looks a little like somebody did a poor job at attempting to cut paper dolls out of the leaves. One descriptive comment from an Internet post suggests that the symptom “looks like some kids found an old set of ear notchers left over from the “Hog” days.”
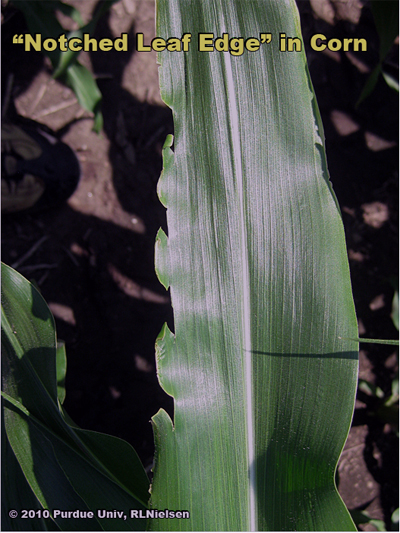
Notched leaf edge symptom in V9 corn
Sometimes the notching occurs only on one leaf edge with the other normal, other times the notching occurs on both leaf edges. Typically, only a few of the leaves are affected. The symptom seems to be most commonly reported on corn that is well into its rapid growth phase (sometime after leaf stage V7).
While it is tempting to blame this symptom on the feeding activities of certain insects (e.g., armyworm, stinkbug, corn borer), the symptomology is different. Some have also blamed nutrient deficiencies (e.g., calcium) for the symptom.
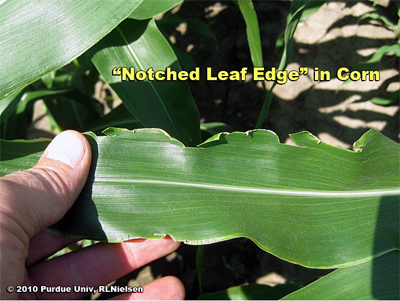
Notched leaf edge symptom in V9 corn
Feedback from some of my seed industry colleagues indicates that the ragged leaf edge symptom is a genetic characteristic that seems to express itself during periods of rapid crop development. The thought is that, for some unknown reason, the edges of one or more leaves deep down in the whorls of plants become “sticky” and so the leaves cannot unwrap normally during their continued expansion from the whorl. The leaf edges become damaged as the leaves continue to unwrap; thus leading to the ragged or notched leaf edge symptom when fully emerged from the whorl. The “sticky” leaf theory behind the “notched leaf edge” symptom may be similar to that proposed for the “twisted whorl” symptom <http://www.agry.purdue.edu/ext/corn/news/timeless/TwistedWhorls.html>.
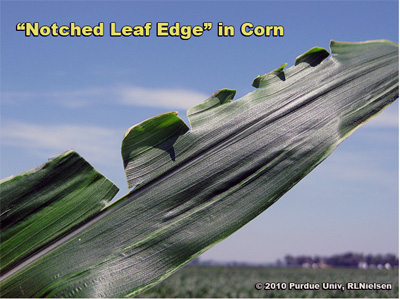
Notched leaf edge symptom in V9 corn
This symptom appears to be a simple genetic oddity with little consequence to further development of the crop canopy. The percent loss in photosynthetic leaf represented by these ragged leaf edges is minor and likely has no effect on ultimate grain yield of the plants.
Related Reading
Nielsen, RL (Bob). 2010. Wrapped and Twisted Whorls in Corn. Corny News Network, Purdue Univ. (online) <http://www.kingcorn.org/news/timeless/TwistedWhorls.html> (URL accessed June 2010).
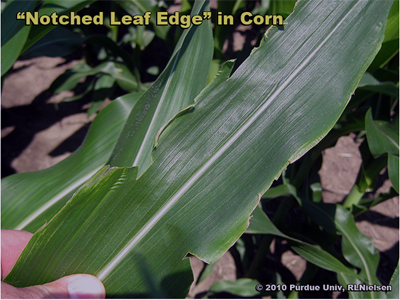
Notched leaf edge symptom in V9 corn
![]()
Soil Sampling for Assessing Plant Available N Following Excessive Rain or Flooding - (Jim Camberato and Bob Nielsen)
Excessive rainfall and flooding that occurs after nitrogen fertilizers have been applied to corn often leads growers to worry about whether additional N fertilizer may be required to account for N loss due to denitrification or leaching. We’ve been thinking about methods for estimating the amount of soil nitrogen remaining in these fields if they were fertilized prior to the rains and floods. The accuracy of what we propose in this article is not well-documented, but we believe the method will nevertheless be useful in helping growers assess the potential for N loss in affected fields.
Soil sample fields where N loss was likely
The three major forms of nitrogen (N) found in common N fertilizers are ammonium, urea, and nitrate. The ammonium and urea forms of N must convert to nitrate before substantial N loss can occur. Where urea or 28% UAN was applied more than 2 weeks before or where anhydrous ammonia was applied more than 4 weeks before the onset of the heavy rains, most of the fertilizer N is likely already in the susceptible nitrate form. Less fertilizer N may have converted to nitrate where urea or 28% UAN was applied 1 to 2 weeks before or where anhydrous ammonia was applied 3 to 4 weeks prior to the heavy rains.
If most of the fertilizer N was in the nitrate form, then ponding, flooding, or soil saturation for three days or more likely results in significant N loss in silt loam and heavier soils. In sandy soils, rainfall amounts greater than 4 inches that infiltrate the soil (versus running off) likely causes significant leaching of soil nitrate below the root zone. Fields where these conditions occurred are candidates for soil N sampling.
Soil sampling strategies
Sample field areas where N loss is suspected separately from those areas where N loss is suspected to be minimal. Sampling both areas will allow you to compare soil N in the two areas and may help you determine if N loss or flooding stress is the cause of yellow stunted corn.
Collect soil cores for soil nitrate analyses to a depth of at least 1 foot. Where earlier-applied fertilizer N was broadcast rather than banded, collect 20 to 30 soil cores per sample. Where earlier-applied fertilizer N was banded (e.g., anhydrous ammonia), collect 15 to 20 soil cores using the sampling scheme illustrated in the Figure 1. Consider collecting a separate deeper soil sample from between 1- and 2-foot deep for a more complete assessment of plant available N, especially in sandy soils where leaching through the soil profile is the predominant form of N loss.
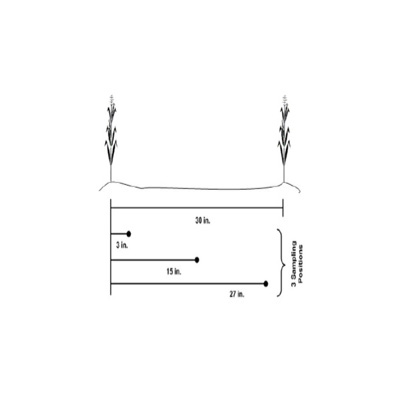
Figure 1. Recommended soil sampling pattern in relation to two corn rows when N fertilizer has been banded with the row. Always sanple perpendicular to the direction fertilizer was applied (Photo Courtesy: Brouder & Mengel, 2003).
Sample handling
Dry or refrigerate your soil samples as soon as possible to stop the soil microbes from altering N levels. Spread the soil thinly on plastic to air dry and hasten drying with a fan if possible. Otherwise refrigerate the samples and keep them cold through shipping to the lab. A list of certified soil testing laboratories is available at <http://www.ag.purdue.edu/agry/extension/Pages/soil-testing-labs.aspx>. Most should offer soil N test analysis services, but contact them first to confirm.
Soil-test laboratory analyses
Ammonium is just as available to plants as is nitrate, but typically little accumulates in the soil because it is readily converted to nitrate under most conditions. However, if fertilizer was recently applied, there may well yet be some ammonium N available in the soil for plant use.
When you submit the soil samples to the soil-testing laboratory, request analyses for exchangeable ammonium as well as for nitrate, particularly if anhydrous ammonia was applied relatively recently or a nitrification inhibitor was used with the N fertilizer. Significant levels of soil ammonium are most likely if anhydrous ammonia was the N source, a nitrification inhibitor such as N-Serve™ or DCD was used, and/or soil pH was low (around 5.0). In these situations, low soil test levels of soil nitrate may indicate little conversion of ammonium to nitrate, rather than simply loss of nitrate.
If soil test values for ammonium and nitrate are reported as ppm or mg/L nitrogen (NH4-N or NO3-N), then pounds per acre of available N are calculated by multiplying the test results by 4 when the sample depth was 1 foot. For other sample depths, divide the sample depth (in inches) by 3 and then multiply by the test results.
Example: Soil NO3-N in a 1-foot sample was 30 ppm
Conversion from ppm to pounds per acre is (12 inches / 3) x 30 ppm = 120 pounds per acre.
If soil test values are reported directly as NH4 or NO3, then these values must be converted to an ‘N’ basis first. The calculations are: NH4-N = NH4/1.2 and NO3-N = NO3/4.5.
Example: Soil NO3 was reported to be 90 ppm
Conversion from NO3 to NO3-N is 90 ppm NO3 / 4.5 = 20 ppm NO3-N.
Interpreting soil nitrate and ammonium levels
In our opinion, soil nitrate and ammonium levels can be used to guide additional N applications to fields subjected to saturation and flooding. However, there are admittedly no hard and fast research-based recommendations for this particular situation.
The primary tool for soil N sampling in the Eastern Corn Belt has been the pre-sidedress soil nitrate test (PSNT) which is most applicable as an indicator of N availability in soils where manure had been applied or a legume such as clover or alfalfa had been plowed down (Brouder & Mengel, 2003). For these field situations, the level of soil nitrate found is considered an index of N availability, i.e., an indicator of how much N is currently available AND how much N may become available from the manure or organic matter. When used in this context, soil NO3-N levels greater than 25 ppm are thought to be adequate for optimum corn yield without the addition of more fertilizer N. During the research that developed this soil test, sampling deeper than 1 foot or analyzing for exchangeable ammonium did not increase the predictive ability of the PSNT enough to warrant the extra effort.
However, when the intent is to assess the loss of N due to rainfall, we suggest that deeper sampling plus analysis for ammonium content can provide useful information to help growers decide whether additional fertilizer N is merited. It is important to recognize that in this context, measurements of soil nitrate and ammonium following fertilizer N applications indicate current N availability only, because there is no manure- or legume-derived N to be released later in the season. Considering this fact, the commonly accepted 25 ppm NO3-N critical level for manure- or legume-N fertilized soils may be too low for soils that have only received fertilizer N.
Leaching of soil nitrate is expected with ponding, flooding, or soil saturation, but not all of the nitrate will be moved below the root zone. A shortcoming of the 1-foot sampling depth is that it does not always reflect plant available N deeper in the profile, particularly when abnormal leaching occurs. This is why we suggest also sampling from the 1- to 2-foot depth for assessment of soil N availability in sandy soils.
In our on-going N rate trials conducted throughout the state, the “normal” background levels of soil N in the upper 1 foot of mineral soils typically range from 5 to 10 ppm NO3-N and 4 to 8 ppm NH4-N for corn grown in rotation with soybean or corn without manure- or legume-derived N. Typically the deeper 1- to 2-foot soil samples would have slightly lower N levels.
Making a decision
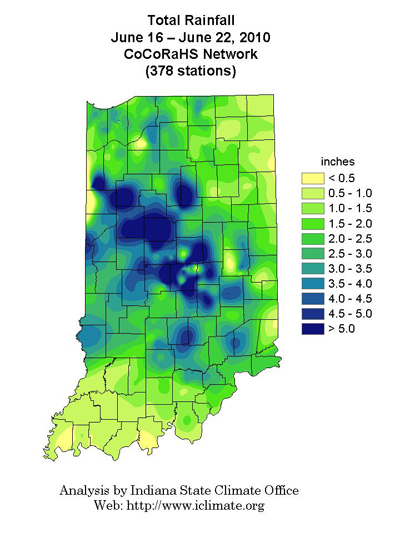
Many soil fertility specialists in the Midwest suggest adhering to the usual critical level of 25 ppm NO3-N for determining when no additional N is needed after the recent heavy rains. We suggest that this level of soil NO3-N may be insufficient where N loss conditions have been severe. Areas of Indiana had as much as 14 inches of rainfall in a two-week period that certainly resulted in high probabilities of substantial N loss. We suggest this level of rain has depleted the lower soil profile as well as the upper foot of soil.
The accompanying table contains estimates of expected soil NO3-N levels with different fertilizer rates assuming “normal” background levels of nitrate and ammonium at the time of fertilization and a “normal” amount of movement below the one foot sampling depth (approximately 1/3 of the fertilizer N is moved below the 1-foot sampling depth but retained within the root zone with normal rainfall). If the corn is healthy and the growing season typical from here on out, we would suggest applying no more than 10 pounds of N for every 2 ppm reduction in soil sample N below the expected levels listed in the table.
Recognize that as a healthy crop moves through the rapid growth phase prior to pollination, soil N levels will naturally decrease in response to rapid N uptake by the plants. However, by the time a healthy crop reaches the V9 leaf stage (about 30 inches tall), only 19 lbs/ac N (equivalent to 5 ppm soil NO3-N) have typically been taken up the plants (Mengel, 1995). However, by the time a healthy crop reaches shoulder-high (~ V15 or 60 inches tall), approximately 116 lbs/ac N (equivalent to 29 ppm soil NO3-N) have been taken up by the plants.
The following examples give you an idea of how the tabular information may be used to make this decision.
Example calculation when only NO3-N is determined:
Fertilizer N was applied at 160 pounds of N per acre in April as 28% UAN in southern Indiana. Only soil NO3-N analysis was requested because it was assumed that most of the urea- and ammonium-N had been converted to nitrate since temperatures were warm for many weeks prior to the late May/early June rain. The expected NO3-N level from the table below for a 160-lb N application is 35 ppm. Laboratory results indicated only 20 ppm NO3-N. The suggested N application rate would be: ((35 ppm – 20 ppm) / 2) x 10 = (15 ppm / 2) x 10 = 7.5 x 10 = 75 pounds per acre.
Example calculation when both NO3-N and NH4-N are determined:
Anhydrous ammonia was applied at 160 pounds of N per acre in mid May in northern Indiana. Since temperatures were warm for only 2 weeks prior to the late May/early June rain, both NO3-N and NH4-N analysis of soil samples were requested. The expected NO3-N plus NH4-N levels listed in the table for a 160-lb N application is 41 ppm. Laboratory results indicated 15 ppm NO3-N and 20 ppm NH4-N for a total measured N level of 35 ppm. The suggested N application rate would be: ((41 ppm – 35 ppm) / 2) x 10 = (6 ppm / 2) x 10 = 3 x 10 = 30 pounds per acre.
| Fertilizer N Applied Prior to Rains | Nitrogen Analysis Expected N Levels, ppm or mg/L N |
|
|---|---|---|
| NO3-N | NO3-N+NH4-N | |
| lb/acre | * | ** |
| 130 | 30 | 36 |
| 140 | 31 | 37 |
| 150 | 33 | 39 |
| 160 | 35 | 41 |
| 160 | 36 | 42 |
| 180 | 38 | 44 |
| 190 | 40 | 46 |
| 200 | 41 | 47 |
| 210 | 43 | 49 |
| 220 | 45 | 51 |
| NO3-N = Nitrate nitrogen NH4-N = Ammonium nitrogen * Assumes background level of ammonium at 6 ppm and “normal” levels of soil N below the 1-foot sampling depth. ** Assumes “normal” levels of soil N below the 1-foot sampling depth. |
||
Response to late-season nitrogen applications
Less than normal rainfall during the remaining part of the growing season following late N fertilizer application can limit yield response to the added N because of limited movement of the applied N in the soil solution and limited root function in the dry upper soil layers, so consider this risk when determining whether applying supplemental N will be useful. Similarly, growers need to assess the overall vigor of a stand of corn that survived earlier ponding or flooding events. Remember that the stunting and discoloration of corn following such events is not entirely due to a loss of soil nitrogen. Root damage that occurred as a result of the anaerobic (saturated) soil conditions contributes greatly to the initial onset of yellowing and stunting.
The greater the delay in N application beyond the initiation of the rapid growth phase of corn (beyond about leaf stage V8), the lower the yield benefit of additional N. However, a healthy corn crop can respond economically to N applied very late in the season even though maximum potential yield may not be attained.
Scharf et. al., (2002) reported from N rate trials with healthy corn that “little or no evidence of irreversible yield loss when N applications were delayed as late as stage V11, even when N stress was highly visible. There was weak evidence of minor yield loss (about 3%) when N applications were delayed until stage V12 to V16.”
Shoulder high, V12 or earlier corn can respond to quite a bit of N, more than 60 lb N/acre up to maybe 100 lb N/acre. Earlier corn, V6 to V8, is still at a growth stage where sidedressing would normally occur and can respond to a full rate. Corn can easily accumulate 5 to10 lb N/acre/day during the grand growth phase if it is healthy. So over a two week period, N accumulation could be 140 lb N/acre.
In a study conducted in 2007 by one of our graduate students (Dan Emmert) at the Pinney Purdue Agricultural Center in northwest Indiana, 35 pounds of N per acre applied at V13 increased yield 18 bu/ac in plots where only starter N (25 lbs N/ac) was applied (a low N supply situation similar to what growers may face with severe N loss). Application of 70 pounds of N per acre at V13 increased yield an additional 17 bushels per acre. Higher N rates did not increase yield any further.
At two other locations in the Lafayette area, 35 pounds of N per acre applied at V14 or V16 increased yield 18 bushels per acre when only starter was applied. However, 70 lbs/ac did not increase yield any further likely because those locations received extremely limited rainfall following the late N application.
Nitrogen fertilizers for tall corn
The preferred method of application for sidedressing tall corn would be to dribble 28% UAN in a band between the rows with a high-clearance applicator equipped with drop tubes. Nitrogen loss by ammonia volatilization to the air should be less than 5% with a closed canopy and the dribbled application. Any N that gets on the plant will burn the tissue, so be certain to minimize that risk by taking steps to minimize movement of the drop tubes. Do not spray 28% UAN over the top, the level of tissue burn will be unacceptable.
Broadcast granular urea has a greater potential for loss than 28% UAN and some tissue burn will be inevitable. Consider including a urease inhibitor with the urea to minimize ammonia volatilization losses.
Acknowledgements
Our colleague Brad Joern assisted in the preparation of this article.
Related References
Blackmer, A.M., D. Pottker, M.E. Cerrato, and J. Webb. 1989. Correlations between soil nitrate concentrations in late spring and corn yields in Iowa. J. Prod. Agric. 2:103-109.
Brouder, Sylvie and David Mengel. 2003. The Presidedress Soil Nitrate Test for Improving N Management in Corn (AY-314-W). Purdue Extension. [On-line]. Available at <http://www.agry.purdue.edu/ext/pubs/AY-314-W.pdf>. [URL accessed June 2010].
Certified Soil Testing Laboratories. 2010. Purdue Agronomy Extension [On-line]. Available at <http://www.ag.purdue.edu/agry/extension/Pages/soil-testing-labs.aspx>. [URL accessed June 2010].
Ferrer, Francesc, J.M. Villar, C.O. Stockle, P. Villar, and M. Aran. 2003. Use of a pre-sidedress soil nitrate test (PSNT) to determine nitrogen fertilizer requirements for irrigated corn. Agronomie 23:561-570.
Mengel, David. 1995. Roots, Growth, and Nutrient Uptake. Purdue Agronomy Extension Paper AGRY-95-08. [On-line]. Available at <http://www.agry.purdue.edu/ext/pubs/AGRY-95-08.pdf>. [URL accessed June 2010].
Scharf, Peter, William Wiebold and John Lory. 2002. Corn Yield Response to Nitrogen Fertilizer Timing and Deficiency Level. Agron. J. 94:435-441.
![]()