

Both tar spot and southern corn rust continue to be documented across Indiana (Figures 1 and 2). I suggest if you have not gotten out and looked for these diseases now is the time. Even if your corn is approaching black layer it will be important to document tar spot in your fields for the future disease management decisions.
There are currently 31 counties with a positive confirmation of tar spot and five probable (Figure 1). Twenty-one counties with southern rust and three probable (Figure 2). As we are learning this season when we have favorable environmental conditions there can be severe pockets of tar spot even in areas that have not seen the significant yield impacts previously. In the map all gray counties indicate that tar spot was found in the county in previous seasons.
I have been getting many questions on if a late season fungicide or 2nd fungicide application should be applied.
Here are my thoughts on what to consider to make that decision.
- What growth stage is the corn? If at dough or beyond I would not make an application
- What has been the history of tar spot in your field? How much disease do you see currently?
- When was a fungicide applied? If more than 3 weeks then the effective period for many of our fungicides has run out.
- Has the environment be favorable for tar spot development – there’s an app you can use to check your field risk – Tarspotter
- If you do decide to make a fungicide application at this point in the season, leave check strips to determine if the fungicide gave you a return on your investment.
We are still documenting tar spot and southern rust as it is important to understand the disease distribution and severity across Indiana. It is extremely important to know if this disease is present in your fields for future risk assessments and to implement disease management tools if necessary. If you observe tar spot in a county that has not reported this season, then please send a sample to the Purdue Plant Pest Diagnostic Lab (PPDL) https://ag.purdue.edu/btny/ppdl/Pages/Submit-A-Sample.aspx or email me dtelenko@purdue.edu
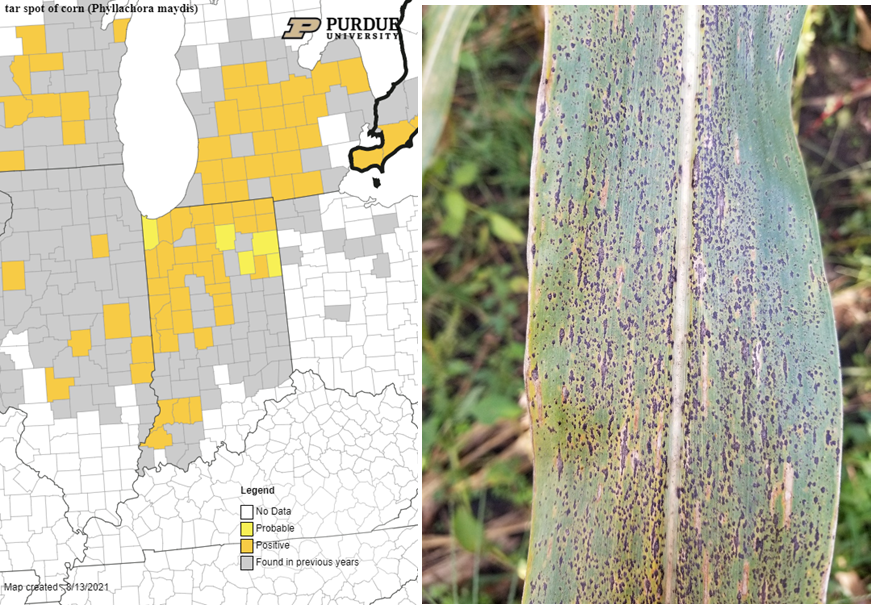
Figure 1. August 13, 2021 map of tar spot and image of a severely infected leaf.
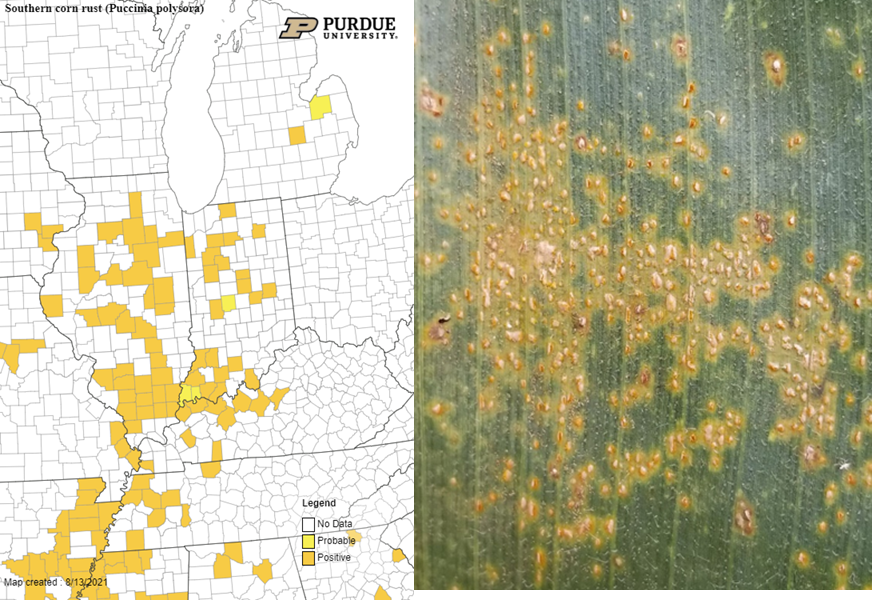
Figure 2. August 13, 2021 map of southern rust.
