

Seeps most often occur where a permeable soil layer is found above a restrictive or less permeable layer (Fig. 1a). While there are several types of restrictive layers (Table 1), all restrictive layers impede or slow the movement of water. When water infiltrates into the soil after rainfall or irrigation, the water moves rapidly downward through the permeable layer until it reaches the restrictive layer (Fig. 1b). Due to the low permeability of the restrictive layer, only a small amount of water can enter the restrictive layer. The water that does not enter the restrictive layer is then forced to flow laterally along the boundary between the restrictive layer and the permeable layer (Fig. 1c). The lateral flow of water can cause the soil to become saturated (Fig. 1d).
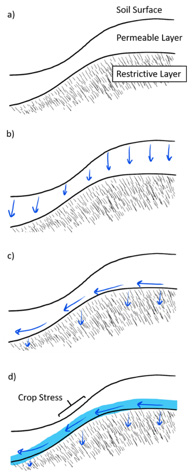
Figure 1. A cross section of a hillslope showing seep hydrology (Fig. 1a). During rainfall, water (blue arrows) moves vertically through the permeable layer (Fig. 1b). Only a small amount of water enters the restrictive layer and must flow laterally (Fig. 1c). With sufficient water movement, a saturated zone (blue shaded region) can form above the restrictive layer (Fig. 1d) and lead to crop stress.
| Table 1. Examples of common restrictive layers found in Indiana. | ||
| Restrictive Layer | Origin | Location |
| Dense till | Dense glacial deposits, often high in clay | Northern Indiana |
| Fragipan | Cemented subsurface layers | Southern Indiana |
| Bedrock | Hard, impermeable rock | Statewide, most common in Southern Indiana |
| Compacted soils | Compaction due to vehicle traffic and/or tillage | Statewide |
On slopes the permeable layer is often thin and the zone of saturated soil is can be found near the soil surface. In extreme cases, where the permeable layer is very thin or there has been recent heavy rainfall, water can be seen “seeping” or flowing from the sides of hillslopes. Even if water is not seen at the soil surface, down-slope water movement at seeps can cause saturation of rooting zone. Saturation in the rooting zone can lead to crop stress like those described in the previous article (“Highlighter Green Soybeans Marking Our Fields”) and Figures 2 through 6.
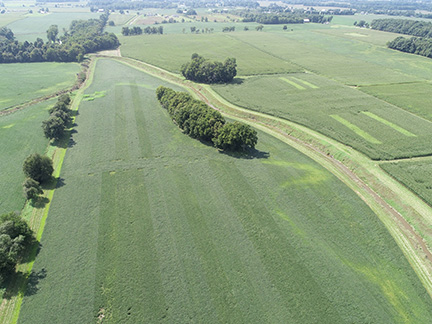
Figure 2. Soybean chlorosis and N deficiency pattern near Columbia City on Aug. 23, 2018.
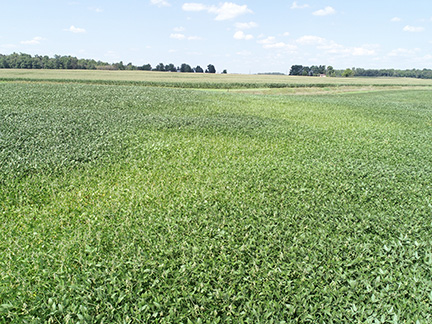
Figure 3. Transition of dark green to highlighter green soybeans on the top of the hill down the slope near Columbia City on Aug. 23, 2018.
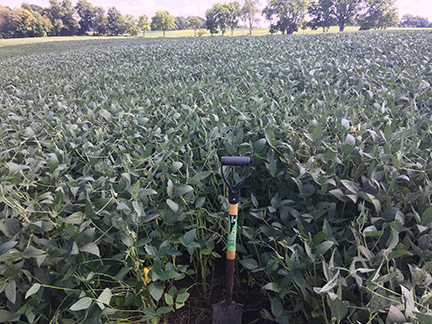
Figure 4. Close-up of healthy dark green soybeans on top of the hill near Columbia City on Aug. 23, 2018.
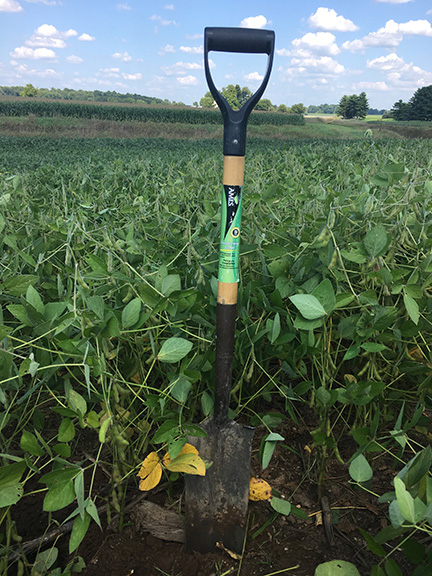
Figure 5. Close-up of highlighter green soybeans on the side slope that are N-deficient due to poor nodulation and N fixation (i.e., saturated conditions). Aug. 23, 2018 near Columbia City.
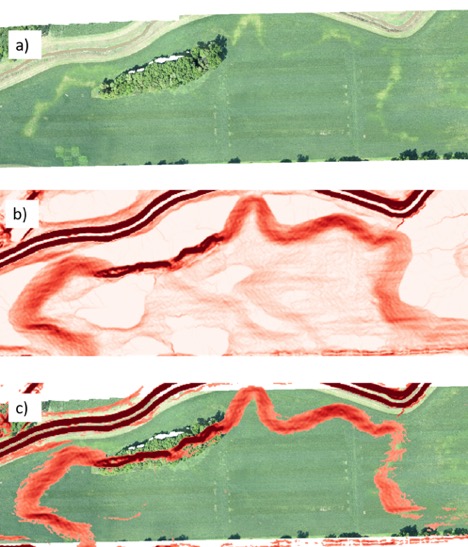
Figure 6. Aerial photo showing chlorosis and N deficiency stress in soybean (Fig. 3a). Slope of the soil surface visualized in red (Fig. 3b) show the likely location of seep hydrology where slope is greatest (i.e. areas of dark red). Areas of high slope (dark red from 6b) overlayered on the soybean aerial image (6a) correlate well with regions of crop stress (Fig. 6c).
