Reference Evapotranspiration Forecasts across Indiana

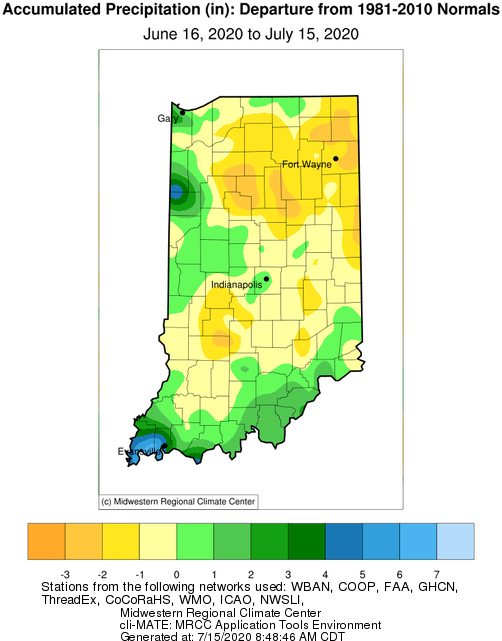
The past 30 days have been met with warmer than normal temperatures in the northern counties and drier than normal conditions throughout most of the state (Figures 1 and 2).  This warm and dry environment is conducive to developing drought – particularly with the increased evapotranspiration rates.  While climate outlooks are calling for increased confidence of above-normal precipitation throughout the rest of July, these events are likely to remain spotty with inconsistent coverage across the state.
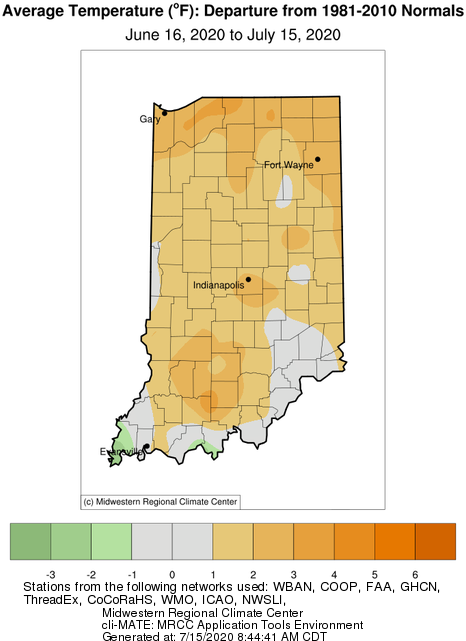
Figure 1. Temperature departures from normal in degrees Fahrenheit for June 16 through July 15, 2020.

Figure 1. Temperature departures from normal in degrees Fahrenheit for June 16 through July 15, 2020.


Figure 2. Precipitation departure from normal in inches for June 16 through July 15, 2020.

Figure 2. Precipitation departure from normal in inches for June 16 through July 15, 2020.

For planning purposes, it may be helpful to know what the forecast is for reference evapotranspiration (ET0). The National Weather Service provides a nice graphical tool (https://digital.weather.gov/) where users can zoom into their area of interest and then view a variety of variables for future time periods out to six days (e.g., Figure 3).  Several derivations of the forecasts of reference evapotranspiration (FRET) can be found at the very bottom of the variable pull-down list, including weekly total FRET, daily FRET, and daily departure from normal FRET.

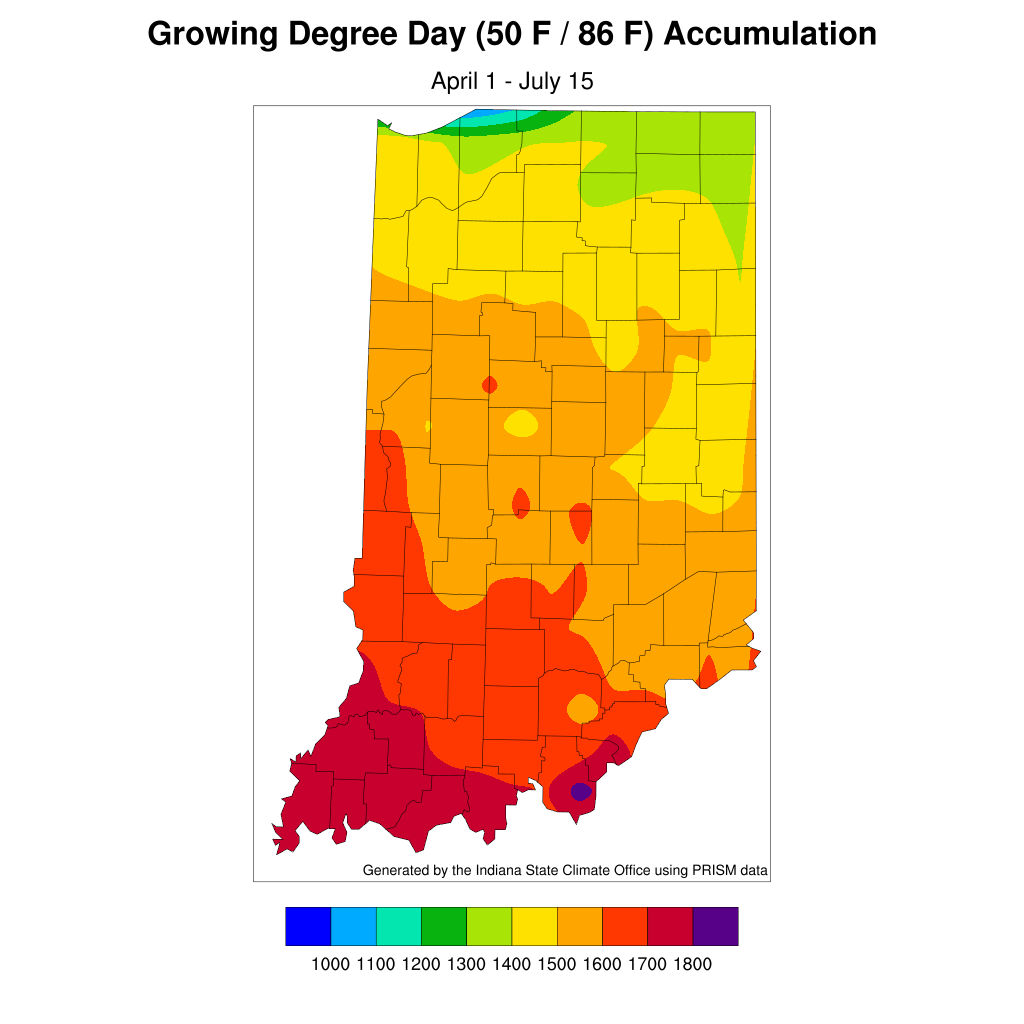
Figure 4. Accumulated modified growing degree days since April 1, 2020.

Figure 4. Accumulated modified growing degree days since April 1, 2020.

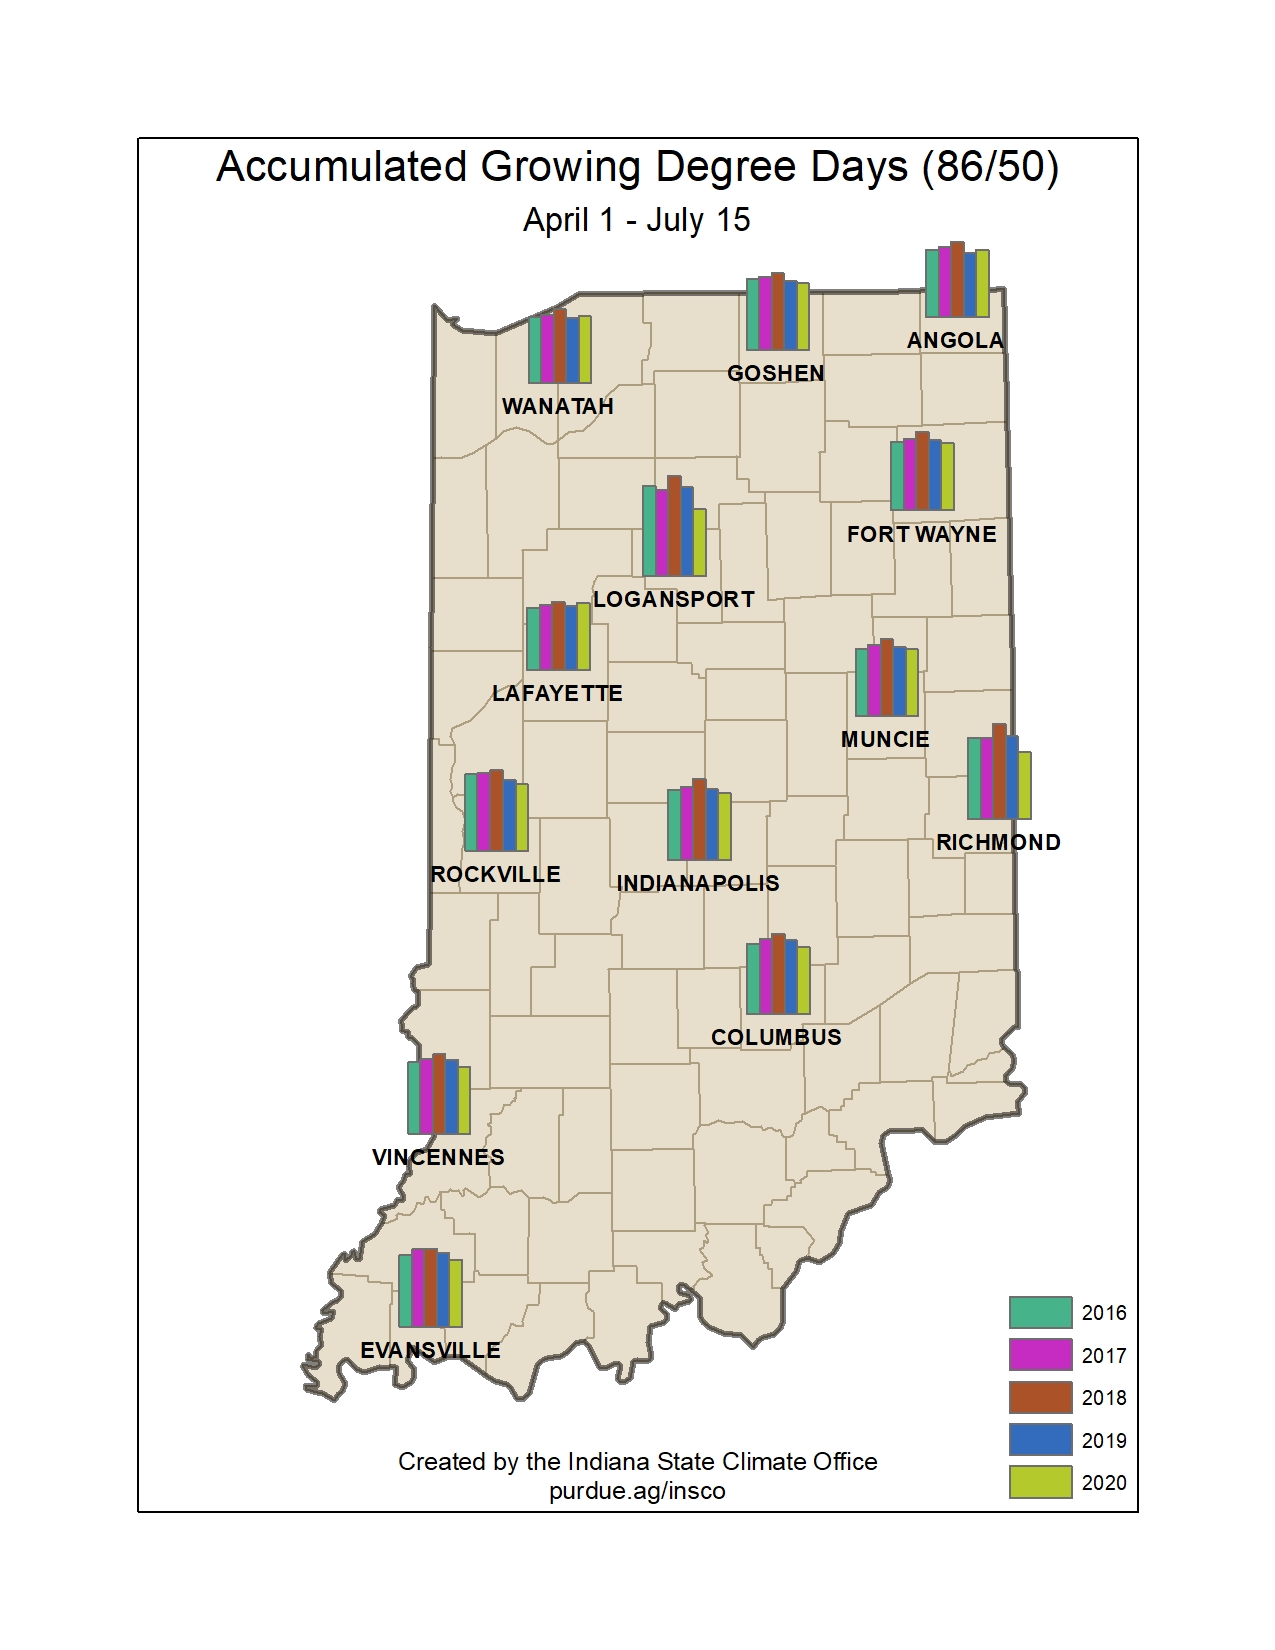
Accumulated modified growing degree days (MGDDs) continue to increase, however extremely warm days may be slowing down progress (Figure 4).  Since MGDDs cap temperatures at 86 degrees Fahrenheit within its computation– to account for the assumption that plant development is limited at higher temperatures – the warm nights and hot days tend to stunt accumulation compared to more traditional growing degree day methods.  Regardless, MGDD accumulations across the state for this year seem to be lagging behind recent years, with the exception of the Lafayette, Tippecanoe County region (Figure 5).

Figure 4. Accumulated modified growing degree days since April 1, 2020.

Figure 4. Accumulated modified growing degree days since April 1, 2020.


Figure 5. Comparison of accumulated modified growing degree days from April 1 through July 15 for 2016 through2020.

Figure 5. Comparison of accumulated modified growing degree days from April 1 through July 15 for 2016 through2020.

Share This Article
It is the policy of the Purdue University that all persons have equal opportunity and access to its educational programs, services, activities, and facilities without regard to race, religion, color, sex, age, national origin or ancestry, marital status, parental status, sexual orientation, disability or status as a veteran. Purdue is an Affirmative Action Institution. This material may be available in alternative formats. 1-888-EXT-INFO Disclaimer: Reference to products in this publication is not intended to be an endorsement to the exclusion of others which may have similar uses. Any person using products listed in this publication assumes full responsibility for their use in accordance with current directions of the manufacturer.
Pest&Crop newsletter - Department of Entomology Purdue University 901 Mitch Daniels Blvd West Lafayette, IN 47907

© 2024 Purdue University | An equal access/equal opportunity university | Copyright Complaints | Maintained by Pest&Crop newsletter

If you have trouble accessing this page because of a disability, please contact Pest&Crop newsletter at luck@purdue.edu.