

Fancy colored yield maps are fine for verifying grain yields at the end of the harvest season, but bragging rights for the highest corn yields are established earlier than that down at the Main Street Cafe, on the corner of 5th and Earl. Some patrons of the cafe begin “eyeballing” their yields as soon as their crops reach “roasting ear” stage. Some of the guys there are pretty good (or just plain lucky) at estimating yields prior to harvest, while the estimates by others are not even close to being within the proverbial ballpark. Interestingly, they all use the same procedure referred to as the Yield Component Method.
Largest ear of corn in Nebraska, ca. 1908. Courtesy of the Nebr. Historical Society.
Yield Component Method
Other pre-harvest yield prediction methods exist (Lauer, 2002; Lee & Herbek, 2005; Thomison, 2015), but the Yield Component Method is probably the most popular because it can be used well ahead of harvest; as early as the so-called “roasting ear” or milk (R3) stage of kernel development. Under “normal” conditions, the kernel milk stage occurs about 18 to 22 days after pollination is complete (Nielsen, 2018b). Estimates made earlier in the kernel development period risk being overly optimistic if subsequent severe stresses cause unforeseen kernel abortion (Nielsen, 2018a).
The Yield Component Method was originally described by the University of Illinois many years ago and is based on the premise that one can estimate grain yield from estimates of the yield components that constitute grain yield. These yield components include number of ears per acre, number of kernel rows per ear, number of kernels per row, and weight per kernel. The first three yield components (ear number, kernel rows, kernels/row) are easily measured in the field.
Final weight per kernel obviously cannot be measured until the grain is mature (kernel black layer) and, technically, at a grain moisture of 15% since that is the typical moisture value used to determine a 56-lb market bushel. Consequently, an average value for kernel weight is used as a proverbial “fudge factor” in the yield estimation equation. As first described many years ago, the equation originally used a “fudge factor” of 90, which represented 90,000 kernels per 56-lb bushel. In terms of how kernel weight is usually measured in research, this would be equal to about 282 grams per 1000 kernels.
Recognize that actual kernel numbers per 56-lb bushel among years or fields within years can vary significantly and are influenced by both growing conditions and hybrid genetics. Kernel weight among hybrids can easily vary from less than 65,000 kernels per 56-lb bushel to more than 100,000 kernels per 56-lb bushel. Kernel weight from year to year for the same hybrid can easily vary by 20,000 kernels per bushel or more simply due to variability in growing conditions during the grain filling period.
Crop uniformity also influences the accuracy of any yield estimation technique. The less uniform the field, the greater the number of samples that should be taken to estimate yield for the field. There is a fine line between fairly sampling disparate areas of the field and sampling randomly within a field so as not to unfairly bias the yield estimates up or down.
1. At each estimation site, measure off a length of a single row equal to 1/1000th acre. For 30-inch (2.5 feet) rows, this equals 17.4 linear feet.
TIP: For other row spacings, divide 43,560 by the row spacing (in feet) and then divide that result by 1000 (e.g., [43,560 / 2.5] / 1000 = 17.4 ft).
2. Count and record the number of ears on the plants in the 1/1000th acre of row that you deem to be harvestable.
TIP: Do not count dropped ears or those on severely lodged plants unless you are confident that the combine header will be able to retrieve them.
3. For every fifth ear in the sample row, record the number of complete kernel rows per ear and average number of kernels per row. Then multiply each ear’s row number by its number of kernels per row to calculate the total number of kernels for each ear.
TIPS: Do not sample nubbins or obviously odd ears, unless they fairly represent the sample area. If row number changes from butt to tip (e.g., pinched ears due to stress), estimate an average row number for the ear. Don’t count the extreme butt or tip kernels, but rather begin and end where you perceive there are complete “rings” of kernels around the cob. Do not count aborted kernels. If kernel numbers per row are uneven among the rows of an ear, estimate an average value for kernel number per row.
4. Calculate the average number of kernels per ear by summing the values for all the sampled ears and dividing by the number of ears.
EXAMPLE: For five sample ears with 480, 500, 450, 600, and 525 kernels per ear, the average number of kernels per ear would equal: (480 + 500 + 450 + 600 + 525) divided by 5 = 511.
5. Estimate the yield for each site by multiplying the ear number (Step 2) by the average number of kernels per ear (Step 4) and then dividing that result by a kernel weight “fudge factor”. Unless your seed company can provide some insight into kernel weight values for their hybrids, I suggest simply performing separate calculations using “fudge factor” kernel weight values equal to 75, 85, and 95. This range of values probably represents that most commonly experienced in the central Corn Belt.
EXAMPLE: Let’s say you counted 30 harvestable ears at the first thousandth-acre sampling site. Let’s also assume that the average number of kernels per ear, based on sampling every 5th ear in the sampling row, was 511. Using “fudge factor” values of 75, 85, and 95; the estimated range in yield for that sampled site would (30 x 511) divided by 75 = 204, or divided by 85 = 180, or divided by 95 = 161 bushels per acre.
Repeat the procedure throughout field as many times as you deem representative. Tally and average the results separately for each “fudge factor” used for the calculations.
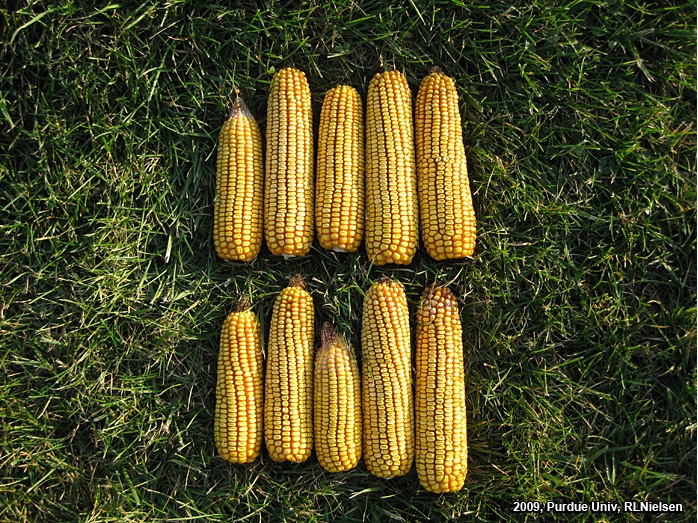
Random sample of ears.
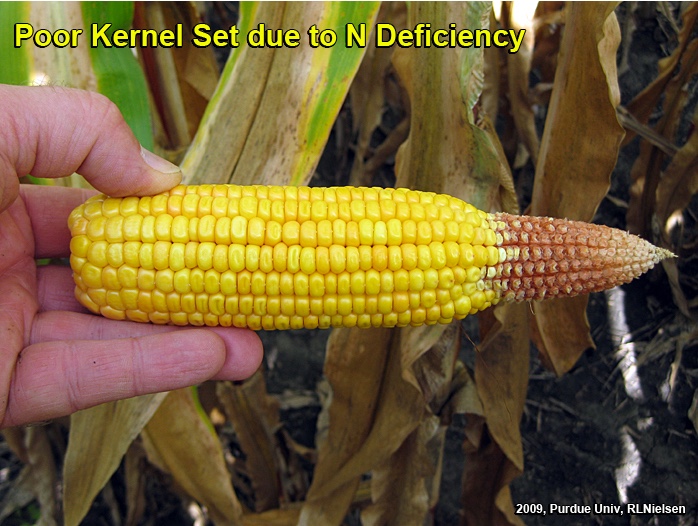
Poor tip fill due to N deficiency.
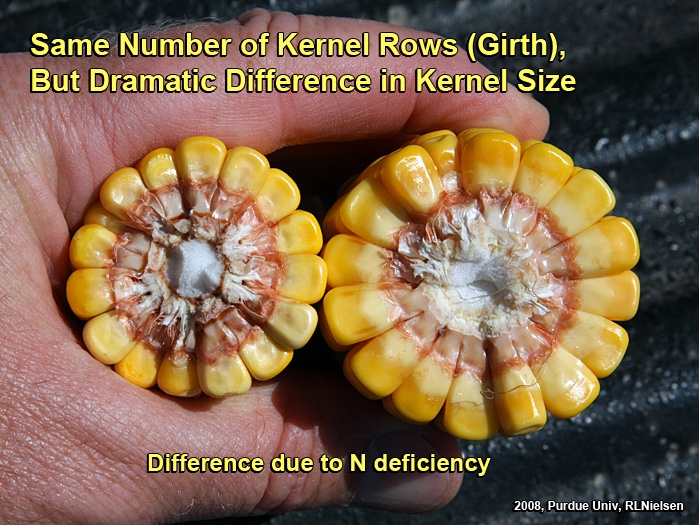
Kernel size differences due to N deficiency.
Remember that this method for estimating pre-harvest grain yield in corn indeed provides only an estimate. Since kernel size and weight will vary depending on hybrid and environment, this yield estimator should only be used to determine “ballpark” grain yields. Yield can easily be overestimated in a year with poor grain fill conditions (e.g., low kernel size and weight from a drought year) and underestimated in a year with excellent grain fill conditions (e.g., larger kernel size and weight from non-stress grain fill periods). The closer to kernel black layer stage you sample, the more accurately you can “guesstimate” whether kernel weight will be above or below average for this year. Recognize that the Yield Component Method for estimating corn grain yield is probably only accurate within plus or minus 20 bushels of the actual yield. Obviously, the more ears you sample within a field, the more accurately you will “capture” the variability of yield throughout the field. Use the yield estimates obtained by this method for general planning purposes only.
Smart Phone and Mobile Tablet Apps
There are a number of apps available for download to your smart phone or mobile tablet that can be used to simplify the calculations of the Yield Component Method. Some crop scouting apps include grain yield estimators as one of their features. Be sure to thoroughly test the calculations of any app you choose to use on your phone to ensure that the math is correct. Some offer multiple kernel “fudge factors”, but do not literally specify what kernel numbers per 56-lb bushel they use. Some only allow you to sample 3 ears at a time. Most do not allow you to sample AND save the results of multiple sites within a field or multiple fields in an operation. As the old adage says… “Buyer beware!”
This curmudgeon prefers to do the math the old-fashioned way… with my smart phone calculator and a note pad.
The Pro Farmer Midwest Crop Tour Method
The Pro Farmer division of Farm Journal Media sponsors an annual Midwest Crop Tour that sends out teams of “scouts” to visit corn fields throughout the Midwest to estimate yields. The method used in that effort is a variation of one described years ago by University of Minnesota agronomist Dale Hicks (now Professor Emeritus) that combines the use of several yield components (ears per acre and kernel rows per ear) with a measurement of ear length (a proxy for kernel number per row).
The focus of the crop tour is not to necessarily estimate the yields of specific fields, but rather to more broadly estimate the yield potential within regions of the Midwest, so one probably should exercise caution in using this method for estimating yields within an individual field. Nevertheless, folks who have heard about the Pro Farmer Tour may be interested in trying the method themselves, so here are the steps involved with the Pro Farmer method (Flory, 2010; Micik, 2013). I would certainly suggest that these steps be repeated in several areas of an individual field because of natural spatial variability for yield.
1. Measure and record the row spacing (inches) used in the field.
EXAMPLE: 30 inches
2. Walk through the end rows into the bulk of the field, then walk about 35 paces down the rows to the first sampling area.
TIP: For subsequent yield estimates within the field, I would suggest walking even further into the field and crossing over multiple planter passes to sample different areas of the field.
3. Measure or step off 30 feet down the row, then count all ears in the two adjacent rows. Divide that number by two and record it.
EXAMPLE: (42 ears in one row + 45 ears in other row) divided by 2 = 43.5
4.Pull the 5th, 8th and 11th ears from plants in one row of the sampling area.
TIP: Frankly, I would suggest harvesting up to 5 ears from each of the two adjacent rows to better sample the area and minimize the effect that one oddball ear could have on the calculated average ear lengths and kernel row numbers.
5. Measure length of the portion of each ear that successfully developed kernels. Calculate the average ear length of the three ears and record it. Because cob length increases during the grain filling process, it is important that fields not be sampled any earlier than kernel dough stage or even kernel dent stage.
EXAMPLE: (6 inches + 7 inches + 5 inches) divided by 3 = 6
6. Count the number of kernel rows on each ear. Calculate the average kernel row number and record it.
EXAMPLE: (16 rows + 14 rows + 16 rows) divided by 3 = 15.3
7. Grain yield for the sampling area is calculated by multiplying the average ear count by the average ear length by the average kernel row number, then dividing by the row spacing.
EXAMPLE: (43.5 ears x 6 inches x 15.3 rows) divided by 30-inch rows = 133 bu/ac yield estimate
Related Reading
Elmore, Roger. 2017. Estimating Potential Corn Yield. CropWatch, Univ. Nebraska. https://cropwatch.unl.edu/2017/estimating-corn-yield [URL accessed Aug 2018].
Flory, Chip. 2010. Crop Tour Insider. Pro Farmer, Farm Journal Media. [Originally online, but no longer accessible. See Mick, 2013].
Lauer, Joe. 2002. Methods for Calculating Corn Yield. Agronomy Advice, Univ. of Wisconsin-Madison. http://corn.agronomy.wisc.edu/AA/pdfs/A033.pdf [URL accessed Aug 2018].
Lee, Chad and Jim Herbek. 2005. Estimating Corn Yields (AGR-187). Univ. of Kentucky. http://www.ca.uky.edu/agc/pubs/agr/agr187/agr187.pdf. [URL accessed Aug 2018].
Licht, Mark. 2017. Estimating Corn Yields Using Yield Components. ICM Newsletter, Iowa State Univ. https://crops.extension.iastate.edu/cropnews/2017/08/estimating-corn-yields-using-yield-components [URL accessed Aug 2018].
Micik, Katie. 2013. How the Crop Tour Arrives at Yield Estimates. DTN/Progressive Farmer. https://www.dtnpf.com/agriculture/web/ag/perspectives/blogs/market-matters-blog/blog-post/2013/08/19/crop-tour-arrives-yield-estimates [URL accessed Aug 2018].
Nielsen, RL (Bob). 2012. Opportunities to Assess Yield Potential of Drought-Stressed Corn. Corny News Network, Purdue Extension. http://www.kingcorn.org/news/articles.12/YldAssessment-0727.html [URL accessed Aug 2018].
Nielsen, R.L. (Bob). 2018a. Effects of Stress During Grain Filling in Corn. Corny News Network, Purdue Univ. http://www.kingcorn.org/news/timeless/GrainFillStress.html [URL accessed Aug 2018].
Nielsen, R.L. (Bob). 2018b. Grain Fill Stages in Corn. Corny News Network, Purdue Univ. http://www.kingcorn.org/news/timeless/GrainFill.html [URL accessed Aug 2018].
Nielsen, R.L. (Bob). 2018c. Kernel Set Scuttlebutt. Corny News Network, Purdue Univ. http://www.kingcorn.org/news/timeless/KernelSet.html [URL accessed Aug 2018].
Thomison, Peter. 2015. Estimating Corn Yields. C.O.R.N. Newsletter, Ohio State Univ. http://agcrops.osu.edu/newsletter/corn-newsletter/2015-25/estimating-corn-yields [URL accessed Aug 2018].
Thomison, Peter. 2018. Estimating Corn Yields at Early Stages of Kernel Development. C.O.R.N. Newsletter, Ohio State Univ. https://agcrops.osu.edu/newsletter/corn-newsletter/2018-24/estimating-corn-yields-early-stages-kernel-development [URL accessed Aug 2018.
