

Meteorological spring (March-May) roared to a close on May 31, and the data is in—it was the 26th wettest on record in 130 years of records, with 14.28 inches of precipitation statewide, over 1.5 inches above normal. At the local level, Fort Wayne had its 4th wettest meteorological spring on record, with 15.93 inches of rain. South Bend had its 25th wettest on record with 12.10 inches of precipitation, and Indianapolis came in at 24th with 15.5 inches. Any drought conditions are long gone!
The wetter pattern has calmed down, though. The National Weather Service’s Climate Prediction Center (NWS CPC) is predicting near normal precipitation for the entire Hoosier State through June 25, and equal chances for above or below normal precipitation through the beginning of July.
Even more noteworthy is the degree of confidence in above normal temperatures through much of the rest of June. Through at least June 25, the CPC has almost all of Indiana in an 80-90% chance of above normal temperatures (Figure 1). We’re likely staring down many hot and humid days ahead for the rest of June, including heat index values potentially climbing above 100°F. NWS HeatRisk, a new experimental product used to forecast the risk of heat-related impacts, is already predicting moderate heat impacts for Indiana by June 16, and major heat impacts by June 17 (Figure 2). This means people should start making contingency plans for any long duration outdoor activity in the coming days and weeks.
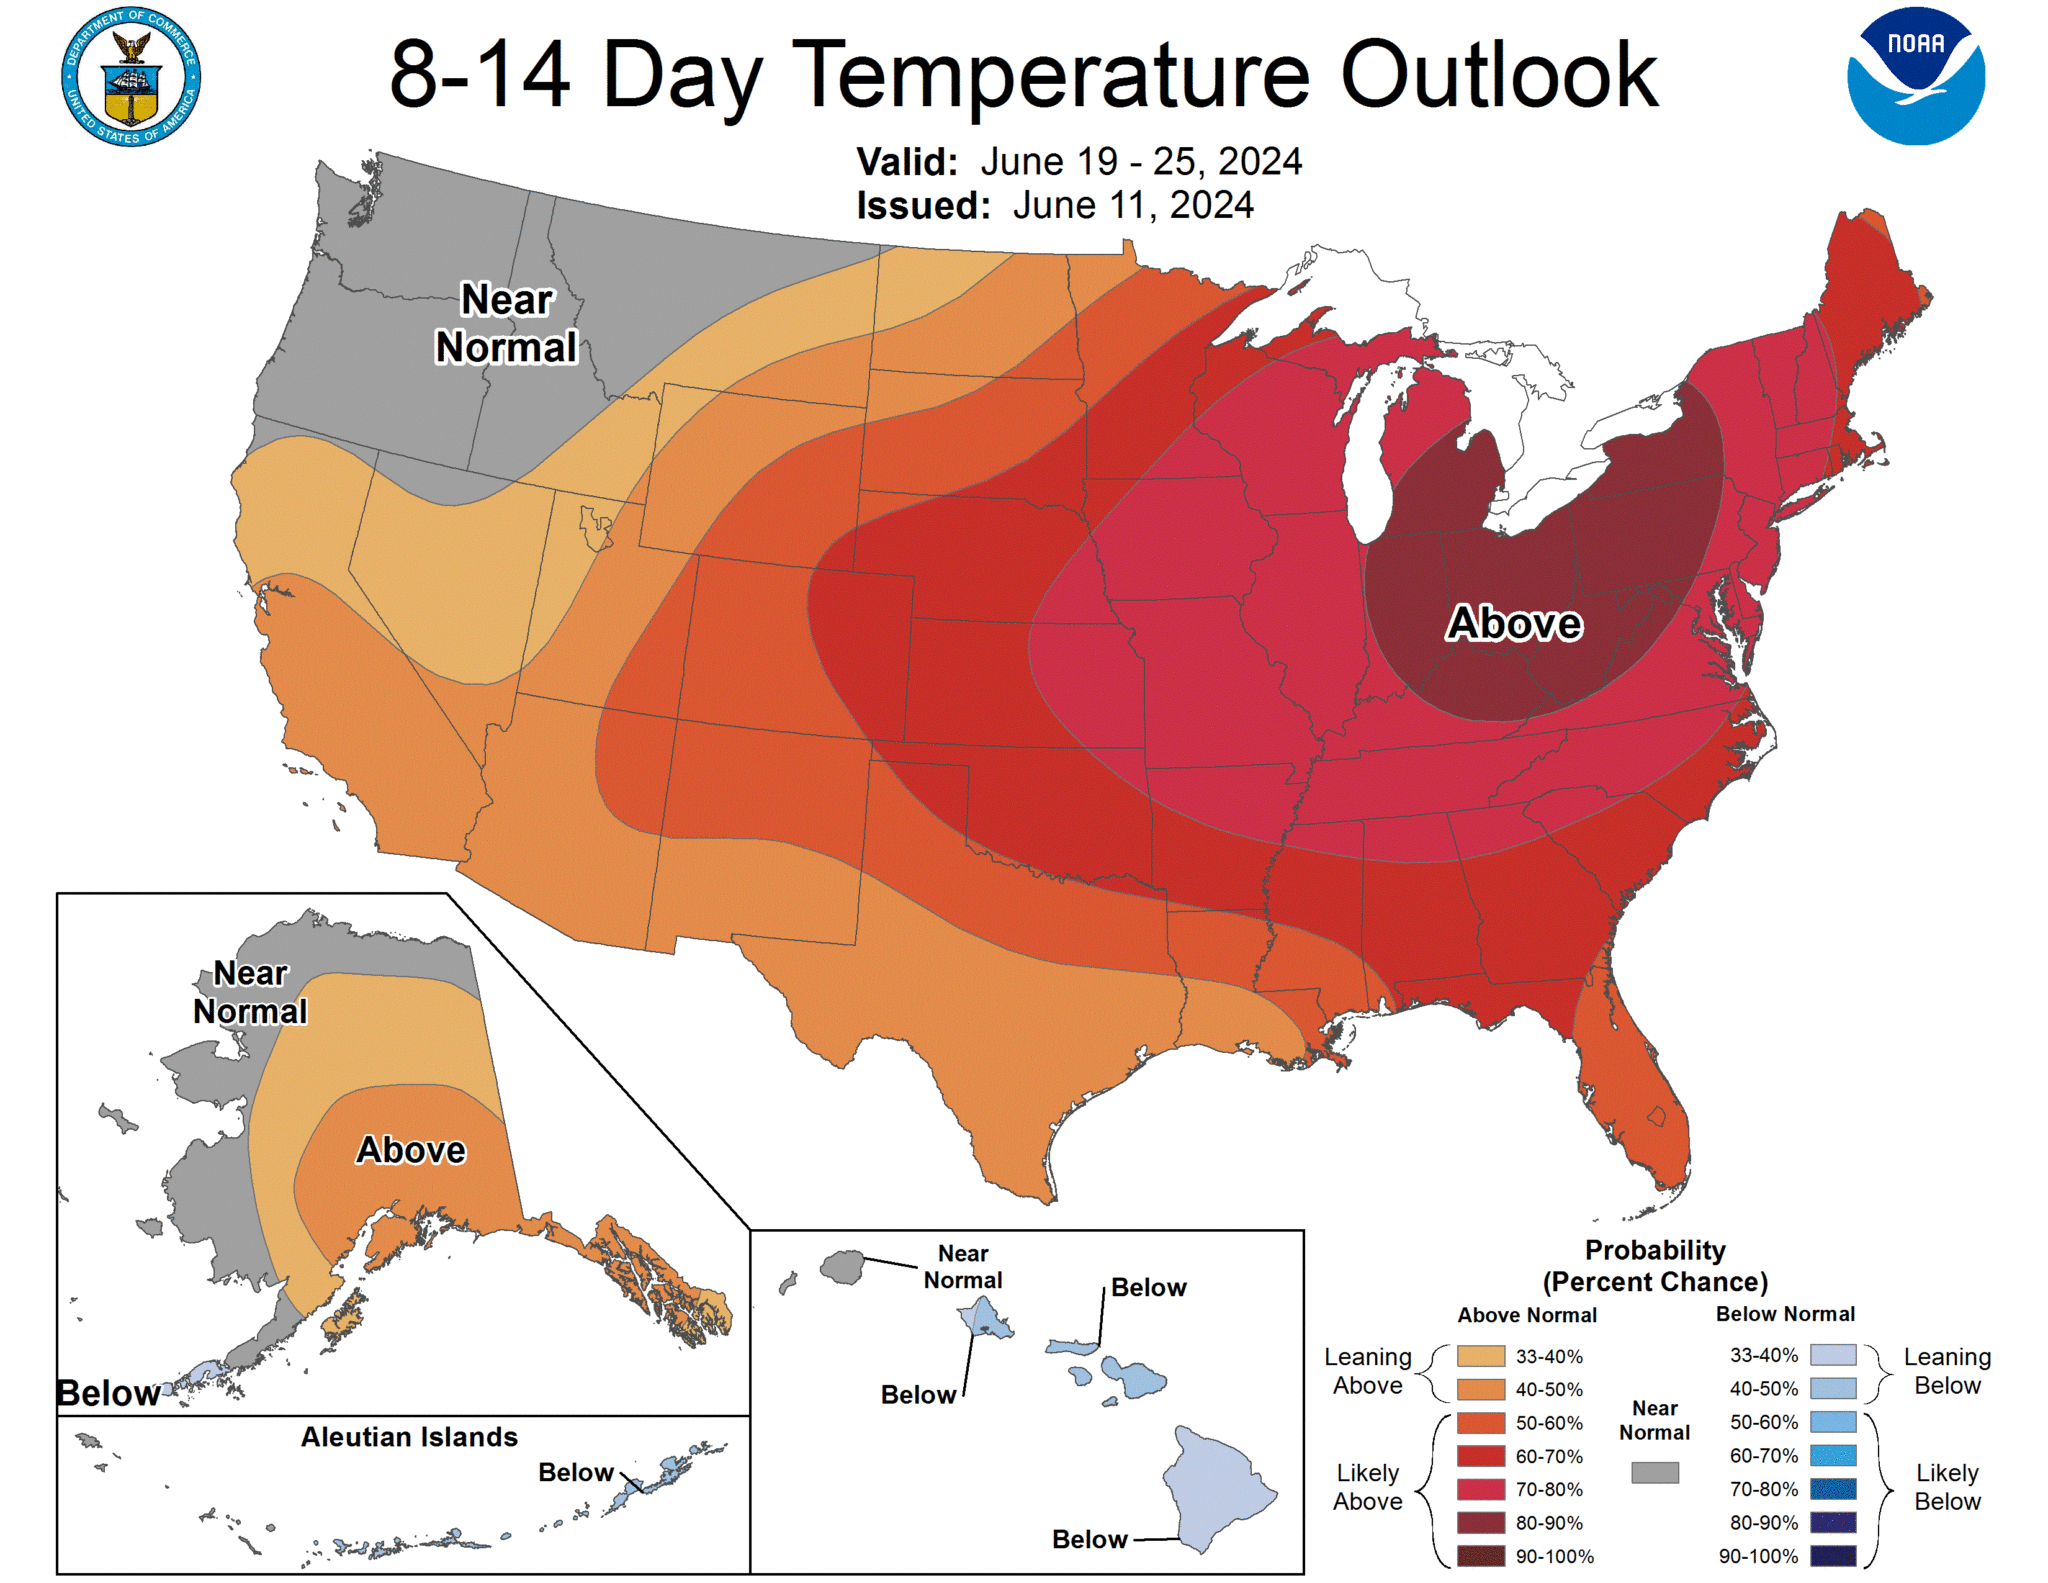
Figure 1: The National Weather Service’s Climate Prediction Center’s 8-14 day temperature outlook displays high confidence in above normal temperatures for the period June 19-25.
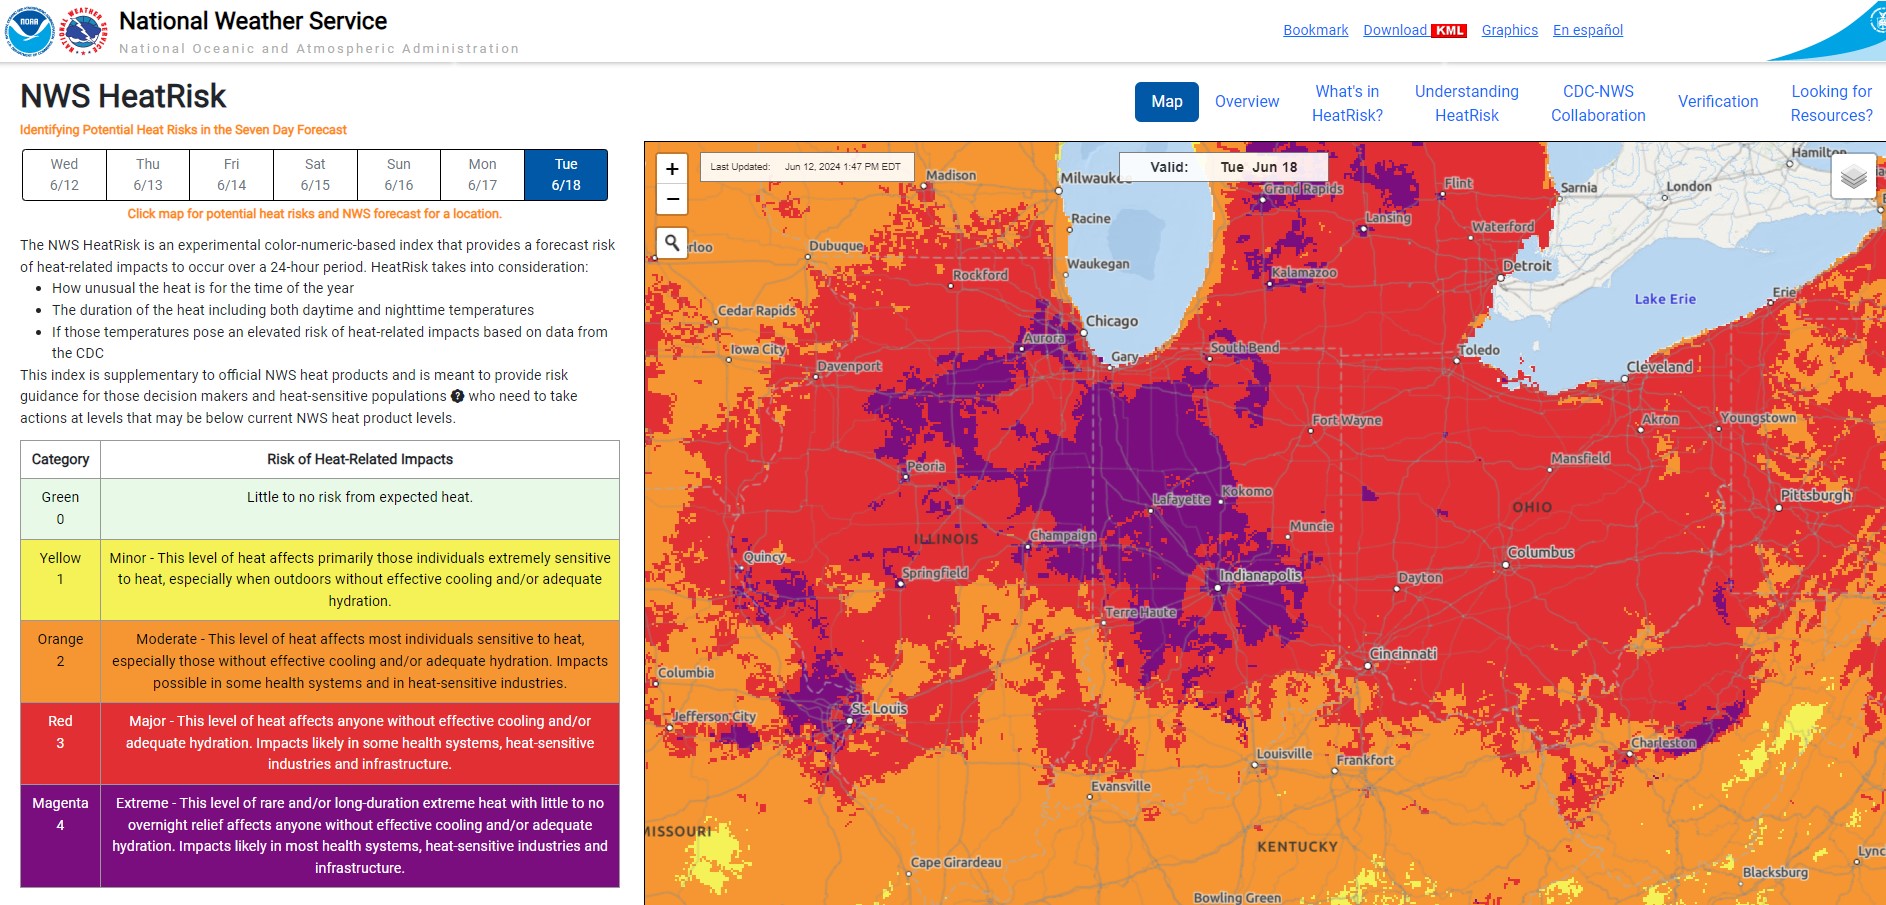
Figure 2: The National Weather Service’s experimental HeatRisk product has much of Indiana with the risk of extreme heat on June 17. this means long duration outdoor activity will affect most people negatively.
As temperatures have warmed, growing degree days have also accumulated rapidly, especially since May 1 (Figure 3). GDD accumulations have been above normal statewide for months now, and since just the beginning of May accumulations have been above normal, most notably through central Indiana (Figure 4).
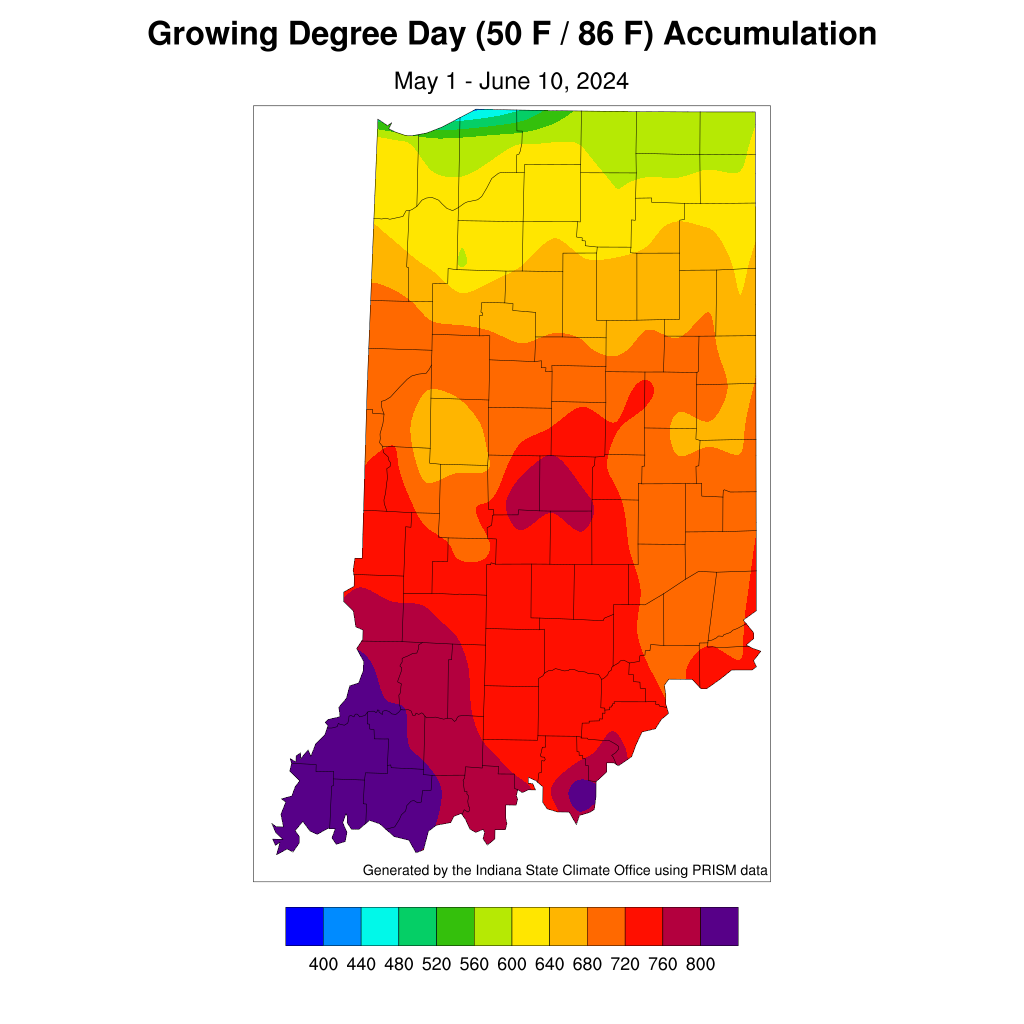
Figure 3: Growing Degree Day Accumulations for May 1-June 10.
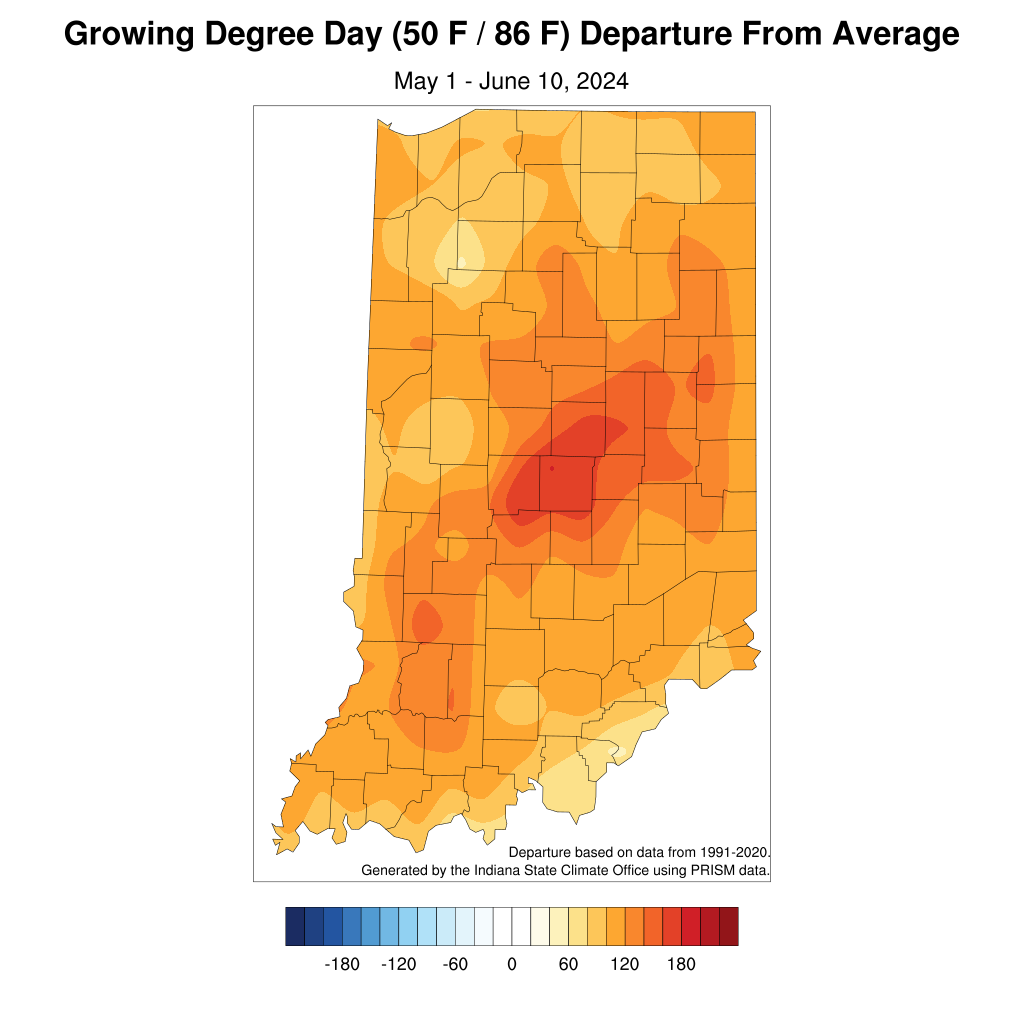
Figure 4: Growing Degree Day Departure from Average for May 1-June 10.
