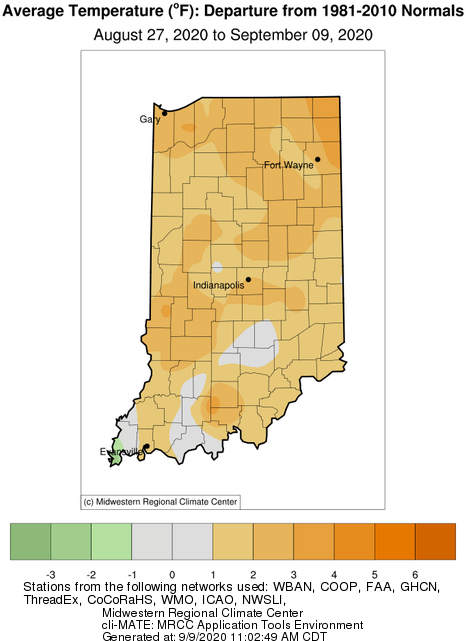
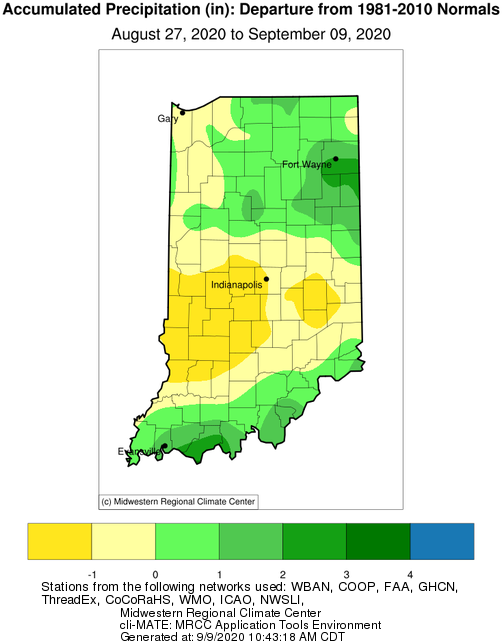
For those keeping track of my articles over the last few weeks, the outlooks of wetter and cooler than normal conditions have been the theme. The cooler temperatures never really came to fruition. In fact, most of Indiana was 1°F to 3°F above normal over the past two weeks (Figure 1)! Regarding the wetter-than-normal precipitation outlook, northern counties, northeastern Indiana, as well as along the Ohio River received above normal precipitation. However, the rest of the state experienced 1” to 2” less-than-normal precipitation over the past 2-week period (Figure 2). Even the above-normal precipitation in the northern and northeastern counties have had little impact relieving the developing drought conditions!
What may have caused such a bust in these climate outlooks? First, the tropical storm activity tends to disrupt the atmosphere and patterns over a broad area. Second, the western heat waves and wildfires also have an influence on these larger-scale weather patterns. Finally, the Pacific equatorial region that is showing signs of developing a La Niña tends to confuse the computer models that generate the climate outlooks. Therefore, the combination of these (and likely other factors) make climate outlooks very challenging. Unfortunately, as we transition into fall, the day-to-day variability of the weather will further complicate any confidence in climate outlooks.
The precipitation forecast over the next 7 days looks to be on the dry side. Cooler temperatures should become more obvious next week, but there is still no indication of the snow or frost conditions that the Dakotas and Colorado are facing this week. Climate outlooks from September 14th through 22nd are showing too much uncertainty for both temperature and precipitation, so there is very little guidance that can be offered in this area.
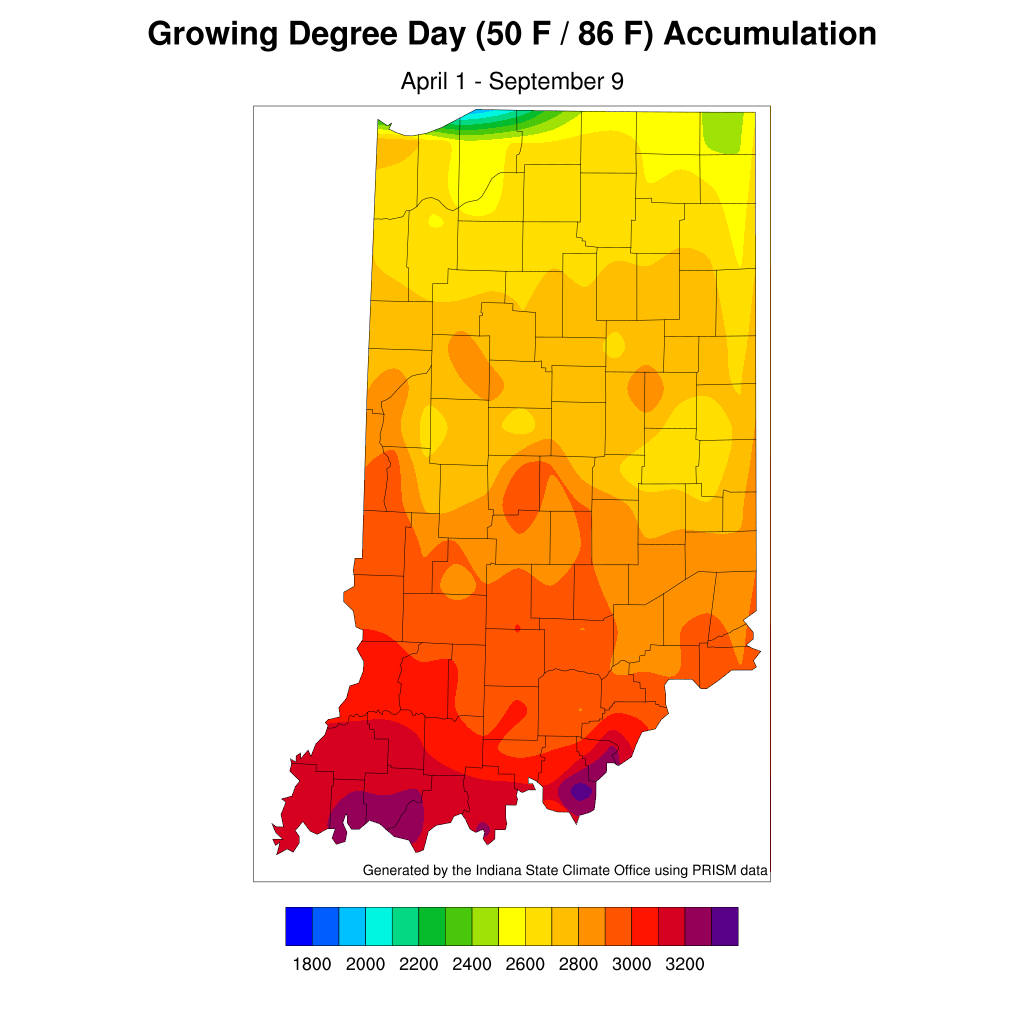
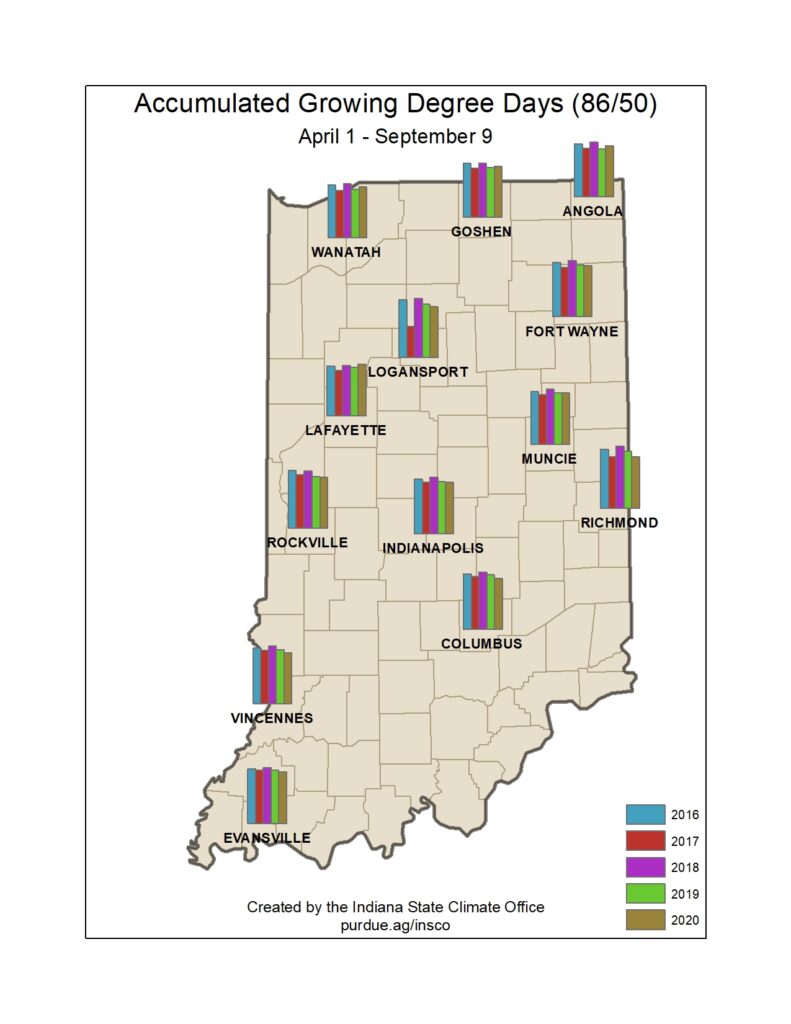
For the most recent maps of accumulated modified growing degree days for this year, in addition to comparison to recent years, see Figures 3 and 4.


