Pest & Crop
Newsletter
Purdue Cooperative Extension Service
Purdue Cooperative Extension Service
Issue 6, May 7, 2015 • USDA-NIFA Extension IPM Grant
CLICK HERE FOR A PDF VERSION OF THIS ISSUE ![]()
Last year, 2014, we switched from black light to universal traps (also called Unitraps or bucket traps) at our Purdue Ag Research Centers (PACs), for monitoring true armyworm (Pseudaletia unipuncta). We knew that captures would be different, beginning with the fact that pheromone-baited traps only attracts male moths, whereas black light (ultraviolet) is attractive to both sexes. We consulted with our colleagues at the University of Kentucky (UK), who deal with this pest more regularly, before we made this change to determine which trap to use. UK uses a Hartstack (also, known as Texas cone) trap, which is a large, bulky and expensive wire mesh trap. Published literature on other armyworm species, e.g., fall and beet, supported the use of universal trap with pheromone. For cost effectiveness and ease of use for the PAC managers, we chose the bucket.
We have watched with great interest the UK armyworm moth captures http://www.uky.edu/Ag/IPMPrinceton/counts/taw/tawgraph.htm the last two springs, using the Hartstack trap. Their large catches, compared with our miniscule numbers were not a complete shock, as the different traps types are comparing apples to oranges. We know that large moth captures don’t correspond with heavy insect outbreaks, and vice-versa. But what was bothering us was consistently low numbers, even when kicking armyworm moths out of the grasses during the day. We knew they were in the area, yet we weren’t catching them!
On a quest for scientific truth (i.e. hunch), we placed a Hartstack trap about a half-mile from our bucket trap with the same lure at the PAC south of campus. The first week’s catch of late April weren’t too impressive: Bucket = 0, Hartstack = 7. What a difference for this past week’s catch, especially with warming temperatures: Bucket = 0, Hartstack = 548. Although it is a sample size of only 1 – it is clear that given this data point and the UK experience, it’s clear that we might be under-reporting armyworm activity from our previous trap catches. Research lingo for this is called a “false-negative.” Meaning the armyworm moths are present and not being captured in the bucket traps, or the zero trap captures is NOT representative of reality.
For those that have been watching our armyworm moth trap catches and lured to a false-sense of security, it is time to WAKE UP. We don’t want anyone to be caught surprised by an armyworm outbreak. For those that have experienced the “march” of armyworm larvae as they devour pastures and crop, you understand the need for scouting high-risk crops. High-risk crops are those planted into dense, grassy vegetation (e.g., wheat, grass hay, grass cover crops) that have attracted the moths for egg-laying. For about 2 weeks, the armyworm will hardly be noticeable as they develop. Then what seems like overnight, the mature larvae consume tremendous amounts of foliage as they move through a field. Bottom-line, scout high-risk fields very shortly! You have been warned!!!
This kind of mess up happens sometimes in pest management – insects don’t always get the memo when they’re supposed to do something to make our lives easier. So it’s clear that we will have to remedy this in future years, but for 2015 consider this a public service announcement for those that have been watching our armyworm moth trap catches and lured to a false-sense of security. We don’t want anyone to be caught surprised by an armyworm outbreak. For those that have experienced the “march” of armyworm larvae as they devour pastures and crop, you understand the need for scouting high-risk crops. High-risk crops are those planted into dense, grassy vegetation (e.g., wheat, grass hay, grass cover crops) that have attracted the female moths for egg-laying. For about 2 weeks, the armyworm will be tiny and hardly noticeable as they develop. Then, what seems like overnight, the mature larvae consume tremendous amounts of foliage as they move through a field. Bottom-line, scout high-risk fields soon!
Happy Scouting!
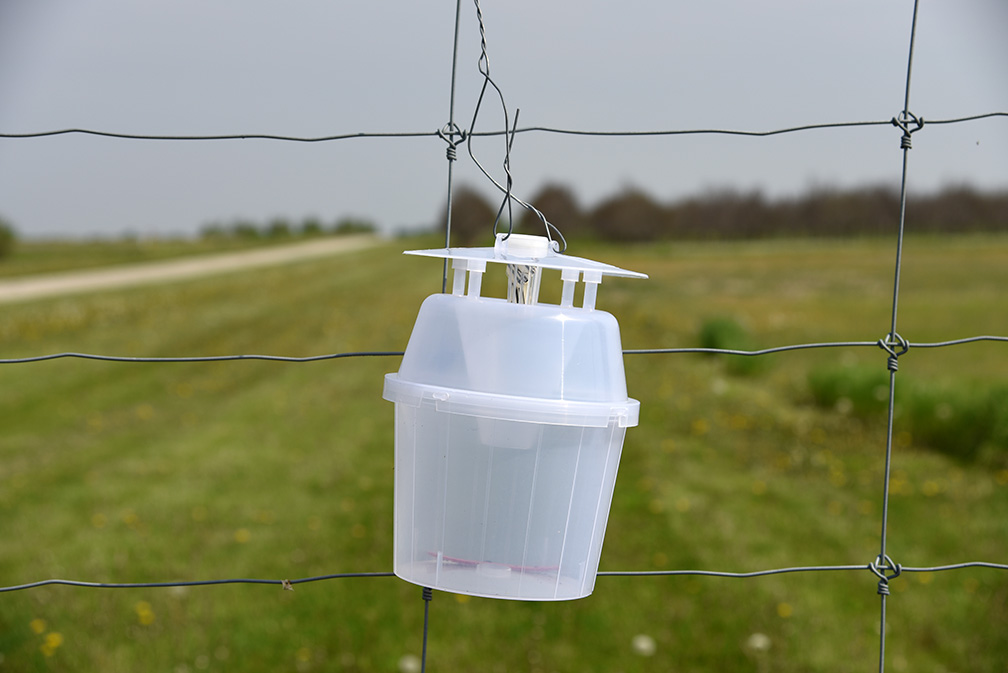 Bucket trap = 0 armyworm moths.
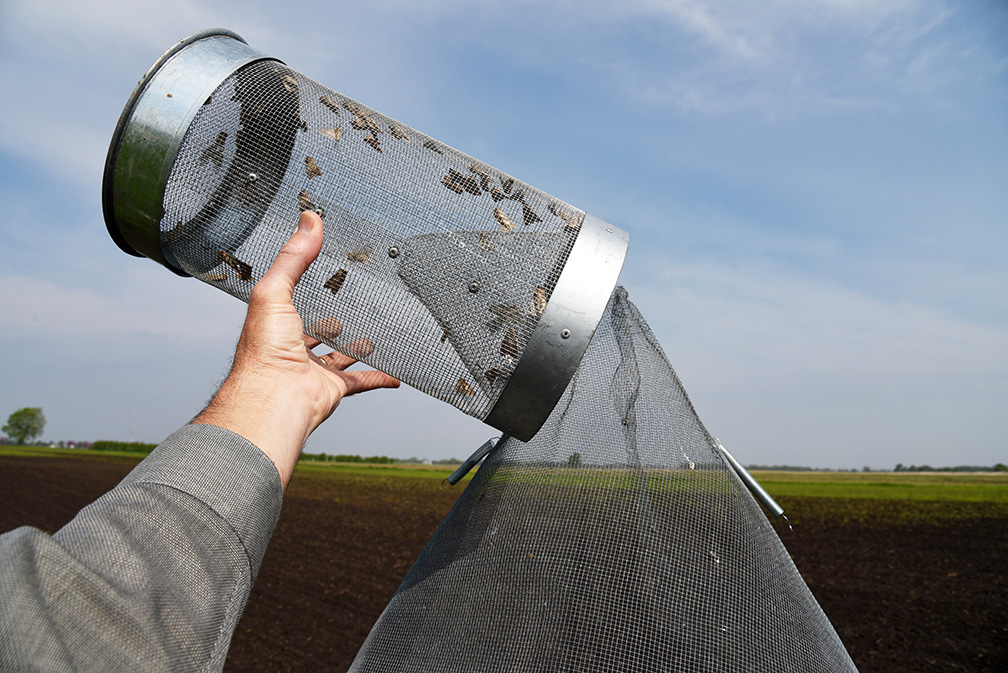 Hartstack trap = 105 armyworm moths.
| County | Cooperator | BCW Trapped | |
|---|---|---|---|
| Week 1 4/23/15 - 4/29/15 |
Week 2 4/30/15 - 5/6/15 |
||
| Adams | Kaminsky/New Era Ag | 12 | 15 |
| Adams | Roe/Mercer Landmark | 6 | 28* |
| Allen | Anderson/Syngenta Seed | 15 | 4 |
| Allen | Gynn/Southwind Farms | 1 | 5 |
| Allen | Kneubuhler/G&K Concepts | 7 | 10 |
| Bartholomew | Bush/Pioneer Hybrids | 0 | 0 |
| Boone | Campbell/Beck's Hybrids | 7 | 21* |
| Clay | Bower/Ceres Solutions, Brazil | 0 | |
| Clay | Bower/Ceres Solutions, Bowling Green | 0 | |
| Clinton | Emanuel/Boone Co. CES | 1 | 4 |
| Clinton | Foster/Purdue Entomology | 3 | 3 |
| DeKalb | Hoffman/ATA Solutions | 2 | 1 |
| Dubois | Eck/Purdue CES | 28* | 16 |
| Elkhart | Kauffman/Crop Tech Inc. | 25 | 40* |
| Fayette | Schelle/Falmouth Farm Supply Inc. | 4 | 24* |
| Fountain | Mroczkiewicz/Syngenta | 15* | 54* |
| Fulton | Jenkins/N. Central Coop-Rochester | 37* | 6 |
| Fulton | Jenkins/N. Central Coop-Kewana | 14* | 8 |
| Gibson | Schmitz/Gibson Co. CES | 1 | 0 |
| Hamilton | Campbell/Beck's Hybrids | 9* | 10* |
| Hamilton | Truster/Reynolds Farm Equipment | 2 | |
| Hendricks | Nicholson/Nicholson Consulting | 76* | 77* |
| Henry | Schelle/Falmouth Farm Supply Inc., Millville | 3 | 6 |
| Jasper | Overstreet/Purdue CES | 1 | 0 |
| Jasper | Ritter/Brodbeck Seeds | 8 | 40* |
| Jay | Boyer/Davis PAC | 5 | 8 |
| Jay | Shrack/Ran Del Agri Services | 0 | |
| Jay | Temple/Jay County CES | 2 | 4 |
| Jennings | Bauerle/SEPAC | 6 | 15* |
| Knox | Bower/Ceres Solutions, Freelandville | 3 | 1 |
| Knox | Bower/Ceres Solutions, Vincennes | 13* | 5 |
| Knox | Bower/Ceres Solutions, Fritchton | 0 | 2 |
| Lake | Kleine/Kleine Farms | 12 | 17 |
| Lake | Moyer/Dekalb Hybrids, Shelby | 1 | 1 |
| Lake | Moyer/Dekalb Hybrids, Schneider | 6 | 20* |
| LaPorte | Barry/Kingsbury Elevator | 2 | 4 |
| LaPorte | Rocke/Agri-Mgmt Solutions, Wanatah | 1 | 2 |
| LaPorte | Rocke/Agri-Mgmt Solutions, LaCrosse | 1 | 2 |
| Miami | Early/Pioneer Hybrids | 1 | 0 |
| Miami | Myers/Myers Ag Service | ||
| Montgomery | Stine/Nicholson Sonsulting | 0 | 4 |
| Newton | Moyer/Dekalb Hybrids | 0 | 2 |
| Porter | Leuck/PPAC | 1 | 8 |
| Putnam | Nicholson/Nicholson Consulting | 2 | 2 |
| Randolph | Boyer/DPAC | 2 | 0 |
| Rush | Schelle/Falmouth Farm Supply Inc. | 1 | 0 |
| Shelby | Simpson/Simpson Farms | 8 | 8 |
| Sullivan | Bower/Ceres Solutions, Farmersburg | 10 | 14 |
| Sullivan | Bower/Ceres Solutions, Sullivan E | 40* | 18* |
| Sullivan | Bower/Ceres Solutions, Sullivan W | 8 | 7 |
| Tippecanoe | Bower/Ceres Solutions | 15* | 7 |
| Tippecanoe | Nagel/Ceres Solutions | 14 | 61* |
| Tippecanoe | Obermeyer/Purdue Entomology | 31* | 4 |
| Tippecanoe | Westerfeld/Monsanto | 20 | 3 |
| Whitley | Walker/NEPAC | 57* | 78* |
* = Intensive Capture...this occurs when 9 or more moths are caught over a 2-night period
| County/Cooperator | Wk 1 | Wk 2 | Wk 3 | Wk 4 | Wk 5 | Wk 6 | Wk 7 | Wk 8 | Wk 9 | Wk 10 | Wk 11 | Wk 12 |
|---|---|---|---|---|---|---|---|---|---|---|---|---|
| Dubois/SIPAC Ag Center | 0 | 0 | 1 | 0 | 2 | |||||||
| Jay/Davis Ag Center | 0 | 0 | 2 | 0 | 4 | |||||||
| Jennings/SEPAC Ag Center | 0 | 0 | 0 | 0 | 1 | |||||||
| Knox/SWPAC Ag Center | 0 | 0 | 0 | 1 | ||||||||
| LaPorte/Pinney Ag Center | 0 | 0 | 3 | 0 | 17 | |||||||
| Lawrence/Feldun Ag Center | 0 | 2 | 0 | 1 | 0 | |||||||
| Randolph/Davis Ag Center | 0 | 0 | 0 | 0 | 0 | |||||||
| Tippecanoe/Meigs | 0 | 0 | 1 | 0 | 0 | |||||||
| Tippecanoe/Meigs (Hartstack) |
7 | 548 | ||||||||||
| Whitley/NEPAC Ag Center | 0 | 1 | 5 | 2 | 17 |
Wk 1 = 4/2/15 - 4/8/15; Wk 2 = 4/9/15 - 4/15/15; Wk 3 - 4/16/15 - 4/22/15; Wk 4 - 4/23/15-4/29/15;
Wk 5 - 4/30/15-5/6/15
Conventional wisdom says that the prime planting window to maximize corn yields in much of Indiana opens about April 20 and closes about May 10. This “window” typically opens about one week later across the northern tier of Indiana counties (later warmup) and about one week earlier across the southern tier of Indiana counties (earlier warmup).
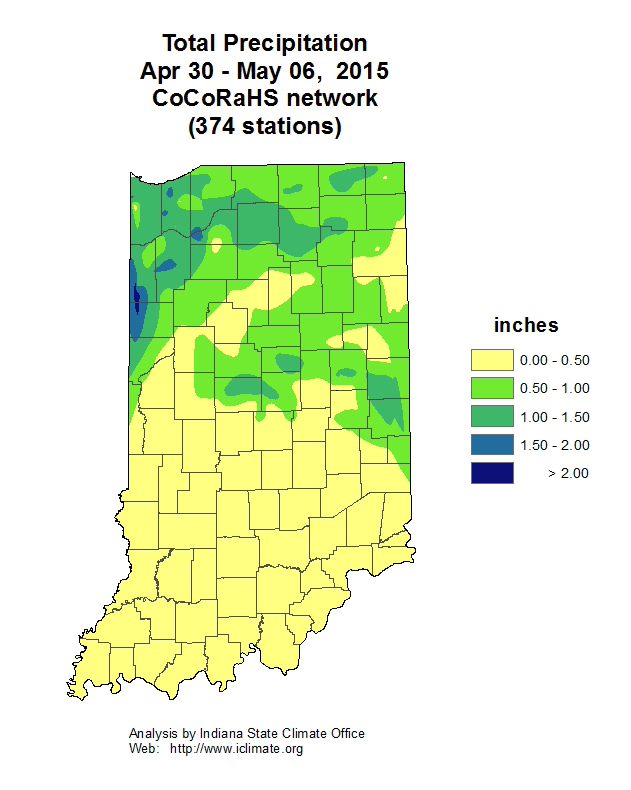
The 2015 planting season for corn has gotten off to a slow start for Indiana with only 21% of the state's corn crop reported as planted by 3 May, compared to the running five-year average of 35% (USDA-NASS, 2015a). Rainfall in recent days around areas of the state threaten to further delay planting of the state's most important row crop. For some growers, tillage operations, herbicide applications, and nitrogen fertilizer applications must be completed first before they can consider planting their crops.
What are the consequences of a delayed start to planting? How important a predictor of statewide corn yield is planting date anyway? Does late planting in and of itself guarantee lower than normal yields? Good questions, but the effect of planting date on statewide average corn yield is simply not clearcut.
If one reviews USDA-NASS crop progress reports for the past 20 years (USDA-NASS, 2015b), there is NOT a strong relationship between planting date and absolute yield on a statewide basis for Indiana. Specifically, percent departures from annual trend yields are not strongly related to corn planting progress. Figures 1 and 2 illustrate this relationship for two measures of statewide planting progress; percent acres planted by April 30 or by May 15. Even though one can statistically define mathematical relationships between departures from statewide trend yield and statewide planting progress by April 30 or May 15, the relationships only account for 12 to 21% of the variability in trend yield departures from year to year. In other words, a number of yield influencing factors (YIFs) in addition to planting date also affect the ultimate absolute yield for a given year.
Here's the Conundrum
Why is it that every corn agronomist known to man preaches about the importance of timely planting and yet the statewide statistical data suggest that planting date accounts for less than 25% of the variability in statewide yields from year to year? Let's look more closely at this apparent conundrum.
It is true that relative grain yield potential of corn declines with delayed planting after about May 1 (Myers & Wiebold, 2013, Nafziger, 2008; Nafziger, 2011). Estimated yield loss per day with delayed planting varies from about 0.3% per day early in May to about 1% per day by the end of May. Yield potential goes down with delayed planting because of a number of factors, including a shorter growing season, greater insect & disease pressure, and higher risk of hot, dry conditions during pollination.
However, the good news is that planting date is only one of many YIFs for corn. What is important to understand is that yield loss due to delayed planting is relative to the maximum possible yield in a given year.
In other words, if all the other YIFs work together to determine that the maximum possible yield this year for the optimum planting date is 220 bu/ac, then the consequence of a 10-day planting delay beyond April 30 (at 0.3% decrease per day) would be a yield potential of about 213 bu/ac (i.e., 220 bushel potential minus [10 days x 0.3%] due to delayed planting). However, if all the other YIFs work together to determine that the maximum possible yield this year for the optimum planting date is only 150 bu/ac, then the consequence of a 10-day planting delay beyond May 1 (at 0.3% decrease per day) would be a yield potential of about 146 bu/ac (i.e., 150 bu/ac potential minus [10 days x 0.3%] due to delayed planting). Make sense?
Consequently, it is possible for early-planted corn in one year to yield more than, less than, or equal to later-planted corn in another year depending on the exact combination of YIFs for each year. Figure 3 illustrates this often confusing concept. In that graph, a delayed planting of corn in an otherwise high yielding year (B) may still be higher yielding than a crop planted on the optimum planting date in an otherwise lower yielding year (C). Farmers know this to be true because some have had June-planted crops in recent years that ultimately yielded better than any crop they have ever had.............. because the remainder of the growing season following the delayed planting was exceptional.
For example, the crop years 2012 and 2009 represent early and late planting date years respectively in Indiana. About 94% of the state's corn crop was planted by May 15 in 2012, but only 20% of the crop was planted by May 15 of 2009 (Fig. 2). Yet, the earlier planted 2012 crop yielded 38.2% BELOW trend yield for that year and the later planted 2009 crop yielded 10.3% ABOVE trend yield. Why? Important differences in YIFs between the years other than simply the planting dates.
Bottom LineLet's not succumb quite yet to fearmongering triggered by the prospects of further delays to corn planting in 2015. “Mudding in” a crop early to avoid planting late will almost always end up being an unwise decision.
Furthermore, since delayed planting by itself is no guarantee of lower ABSOLUTE grain yield, I see little reason to change any crop inputs because of delayed planting, other than possibly seeding rates. Delayed planting generally coincides with warmer soil temperatures compared to early planting. Consequently, stand establishment may be more successful with delayed planting, resulting in established plant populations that are closer to actual seeding rates than the usual 90 to 95% success rate with earlier planting dates. So, you might consider slightly reducing your seeding rates with delayed planting.
When faced with prospects of delayed planting, one should certainly look for ways to expedite the planting process by eliminating unnecessary tillage trips or delaying some field operations (Thomison et al., 2015) because there is no reason to purposefully plant any later than necessary.
Related ReadingMyers, Brent and Bill Wiebold. 2013. Planting Date 2013. Univ of Missouri Extension [On-line] http://ipm.missouri.edu/IPCM/2013/4/Planting-Date-2013. [URL accessed Apr 2013].
Nafziger, Emerson. 2008. Thinking About Corn Planting Date and Population. The Bulletin (No. 2, Article 7, April 4), Univ. of Illinois Extension. [On-line]. http://www.ipm.uiuc.edu/bulletin/article.php?id=890. [URL accessed Apr 2013].
Nafziger, Emerson. 2011. Corn Planting: Optimism on Hold. The Bulletin (No. 3, Article 9, Apr 22), Univ. of Illinois Extension. [On-line]. http://bulletin.ipm.illinois.edu/article.php?id=1469 [URL accessed Apr 2013].
Nielsen, RL (Bob). 2015. Corn & Soybean Planting Progress in Indiana Over the Years. Corny News Network, Purdue Extension. [On-line]. http://www.kingcorn.org/news/timeless/PlantingPace.html [URL accessed May 2015].
Thomison, Peter, Steve Culman, & Mark Loux. 2015. Adjusting Corn Management Practices for a Late Start. C.O.R.N. Newsletter, Ohio State Extension. [On-line] http://corn.osu.edu/newsletters/2015/2015-11/adjusting-corn-management-practices-for-a-late-start [URL accessed May 2015].
USDA-NASS. 2015a. Crop Progress (4 May 2015). USDA, National Agricultural Statistics Service. [On-line]. http://usda.mannlib.cornell.edu/usda/current/CropProg/CropProg-05-04-2015.txt. [URL accessed May 2015].
USDA-NASS. 2015b. Crop Progress (archives). USDA, National Agricultural Statistics Service. [On-line]. http://usda.mannlib.cornell.edu/MannUsda/viewDocumentInfo.do?documentID=1048. [URL accessed May 2015].
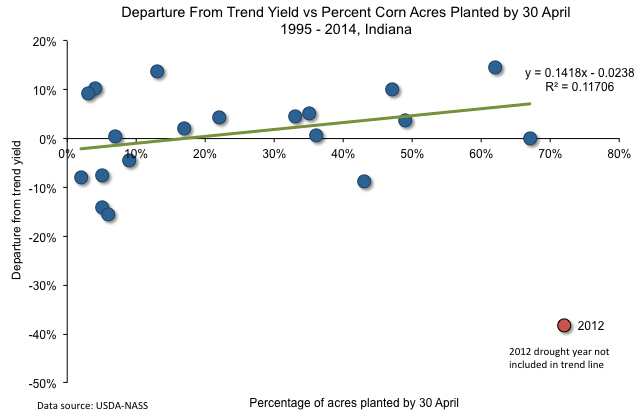 Figure 1. Percent departure from state wide trend yield versus percent of corn acres planted by April 30 in Indiana, 1995-2014.
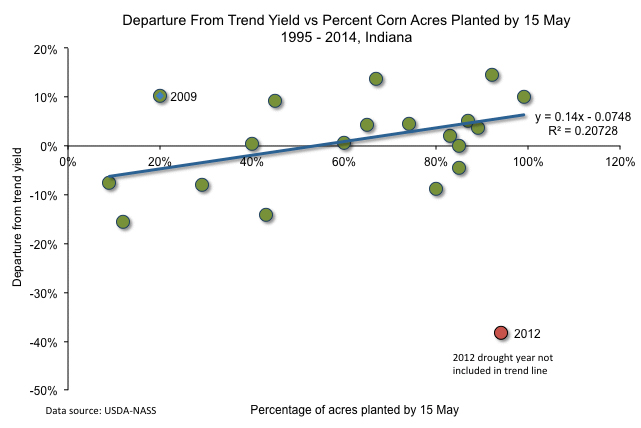 Figure 2. Percent departure from statewide trend yield versus percent of corn acres planted by May 15 in Indiana, 1995-2014.
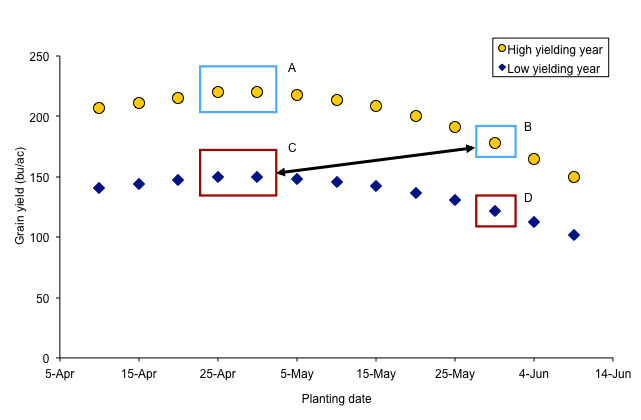 Figure 3. The planting date conundrum relative to absolute yield potential: A delayed planted crop in one year (B) can yield better than a crop planted on the optimum date in another year (C).
Wheat growth stages vary greatly across the state, but the warm weather will likely speed up development. In some fields in southern IN, wheat is in the boot stage [Feekes growth stage (FGS) 10] or heads are emerging (FGS 10.5). Wheat in some areas may be flowering (FGS 10.5.1) next week. As wheat approaches flowering it is important to consider the risk for Fusarium head blight (FHB), or scab, development.
The fungus that causes FHB, Fusarium graminearium, infects wheat during flowering, beginning at FGS 10.5.1. Symptoms appear later in the season and include bleached spikelets on the head, and small or shriveled grain kernels, commonly called “tombstones”. The fungus also produces mycotoxins, such as deoxynivalenol, or DON, which can accumulate in the infected grain.
Rainy, warm, and humid weather conditions favor disease development. We have had periods of intermittent moisture this spring, and the risk of infection is low for wheat that is beginning to flower this week. However, rain and warm temperatures over the weekend could increase the likelihood of infection if wheat is flowering over the weekend or early next week. It will be critical to watch the FHB risk assessment tool to assess the risk of Fusarium head blight in Indiana as wheat enters flowering. This model can be accessed through the following link: http://www.wheatscab.psu.edu/. This model uses weather information including temperature, rainfall, and relative humidity to calculate risk levels for FHB. The model has been updated and improved for 2015, and now also includes an option to predict risk based on variety susceptibility to FHB. Keep in mind that the model does not provide a guaranteed prediction for whether or not FHB will occur in individual fields, and additional factors such as the local weather forecast, crop conditions, and Extension commentary should be considered when assessing the level of risk. Producers can sign up for alerts courtesy of the U.S. Wheat and Barley Scab Initiative. Alerts can be sent to a cell phone or email, and will be sent out as the risk map updates risk of scab in Indiana. To sign up for alerts, visit: http://scabusa.org/fhb_alert.php.
If varieties susceptible to FHB have been planted, or farmers are worried about the risk of FHB development, they may want to consider a fungicide application at early flowering for suppression of FHB. Indiana research indicates that applications of the fungicides Prosaro and Caramba are most effective at managing FHB if they are applied at early flowering. Other products are available, but may not be as effective. Fungicides that have a strobilurin mode of action are not labeled for Fusarium head blight suppression. To accurately growth stage wheat and determine when wheat is beginning to flower, please see Purdue Extension publication ID-422 “Managing Wheat by Growth Stage”.
The foliar disease Septoria/Stagonospora leaf blotch has been observed in fields throughout the state, but is still at relatively low levels in most of Indiana. Fungicides applied at flowering for FHB suppression will also provide some level of protection from foliar disease on the flag leaf. If farmers are considering a foliar fungicide application for Septoria/Stagonospora leaf blotch control through boot stage, they should keep in mind that applications made prior to flowering will NOT suppress FHB or the associated mycotoxin deoxynivalenol, or DON. If the risk for FHB increases after foliar fungicide applications are made, it may be necessary to make another application at flowering for FHB suppression.
Fields across Indiana that were planted in between rains may experience emergence and stand establishment problems. These issues may be due to one or more factors including seedling blights or excess moisture. There are seedling blight organisms that are favored by cool, wet temperatures, but there are also organisms that prefer warm, wet weather like we are experiencing right now. It is very difficult to diagnose the cause of stand establishment issues in the field, and to accurately determine the specific organism responsible for seedling blight, it is necessary to submit samples to a diagnostic lab such as the Purdue Plant and Pest Diagnostic Lab.
These videos demonstrate how to sample fields to diagnose seedling blight and stand establishment issues.
Soybean Seedling: Sampling and Submission for Problem Diagnosis
Corn Seedling Blights and Proper Plant Sampling
Purdue Cooperative Extension Service
Purdue Extension Entomology
901 W. State Street
West Lafayette, IN, 47907
(765) 494-8761
luck@purdue.edu
@PurdueExtEnt
PurdueEntomology
![]()
If you would like to be alerted by e-mail when the current issue of the Pest&Crop is available on-line, please enter your e-mail address and click the submit button.
It is the policy of the Purdue University Cooperative Extension Service that all persons have equal opportunity and access to its educational programs, services, activities, and facilities without regard to race, religion, color, sex, age, national origin or ancestry, marital status, parental status, sexual orientation, disability or status as a veteran. Purdue University is an Affirmative Action institution. This material may be available in alternative formats.