Pest & Crop
Newsletter
Purdue Cooperative Extension Service
Purdue Cooperative Extension Service
Issue 5, May 1, 2015 • USDA-NIFA Extension IPM Grant
CLICK HERE FOR A PDF VERSION OF THIS ISSUE ![]()
Although reports of spring white grub damage have been relatively uncommon in Indiana in recent years, there have been a growing number of cases in the northeastern part of the state.
The European chafer Rhizotrogus majalis Razoumowsky is apparently at the root of several reports of large scale and severe damage to turfgrass this spring. This insect is a slightly different beast than our more familiar white grub species. It is significantly more cold-hardy which allows it to feed later into the fall and start feeding earlier in the spring compared to Japanese beetle and masked chafer grubs. It also shows up in areas with no previous history of white grub damage, including low maintenance areas.
Folks in Michigan have been dealing with this insect for many years now, but it is relatively new to Indiana; adults of this species were first detected in Porter, Kosciusko and Allen counties during 2007. With the help of several diligent individuals in the green industry, we have now linked several reports of serious spring white grub damage in LaGrange, Noble and Elkhart counties to this insect meaning that populations are now established in these areas and are likely established throughout the northern third of the state (see Figure 1 and 2).
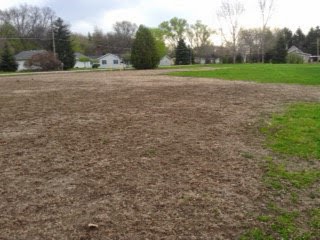
Figure 1. Home lawn in Nobel County showing extensive damage from European chafer grubs.
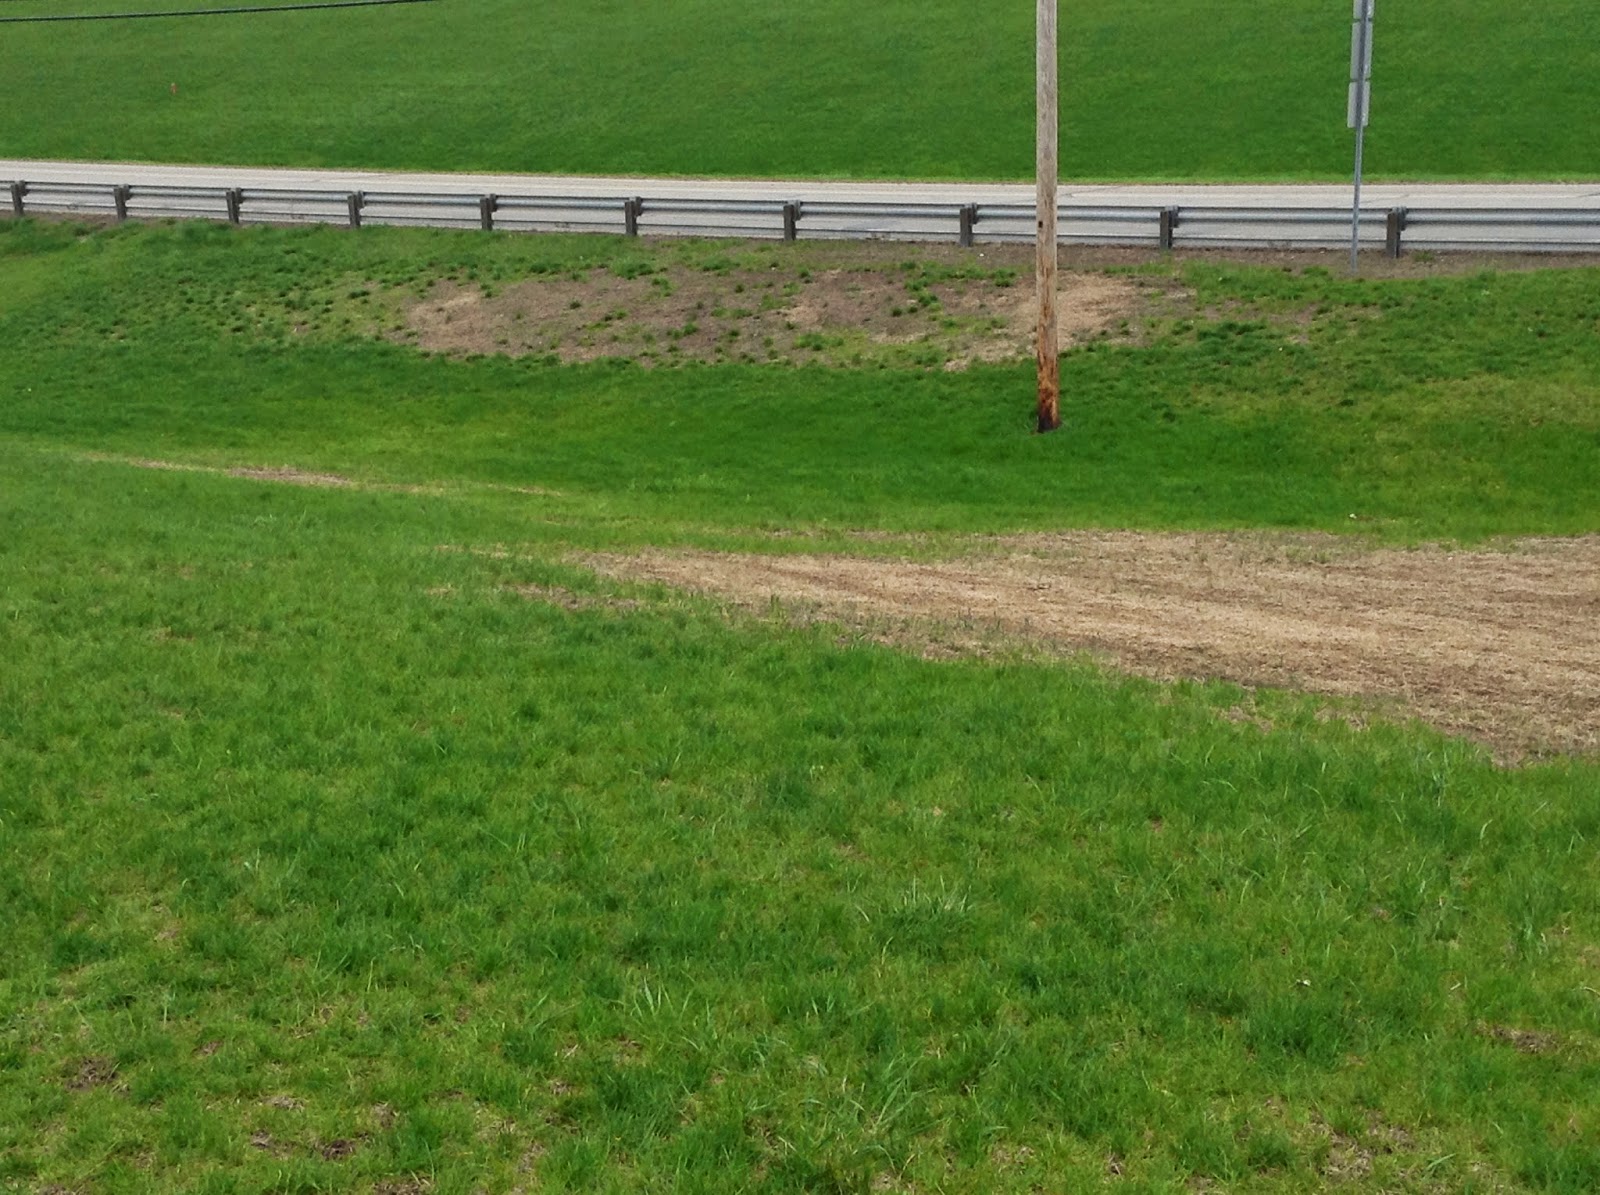 Figure 2. Low maintenance turf area showing patchy damage from European chafer.
Spring grub control can be difficult to achieve and the only realistic chemical options are trichlorfon or carbaryl. Even then, repeated application may be necessary and damage is not likely to be reversed at this late time. A more proactive approach aimed at preventing infestation this summer is more likely to provide a reasonable solution. Recommended products and application timings for white grub control can be found here: http://extension.entm.purdue.edu/publications/E-259.pdf. European chafers may also cause damage to a variety of field, forage and grain crops (see Figure 3).
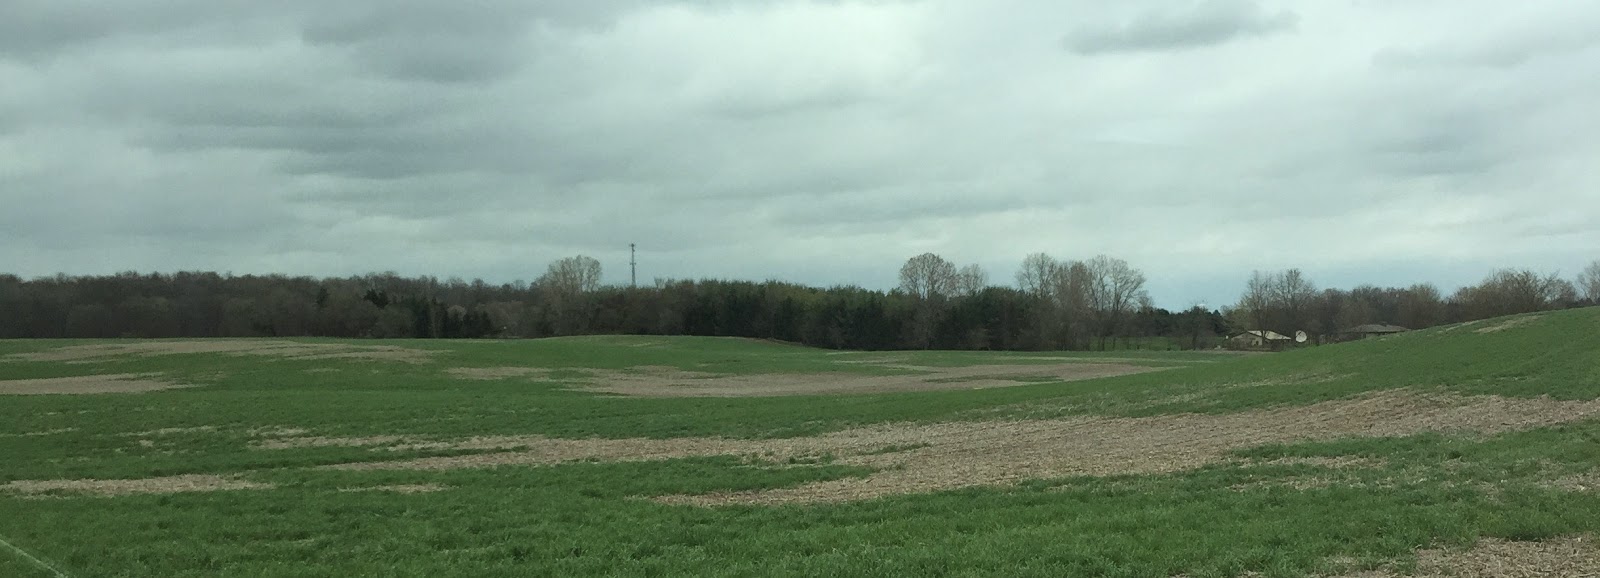 Figure 3. Extensive, but patchy damage to winter wheat caused by European chafer grubs.
If you notice grub damage this time of year, take a closer look and try to find the larvae in the soil. European chafer larvae can easily be identified using a 10X hand lens to inspect the raster pattern (Figure 4). Once established these insects may require some special attention going forward as they tend to be more damaging and somewhat less vulnerable to traditional insecticide treatments. The best control is achieved using a preventive approach with applications of imidacloprid, thiamethoxam, clothianidin or chlorantraniliprole applied June through mid-July. Keep records of any European chafer infestation in order to identify areas to keep an eye on going forward.
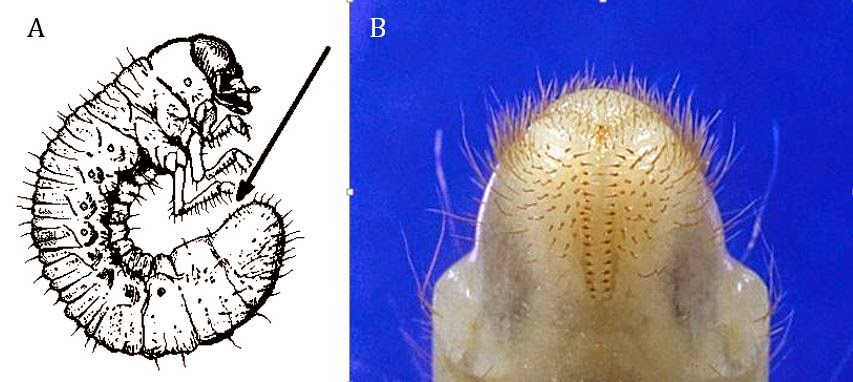 Figure 4. Location (A) and form (B) of the raster pattern in European chafer grubs.
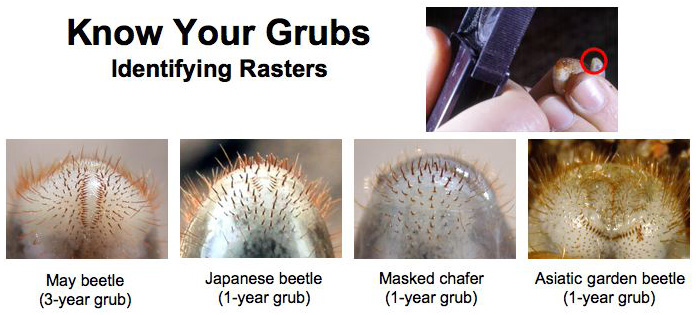 Figure 5. Common white grub rasters.
Email: drichmond@purdue.edu
Follow me on Twitter @doctorDRich
| County | Cooperator | BCW Trapped | |
|---|---|---|---|
| Week 1 4/16/15 - 4/22/15 |
Week 2 4/23/15 - 4/29/15 |
||
| Adams | Kaminsky/New Era Ag | 24* | 12 |
| Adams | Roe/Mercer Landmark | 40 | 6 |
| Allen | Anderson/Syngenta Seed | 17 | |
| Allen | Gynn/Southwind Farms | 3 | 1 |
| Allen | Kneubuhler/G&K Concepts | 8 | 7 |
| Bartholomew | Bush/Pioneer Hybrids | 0 | 0 |
| Boone | Campbell/Beck's Hybrids | 7 | 7 |
| Clay | Bower/Ceres Solutions, Brazil | 0 | 0 |
| Clay | Bower/Ceres Solutions, Bowling Green | 0 | 0 |
| Clinton | Emanuel/Boone Co. CES | 1 | 1 |
| Clinton | Foster/Purdue Entomology | 4 | 3 |
| DeKalb | Hoffman/ATA Solutions | 8 | 2 |
| Dubois | Eck/Purdue CES | 22* | 28* |
| Elkhart | Kauffman/Crop Tech Inc. | 29* | 25 |
| Fayette | Schelle/Falmouth Farm Supply Inc. | 29* | 4 |
| Fountain | Mroczkiewicz/Syngenta | 7 | 15* |
| Fulton | Jenkins/N. Central Coop-Rochester | 37* | 5 |
| Fulton | Jenkins/N. Central Coop-Kewana | 41* | 14* |
| Gibson | Schmitz/Gibson Co. CES | 3 | |
| Hamilton | Campbell/Beck's Hybrids | 27* | 9* |
| Hamilton | Truster/Reynolds Farm Equipment | 0 | 2 |
| Hendricks | Nicholson/Nicholson Consulting | 76* | 76* |
| Henry | Schelle/Falmouth Farm Supply Inc., Millville | 7 | 3 |
| Jasper | Overstreet/Purdue CES | 0 | 1 |
| Jasper | Ritter/Brodbeck Seeds | 24* | 8 |
| Jay | Boyer/Davis PAC | 14 | 5 |
| Jay | Shrack/Ran Del Agri Services | 3 | 0 |
| Jay | Temple/Jay County CES | 3 | 2 |
| Jennings | Bauerle/SEPAC | 12 | 6 |
| Knox | Bower/Ceres Solutions, Freelandville | 0 | 3 |
| Knox | Bower/Ceres Solutions, Vincennes | 3 | 13* |
| Knox | Bower/Ceres Solutions, Fritchton | 0 | 0 |
| Lake | Kleine/Kleine Farms | 6 | 12 |
| Lake | Moyer/Dekalb Hybrids, Shelby | 10 | 1 |
| Lake | Moyer/Dekalb Hybrids, Schneider | 20 | 6 |
| LaPorte | Barry/Kingsbury Elevator | 6 | 2 |
| LaPorte | Rocke/Agri-Mgmt Solutions, Wanatah | 0 | 1 |
| LaPorte | Rocke/Agri-Mgmt Solutions, LaCrosse | 0 | 1 |
| Miami | Early/Pioneer Hybrids | 2 | 1 |
| Miami | Myers/Myers Ag Service | ||
| Montgomery | Stine/Nicholson Sonsulting | 2 | 0 |
| Newton | Moyer/Dekalb Hybrids | 9 | 0 |
| Porter | Leuck/PPAC | 17 | 1 |
| Putnam | Nicholson/Nicholson Consulting | 2 | 2 |
| Randolph | Boyer/DPAC | 5 | 2 |
| Rush | Schelle/Falmouth Farm Supply Inc. | 0 | 1 |
| Shelby | Simpson/Simpson Farms | 6 | 8 |
| Sullivan | Bower/Ceres Solutions, Farmersburg | 8 | 10 |
| Sullivan | Bower/Ceres Solutions, Sullivan E | 16* | 40* |
| Sullivan | Bower/Ceres Solutions, Sullivan W | 8 | 8 |
| Tippecanoe | Bower/Ceres Solutions | 15* | 15* |
| Tippecanoe | Nagel/Ceres Solutions | 37* | 14 |
| Tippecanoe | Obermeyer/Purdue Entomology | 10 | 31* |
| Tippecanoe | Westerfeld/Monsanto | 9 | 20 |
| Whitley | Walker/NEPAC | 100* | 57* |
* = Intensive Capture...this occurs when 9 or more moths are caught over a 2-night period
| County/Cooperator | Wk 1 | Wk 2 | Wk 3 | Wk 4 | Wk 5 | Wk 6 | Wk 7 | Wk 8 | Wk 9 | Wk 10 | Wk 11 | Wk 12 |
|---|---|---|---|---|---|---|---|---|---|---|---|---|
| Dubois/SIPAC Ag Center | 0 | 0 | 1 | 0 | ||||||||
| Jay/Davis Ag Center | 0 | 0 | 2 | 0 | ||||||||
| Jennings/SEPAC Ag Center | 0 | 0 | 0 | 0 | ||||||||
| Knox/SWPAC Ag Center | 0 | 0 | 0 | |||||||||
| LaPorte/Pinney Ag Center | 0 | 0 | 3 | 0 | ||||||||
| Lawrence/Feldun Ag Center | 0 | 2 | 0 | 1 | ||||||||
| Randolph/Davis Ag Center | 0 | 0 | 0 | 0 | ||||||||
| Tippecanoe/Meigs | 0 | 0 | 1 | 0 | ||||||||
| Whitley/NEPAC Ag Center | 0 | 1 | 5 | 2 |
Wk 1 = 4/2/15 - 4/8/15; Wk 2 = 4/9/15 - 4/15/15; Wk 3 - 4/16/15 - 4/22/15; Wk 4 - 4/23/15-4/29/15
The number of 30-, 40-, and 60-ft wide (or larger) field crop planters across the U.S. Midwest is greater today than, say, twenty years ago. Certainly, individual farmers can plant more acres of corn and soybean per day with today's large field equipment than twenty years ago. This fact encourages optimism that delayed starts to the planting season can be overcome by the ability of today's modern planters to plant a greater percent of the state's crop per week when "push comes to shove."
As is often the case with "logical conclusions", the historical data do not necessarily support the logic. Historical planting progress data suggest that the maximum number of acres of corn and soybean planted per week has not changed much in 20 years. The accompanying figures illustrate the number of acres and percent of total acres planted during the respective weeks of maximum planting progress for corn (Fig. 1), soybean (Fig. 2), and the two crops combined (Fig. 3) for Indiana during the past twenty years.
The most corn acres planted per week in Indiana during the past twenty years occurred in 2001 when 2.9 MILLION acres or 50% of the total acreage for that year were planted in a single week (Fig. 1). To most of us, such a planting pace borders on phenomenonal. The closest we have come to matching that progress was during the 2014 planting season, when 41% of the total crop or 2.4 million acres were planting during a single week.
The most soybean acres planted in a single week in Indiana during the past twenty years also occurred in 2001 when 2.4 million acres or 42% of the total acreage for that year were planted in a single week (Fig. 2). The closest we have come since to matching that progress was during the 2007 planting season, when 33% of the total crop or 1.6 million acres were planting during a single week.
Looking at the historical planting progress of each crop individually (Fig's 1 and 2) suggests that little improvement has been made in our ability to plant a lot of crop acres quickly. Some have countered that the potential TOTAL number of combined crop acres planted per week has increased because farmers are increasingly planting soybean at the same time as they are planting corn, when historically soybean planting occurred near the end of corn planting. Well, that turns out not to be true either.
During the past twenty years in Indiana, the greatest number of corn AND soybean acres planted in a single week was also 2001 (no surprise), when 5.25 million acres of the two crops were planted in a single week, or 46% of the total number of corn and soybean acres planted that year (Fig. 3). During the past 20 years, the historical planting progress data show little evidence that the combined planting progress of the two crops has changed to any appreciable degree.
So, given the realities of ever larger planting equipment and the fact that farmers are frequently planting both crops at the same time these days, the conundrum is this... Why has the actual weekly planting progress of the two crops not increased in 20 years? The answer does not appear to be related to changes in total crop acres planted in Indiana because that number has remained fairly constant in recent history (Fig. 4).
One answer to the large planter vs. planting progress conundrum may be the fact that the number of corn/soybean growers in Indiana has decreased over time and those remaining are farming more acres than they did twenty years ago. Even though farm machinery is larger today and cover more acres per day than twenty years ago, fewer farmers are farming more acres and so total planting progress in terms of percent of total acres per week remains fairly unchanged. Coupled with that thought is the reality that weather and soil conditions dictate the number of days available during any given week for field work and planting.
For what it's worth, that's my opinion and you are entitled to it.
Related reading
Nielsen, RL (Bob). 2013. The Planting Date Conundrum for Corn. Corny News Network, Purdue Univ. online at http://www.kingcorn.org/news/timeless/PltDateCornYld.html [URL accessed April 2015]. USDA-NASS. 2013. Quick Stats. USDA Nat'l Ag. Statistics Service. online at http://www.nass.usda.gov/Quick_Stats [URL accessed April 2015].
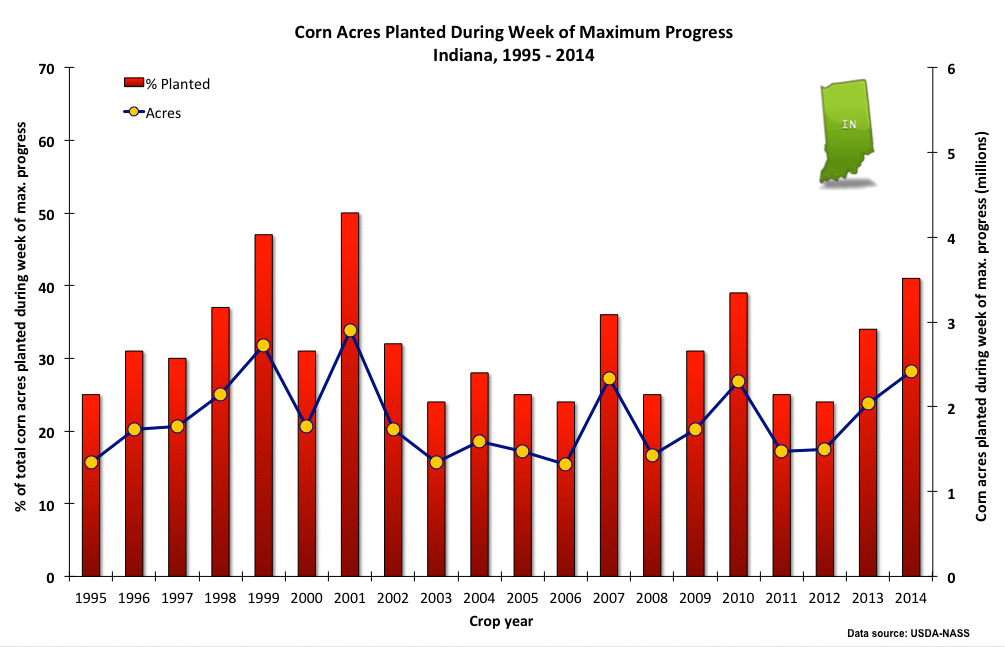 Figure 1. Acres (actual and percent of total) of field corn planted during the week of maximum planting progress in Indiana, 1995-2014. Data source: USDA-NASS. Note that the exact weeks of maximum sooybean planting progress may not be the same weeks as those of maximum corn planting.
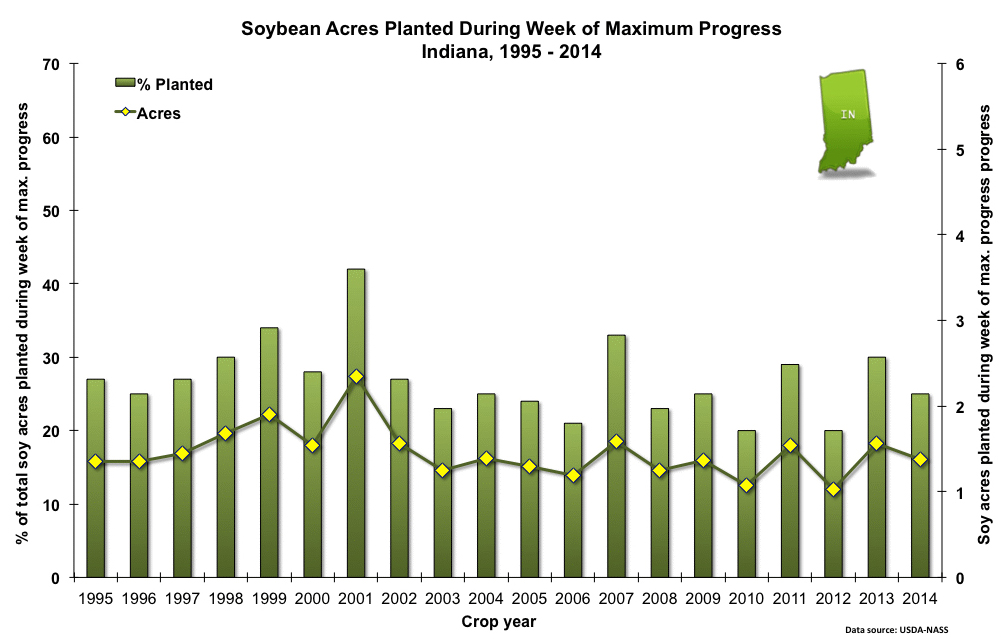 Figure 2. Acres (actual and percent of total) of soybean planted during the week of maximum planting progress in Indiana, 1995-2014. Data source: USDA-NASS. Note that the exact weeks of maximum soybean planting progress may not be the same weeks as those of maximum corn planting progress.
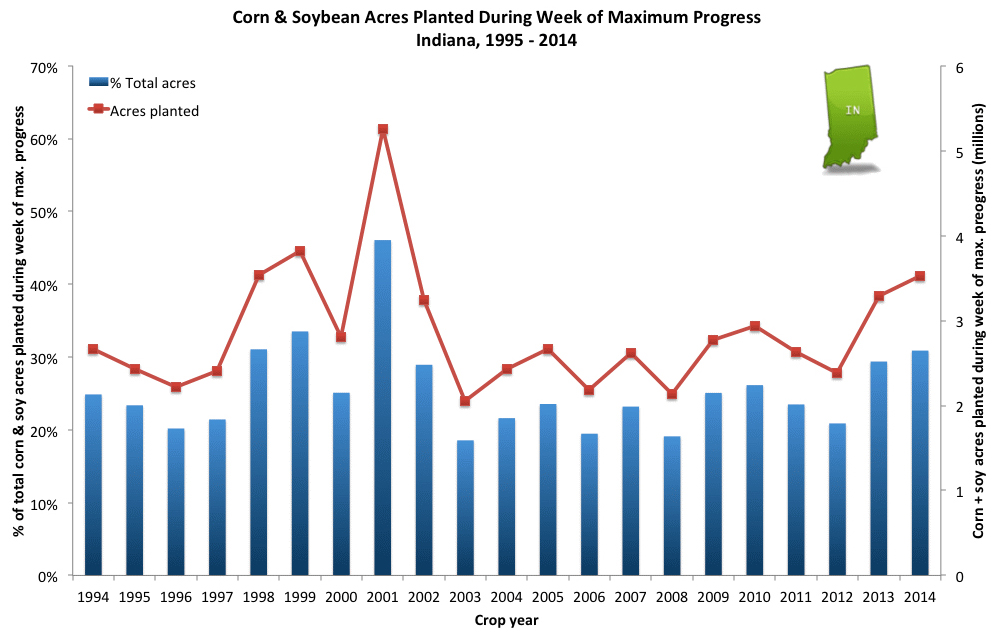 Figure 3. Acres (actual and percent of total) of field corn plus soybean planted during the week of maximum planting progress (both crops total) in Indiana, 1995-2014. Data source: USDA-NASS. Note that the exact weeks of maximum single crop progress may differ from the weeks of maximum two-crop progress.
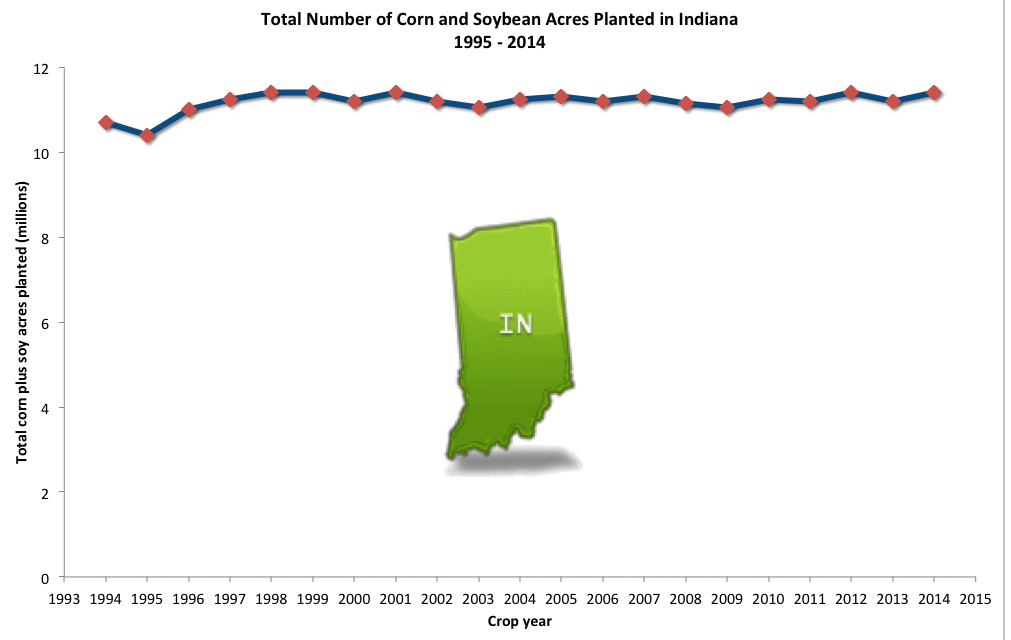 Figure 4. Combined number of acres planted to corn and soybean in Indiana, 1995-2014. Data source: USDA-NASS.

Purdue Cooperative Extension Service
Purdue Extension Entomology
901 W. State Street
West Lafayette, IN, 47907
(765) 494-8761
luck@purdue.edu
@PurdueExtEnt
PurdueEntomology
![]()
If you would like to be alerted by e-mail when the current issue of the Pest&Crop is available on-line, please enter your e-mail address and click the submit button.
It is the policy of the Purdue University Cooperative Extension Service that all persons have equal opportunity and access to its educational programs, services, activities, and facilities without regard to race, religion, color, sex, age, national origin or ancestry, marital status, parental status, sexual orientation, disability or status as a veteran. Purdue University is an Affirmative Action institution. This material may be available in alternative formats.