
USDA-NIFA Extension IPM Grant
Pest & Crop Newsletter, Entomology Extension, Purdue University
- Insects, the Least of Corn and Soybean Crop Concerns
- 2014 Corn Earworm Trap Report
- Western Bean Cutworm Adult Pheromone Trap Report
Insects, the Least of Corn and Soybean Crop Concerns - (John Obermeyer)
From the windshields I have looked out, the field crops look just as good as most are saying. Some areas a little dry, some foliar diseases, and still lingering weed challenges…but insects have not had much of an impact on limiting crop yields. Ground truthing (i.e., scouting) reveals much the same.
Western bean cutworm moth catches have really dropped off the last week, see “Western Bean Cutworm Adult Pheromone Trap Report.” This indicates that egg laying will also decline, good news for those managing high-risk corn fields in northern Indiana. Too, some low numbers of soybean aphid being reported. Where seen, there has been an abundance of beneficial insects doing their part to keep them at sub-economic levels. Though activity is picking up in the northern states, indicating that mass movement to Indiana in the near future is possible. A glimmer of excitement!
It was delightful to visit a pollinating sweet corn field this week and see a few western corn rootworm beetles on the silks. I almost took a picture for a trip down memory lane.
Was it the polar vortexes, or the cool and wet spring, solar flares, or global climate change? Whatever the reason(s), Indiana producers should be glad for it.
Happy Scouting!
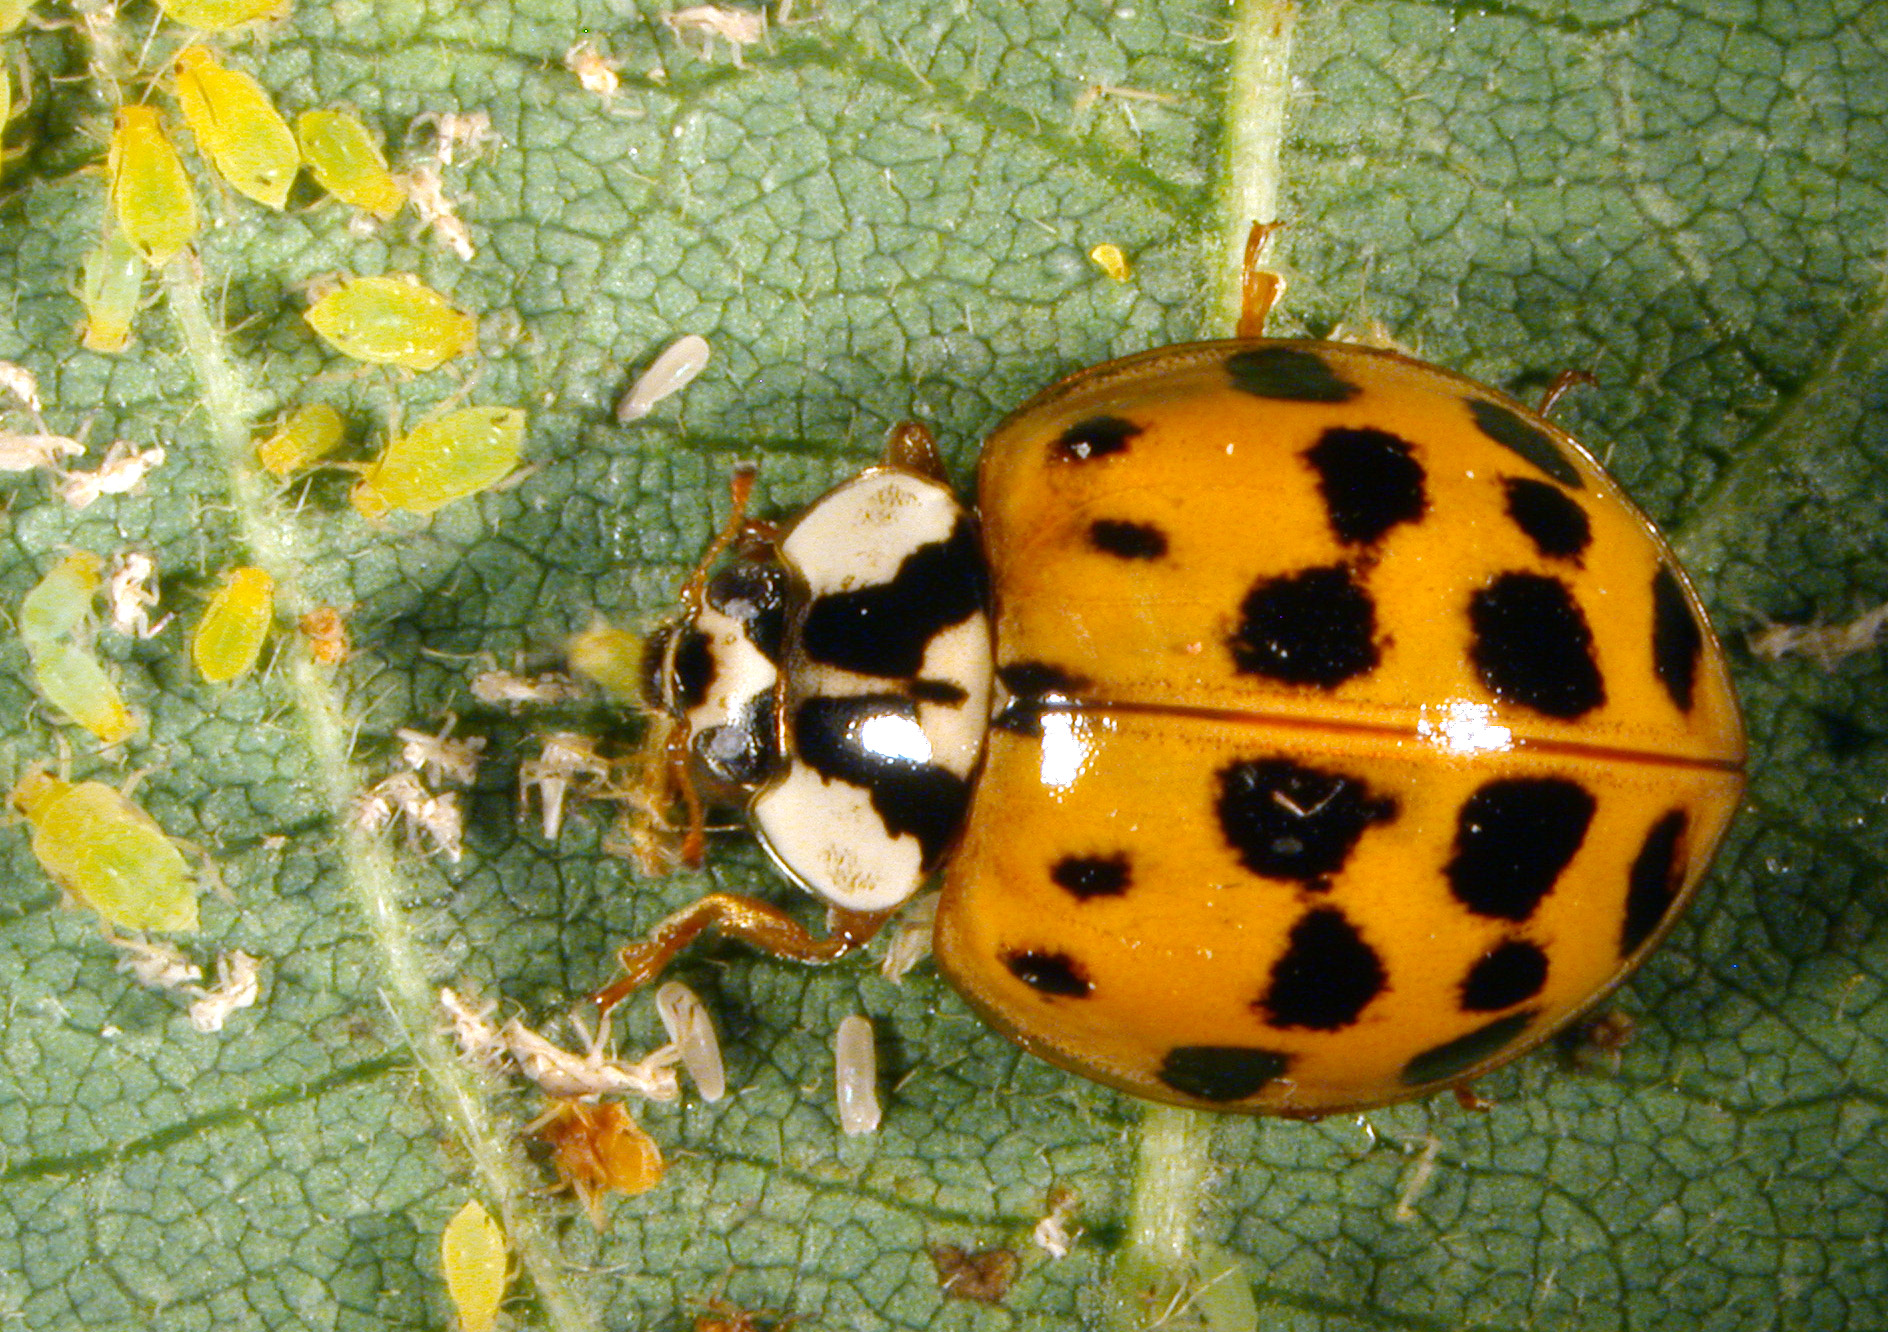
Asian lady beetle feeding on soybean aphids
![]()
Click here to see the 2014 Corn Earworm Trap Report
![]()
Western Bean Cutworm Adult Pheromone Trap Report
![]()
Grain Fill Stages in Corn – (Bob Nielsen) -
The grain fill period begins with successful pollination and initiation of kernel development, and ends approximately 60 days later when the kernels are physiologically mature. During grain fill, the developing kernels will be the primary sink for concurrent photosynthate produced by the corn plant. What this means is that the photosynthate demands of the developing kernels will take precedence over that of much of the rest of the plant. In essence, the plant will do all it can to “pump” dry matter into the kernels, sometimes at the expense of the health and maintenance of other plant parts including the roots and lower stalk.
A stress-free grain fill period can maximize the yield potential of a crop, while severe stress during grain fill can cause kernel abortion or lightweight grain and encourage the development of stalk rot. The health of the upper leaf canopy is particularly important for achieving maximum grain filling capacity.
Kernel development proceeds through several relatively distinct stages that were originally described by Hanway (1971) and most recently by Abendroth et. al., (2011). As with leaf staging protocols, the kernel growth stage for an entire field is defined when at least 50% of the plants in a field have reached that stage.
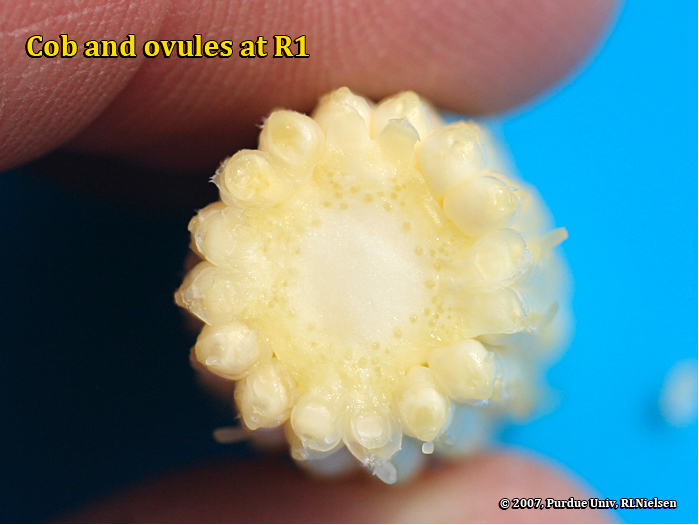
Silking Stage (Growth Stage R1)
Some may argue whether silking should be labeled as a kernel growth stage, but nonetheless silk emergence is technically the first recognized stage of the reproductive period. Every ovule (potential kernel) on the ear develops its own silk (the functional stigma of the female flower). Silks begin to elongate soon after the V12 leaf stage (12 leaves with visible leaf collars), beginning with the ovules nearer the base of the cob and then sequentially up the cob, with the tip ovules silking last. Consequently, the silks from the base half of the ear are typically the first to emerge from the husk leaves. Turgor pressure “fuels” the elongation of the silks and so severe drought stress usually results in delayed silk elongation and emergence from the husk leaves. Silks elongate about 1.5 inches per day during the first few days after they emerge from the husk leaves. Silks continue to elongate until pollen grains are captured and germinate or until they simply deteriorate with age.
Silks remain receptive to pollen grain germination up to 10 days after silk emergence (Nielsen, 2010a), but deteriorate quickly after about the first 5 days of emergence. Natural senescence of silk tissue over time results in collapsed tissue that restricts continued growth of the pollen tube. Silk emergence usually occurs in close synchrony with pollen shed (Nielsen, 2010b), so that duration of silk receptivity is normally not a concern. Failure of silks to emerge in the first place (for example, in response to silkballing or severe drought stress) does not bode well for successful pollination.
Pollen grains “captured” by silks quickly germinate and develop pollen tubes that penetrate the silk tissue and elongate to the ovule within about 24 hours. The pollen tubes contain the male gametes that eventually fertilize the ovules. Within about 24 hours or so after successfully fertilizing an ovule, the attached silk deteriorates at the base, collapses, and drops away. This fact can be used to determine fertilization success before visible kernel development occurs (Nielsen, 2012).
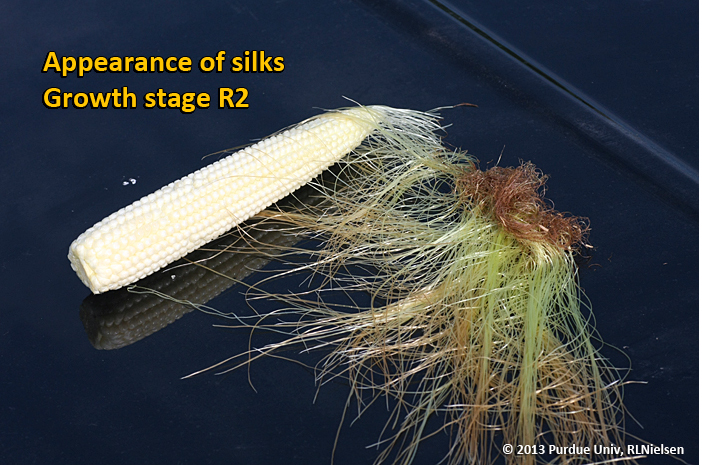
Kernel Blister Stage (Growth Stage R2)
About 10 to 14 days after silking, the developing kernels are whitish “blisters” on the cob and contain abundant clear fluid. The ear silks are mostly brown and drying rapidly. Some starch is beginning to accumulate in the endosperm. The radicle root, coleoptile, and first embryonic leaf have formed in the embryo by the blister stage. Severe stress can easily abort kernels at pre-blister and blister stages. Kernel moisture content is approximately 85 percent. For late April to early May plantings in Indiana, the thermal time from blister stage to physiological maturity is approximately 960 GDDs (Brown, 1999).

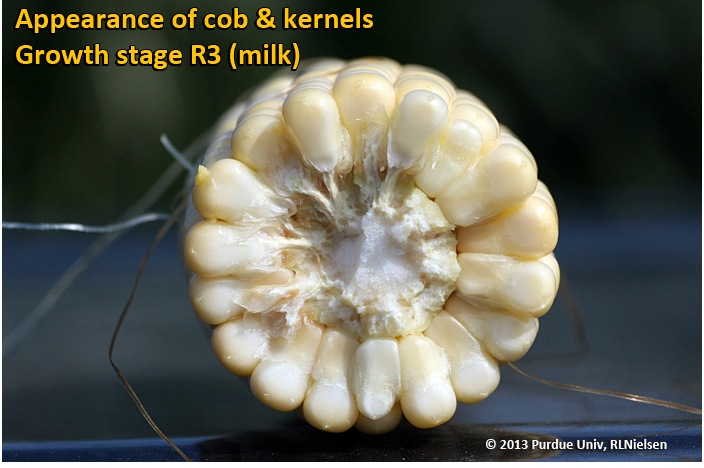
About 18 to 22 days after silking, the kernels are mostly yellow and contain “milky” white fluid. The milk stage of development is the infamous “roasting ear” stage, that stage where you will find die-hard corn aficionados standing out in their field nibbling on these delectable morsels. Starch continues to accumulate in the endosperm. Endosperm cell division is nearly complete and continued growth is mostly due to cell expansion and starch accumulation. Severe stress can still abort kernels, although not as easily as at the blister stage. Kernel moisture content is approximately 80 percent. For late April to early May plantings in Indiana, the thermal time from milk stage to physiological maturity is approximately 880 GDDs (Brown, 1999).


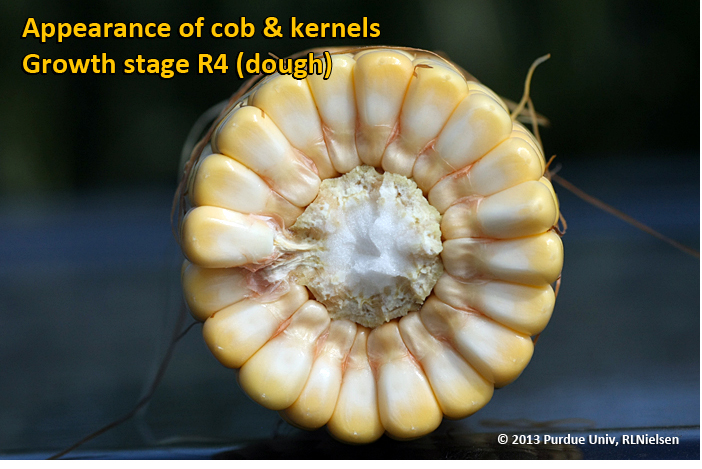
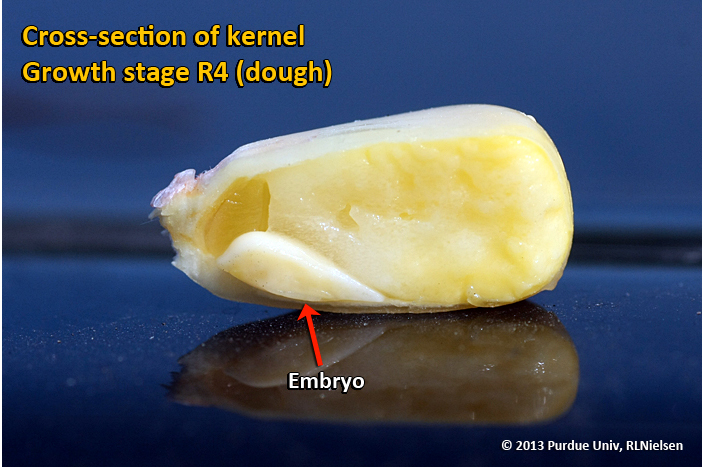
About 24 to 28 days after silking, the kernel’s milky inner fluid is changing to a “doughy” consistency as starch accumulation continues in the endosperm. The shelled cob is now light red or pink. By dough stage, four embryonic leaves have formed and the kernels have reached about 50 percent of their mature dry weight. Kernel moisture content is approximately 70 percent by R4. Kernel abortion is much less likely to occur once kernels have reached early dough stage, but severe stress can continue to affect eventual yield by reducing kernel weight. For late April to early May plantings in Indiana, the thermal time from dough stage to physiological maturity is approximately 670 GDDs (Brown, 1999).

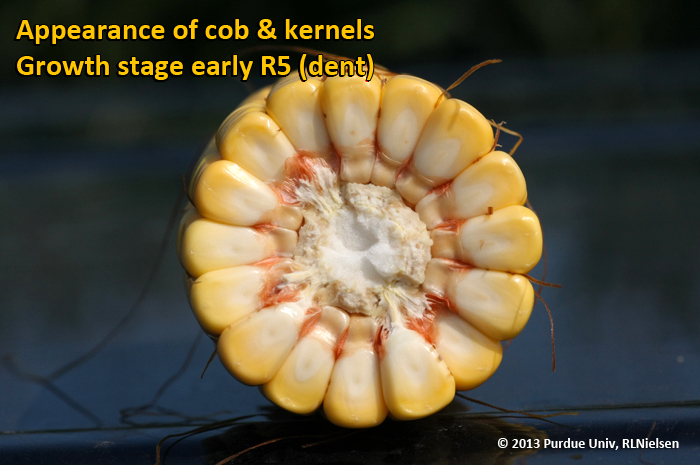
Kernel Dent Stage (R5)
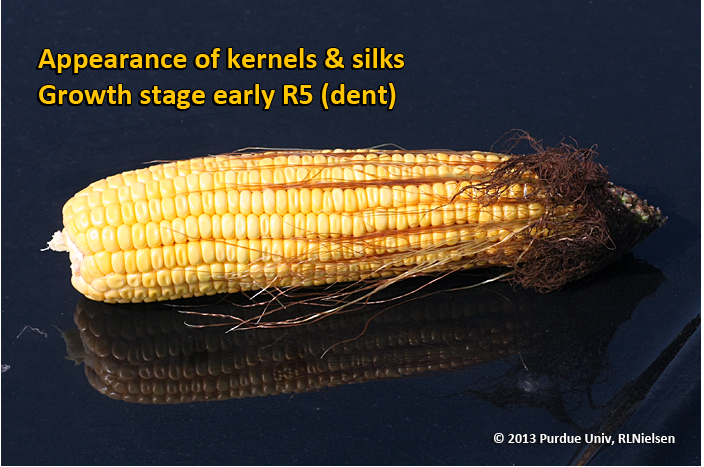
About 35 to 42 days after silking, all or nearly all of the kernels are denting near their crowns. The fifth (and last) embryonic leaf and lateral seminal roots form just prior to the dent stage. Kernel moisture content at the beginning of the dent stage is approximately 55 percent.
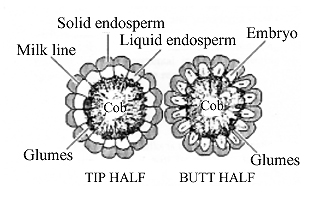
A distinct horizontal line appears near the dent end of the kernel and slowly progresses to the tip end of the kernel over the next 3 weeks or so. This line is called the “milk line” and marks the boundary between the liquid (milky) and solid (starchy) areas of the maturing kernels.
For late April to early May plantings in Indiana, the thermal time from full dent (kernel milk line barely visible) to physiological maturity is approximately 350 GDDs (Brown, 1999). Thermal time from the half-milkline stage to physiological maturity for similar planting dates is approximately 280 GDDs. One of the consequences of delayed planting is that thermal time from the dent stage to physiological maturity is shortened, though this may simply reflect a premature maturation of the grain caused by the cumulative effects of shorter daylengths and cooler days in early fall or by outright death of the plants by a killing fall freeze.
Severe stress can continue to limit kernel dry weight accumulation between the dent stage and physiological maturity. Estimated yield loss due to total plant death at full dent is about 40%, while total plant death at half-milkline would decrease yield by about 12% (Carter & Hesterman, 1990).

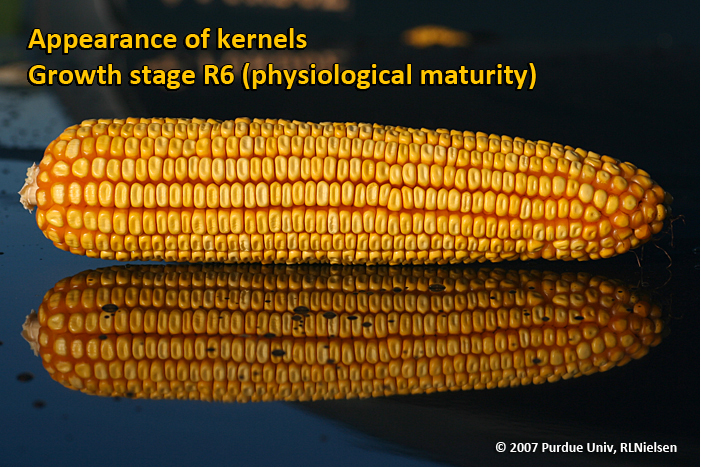
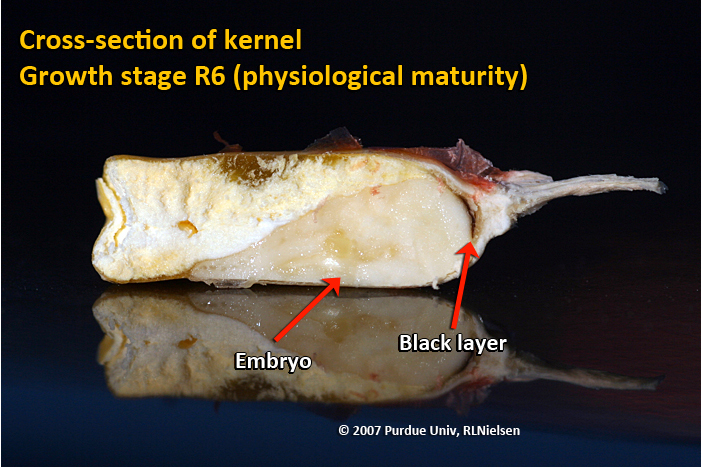
About 55 to 65 days after silking, kernel dry weight usually reaches its maximum and kernels are said to be physiologically mature and safe from frost. Physiological maturity occurs shortly after the kernel milk line disappears and just before the kernel black layer forms at the tip of the kernels. Severe stress after physiological maturity has little effect on grain yield, unless the integrity of the stalk or ear is compromised (e.g., damage from European corn borer or stalk rots). Kernel moisture content at physiological maturity averages 30 percent, but can vary from 25 to 40 percent grain moisture.

Harvest Maturity
While not strictly a stage of grain development, harvest maturity is often defined as that grain moisture content where harvest can occur with minimal kernel damage and mechanical harvest loss. Harvest maturity is usually considered to be near 25 percent grain moisture.
Related References
Abendroth, Lori J., Roger W. Elmore , Matthew J. Boyer , & Stephanie K. Marlay. 2011. Corn Growth and Development. Iowa State Univ. Extension publication PMR1009. Purchase online at <https://store.extension.iastate.edu/ItemDetail.aspx?ProductID=6065>. [URL accessed Aug 2013].
Brown, Greg A. 1999. Influence of Delayed Planting on Growing Degree Day Requirements of Corn (Zea mays L.) Hybrids During Grain Fill and Maturation. M.S. Thesis, Purdue University.
Carter, P.R. and O.B. Hesterman. 1990. Handling Corn Damaged by Autumn Frost (NCH-57). Purdue Extension. Online at <http://www.ces.purdue.edu/extmedia/NCH/NCH-57.html>. (URL accessed Aug 2013).
Hanway, John J. 1971. How a Corn Plant Develops. Iowa State Univ. Sp. Rpt. No. 48. [out of print]
Nielsen, R.L. (Bob). 2010a. Silk Emergence. Corny News Network, Purdue Univ. Online at <http://www.kingcorn.org/news/timeless/Silks.html>. (URL accessed Aug 2013).
Nielsen, R.L. (Bob). 2010b. Tassel Emergence & Pollen Shed. Corny News Network, Purdue Univ. Online at <http://www.kingcorn.org/news/timeless/Tassels.html>. (URL accessed Aug 2013).
Nielsen, R.L. (Bob). 2011a. Effects of Stress During Grain Filling in Corn. Corny News Network,
Purdue Univ. Online at <http://www.kingcorn.org/news/timeless/GrainFillStress.html>. (URL accessed Aug 2013).
Nielsen, R.L. (Bob). 2011b. Kernel Set Scuttlebutt. Corny News Network, Purdue Univ. Online at <http://www.kingcorn.org/news/timeless/KernelSet.html>. (URL accessed Aug 2013).
Nielsen, R.L. (Bob). 2012. A fast and accurate pregnancy test for corn. Corny News Network, Purdue Univ. Online at <http://www.kingcorn.org/news/timeless/EarShake.html>. [URL accessed Aug 2013].
![]()
Estimating Corn Grain Yield Prior to Harvest – (Bob Nielsen) –
Fancy colored yield maps are fine for verifying grain yields at the end of the harvest season, but bragging rights for the highest corn yields are established earlier than that down at the Main Street Cafe, on the corner of 5th and Earl. Some patrons of the cafe begin “eyeballing” their yields as soon as their crops reach “roasting ear” stage. Some of the guys there are pretty good (or just plain lucky) at estimating yields prior to harvest, while the estimates by others are not even close to being within the proverbial ballpark. Interestingly, they all use the same procedure referred to as the Yield Component Method.
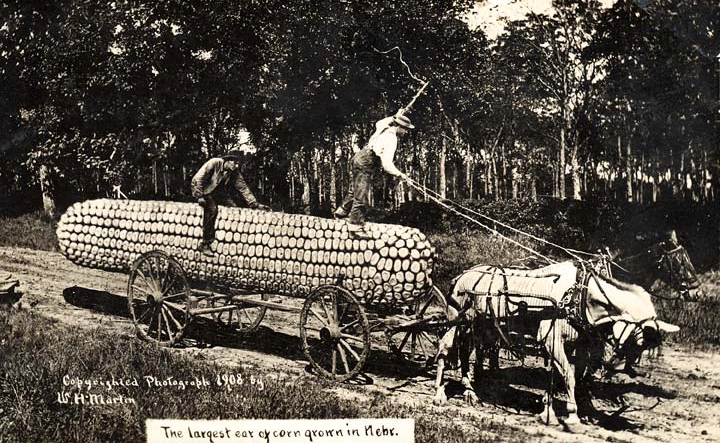
Largest ear of corn in Nebraska, ca. 1908. Courtesy of the Nebr.
Historical Society.
Yield Component Method
Other pre-harvest yield prediction methods exist (Lauer, 2002; Lee & Herbek, 2005; Thomison, 2013), but the Yield Component Method is probably the most popular because it can be used well ahead of harvest; as early as the so-called “roasting ear” or milk (R3) stage of kernel development. Under “normal” conditions, the kernel milk stage occurs about 18 to 22 days after pollination is complete (Nielsen, 2013). Estimates made earlier in the kernel development period risk being overly optimistic if subsequent severe stresses cause unforeseen kernel abortion (Nielsen, 2013).
The Yield Component Method was originally described by the University of Illinois many years ago and is based on the premise that one can estimate grain yield from estimates of the yield components that constitute grain yield. These yield components include number of ears per acre, number of kernel rows per ear, number of kernels per row, and weight per kernel. The first three yield components (ear number, kernel rows, kernels/row) are easily measured in the field.
Final weight per kernel obviously cannot be measured until the grain is mature (kernel black layer) and, realistically, at harvest moisture. Consequently, an average value for kernel weight, expressed as 80,000 kernels per 56 lb bushel, is used as a proverbial “fudge factor” in the yield estimation equation. The equation originally used a “fudge factor” of 90, but kernel size has increased as hybrids have improved over the years. Consequently, a “fudge factor” of 75 to 85 is a more realistic value to use today.
Crop uniformity greatly influences the accuracy of any yield estimation technique. The less uniform the field, the greater the number of samples that should be taken to estimate yield for the field. There is a fine line between fairly sampling disparate areas of the field and sampling randomly within a field so as not to unfairly bias the yield estimates up or down.
1. At each estimation site, measure off a length of row equal to 1/1000th acre. For 30-inch (2.5 feet) rows, this equals 17.4 feet.
TIP:
For other row spacings, divide 43,560 by the row spacing (in feet) and then divide that result by 1000 (e.g., [43,560/2.5]/1000 = 17.4 ft).
2. Count and record the number of ears on the plants in the 1/1000th acre of row that you deem to be harvestable.
TIP:
Do not count dropped ears or those on severely lodged plants unless you are confident that the combine header will be able to retrieve them.
3. For every fifth ear in the sample row, record the number of complete kernel rows per ear and average number of kernels per row. Then multiply each ear’s row number by its number of kernels per row to calculate the total number of kernels for each ear.
TIPS:
Do not sample nubbins or obviously odd ears, unless they fairly represent the sample area. If row number changes from butt to tip (e.g., pinched ears due to stress), estimate an average row number for the ear. Don’t count the extreme butt or tip kernels, but rather begin and end where you perceive there are complete “rings” of kernels around the cob. Do not count aborted kernels. If kernel numbers are uneven among the rows of an ear, estimate an average value for kernel number per row.
4.Calculate the average number of kernels per ear by summing the values for all the sampled ears and dividing by the number of ears.
EXAMPLE:
For five sample ears with 480, 500, 450, 600, and 525 kernels per ear, the average number of kernels per ear would be (480 + 500 + 450 + 600 + 525) divided by 5 = 511.
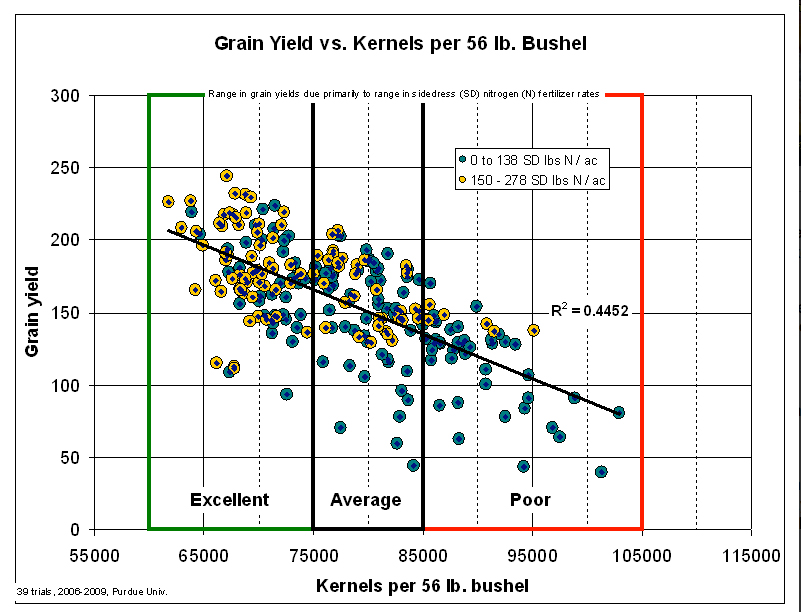
5. Estimate the yield for each site by multiplying the ear number (Step 2) by the average number of kernels per ear (Step 4) and then dividing that result by the number below that best represents the kernel set and grain fill conditions this year for the field whose yield you are estimating. The values below represent the range in numbers of kernels (thousands) in a 56# market bushel that correlate to growing conditions during grain fill and subsequent yield. See first image below for an illustration of that relationship.
| Table 1. Range in kernel numbers per 56 lb. bu. relative to growing conditions during the grain fill period. | |
| Growing Conditions | Range in Kernel Number Per Bu. |
| (thousands) | |
| Excellent | less than 75 |
| Average | 75 to 85 |
| Poor | greater than 85 |
Example:
Let’s say you counted 30 harvestable ears at the first thousandth-acre sampling site. Let’s also assume that the average number of kernels per ear, based on sampling every 5th ear in the sampling row, was 511. Let’s also assume that growing conditions during grain fill were average. The estimated yield for that site would (30 x 511) divided by 80, which equals 192 bu./ac.
Repeat the procedure throughout field as many times as you deem to be representative. Calculate the average yield for all the sites to estimate the yield for the field.
Remember that this method for estimating pre-harvest grain yield in corn indeed provides only an estimate. Since kernel size and weight will vary depending on hybrid and environment, this yield estimator should only be used to determine “ballpark” grain yields. Yield can easily be overestimated in a year with poor grain fill conditions (e.g., low kernel size and weight from a drought year) and underestimated in a year with excellent grain fill conditions (e.g., larger kernel size and weight from non-stress grain fill periods).

Recognize that the Yield Component Method for estimating corn grain yield is probably only accurate within plus or minus 30 bushels of the actual yield. Obviously, the more ears you sample within a field, the more accurately you will “capture” the variability of yield throughout the field. Use the yield estimates obtained by this method for general planning purposes only.
The Pro Farmer Midwest Crop Tour Method
The Pro Farmer group of Farm Journal Media sponsors an annual Midwest Crop Tour that sends out teams of “scouts” to visit corn fields throughout the Midwest to estimate yields. The method used in that effort is a variation of one described years ago by University of Minnesota agronomist Dale Hicks (now Professor Emeritus) that combines the use of several yield components (ears per acre and kernel rows per ear) with a measurement of ear length (a proxy for kernel number per row).
The focus of the crop tour is not to necessarily estimate the yields of specific fields, but rather to more broadly estimate the yield potential within regions of the Midwest, so one probably should exercise caution in using this method for estimating yields within an individual field. Nevertheless, folks who have heard about the Pro Farmer Tour may be interested in trying the method themselves, so here are the steps involved with the Pro Farmer method (Flory, 2010). I would certainly suggest that these steps be repeated in several areas of an individual field because of natural spatial variability for yield.
1. Measure and record the row spacing (inches) used in the field.
Example:
30 inches
2. Walk through the end rows into the bulk of the field, then walk about 35 paces down the rows to the first sampling area.
Tip:
For subsequent yield estimates within the field, I would suggest walking even further into the field and crossing over multiple planter passes to sample different areas of the field.
3. Measure or step off 30 feet down the row, then count all ears in the two adjacent rows. Divide that number by two and record it.
Example:
(42 ears in one row + 45 ears in other row) divided by 2 = 43.5
4.Pull the 5th, 8th and 11th ears from plants in one row of the sampling area.
Tip:
Frankly, I would suggest harvesting up to 5 ears from each of the two adjacent rows to better sample the area and minimize the effect that one oddball ear could have on the calculated average ear lengths and kernel row numbers.
5. Measure length of the portion of each ear that successfully developed kernels. Calculate the average ear length of the three ears and record it.
Example:
(6 inches + 7 inches + 5 inches) divided by 3 = 6
6.Count the number of kernel rows on each ear. Calculate the average kernel row number and record it.
Example:
(16 rows + 14 rows + 16 rows) divided by 3 = 15.3
7. Grain yield for the sampling area is calculated by multiplying the average ear count by the average ear length by the average kernel row number, then dividing by the row spacing.
Example:
(43.5 ears x 6 inches x 15.3 rows) divided by 30-inch rows = 133 bu/ac yield estimate
Related Reading
Flory, Chip. 2010. Crop Tour Insider. Pro Farmer, Farm Journal Media. Online at <http://www.agweb.com/profarmer/article/crop_tour_insider>. [URL no longer active].
Lauer, Joe. 2002. Methods for Calculating Corn Yield. Agronomy Advice, Univ. of Wisconsin-Madison. Online at <http://corn.agronomy.wisc.edu/AA/pdfs/A033.pdf> [URL accessed Aug 2014].
Lee, Chad and Jim Herbek. 2005. Estimating Corn Yields (AGR-187). Univ. of Kentucky. Online at <http://www.ca.uky.edu/agc/pubs/agr/agr187/agr187.pdf>. [URL accessed Aug 2014].
Nielsen, R.L. (Bob). 2011. Kernel Set Scuttlebutt. Corny News Network, Purdue Univ. Online at <http://www.kingcorn.org/news/timeless/KernelSet.html>. [URL accessed Aug 2014].
Nielsen, RL (Bob). 2012. Opportunities to Assess Yield Potential of Drought-Stressed Corn. Corny News Network, Purdue Extension. Online at <http://www.kingcorn.org/news/articles.12/YldAssessment-0727.html>. [URL accessed Aug 2014].
Nielsen, R.L. (Bob). 2013. Effects of Stress During Grain Filling in Corn. Corny News Network,
Purdue Univ. Online at <http://www.kingcorn.org/news/timeless/GrainFillStress.html>. [URL accessed Aug 2014].
Nielsen, R.L. (Bob). 2013. Grain Fill Stages in Corn. Corny News Network, Purdue Univ. Online at <http://www.kingcorn.org/news/timeless/GrainFill.html>. [URL accessed Aug 2014].
Thomison, Peter. 2013. Estimating Corn Yields Prior to Harvest. C.O.R.N. Newsletter, Ohio State Univ. Online at <http://corn.osu.edu/newsletters/2013/c.o.r.n.-newsletter-2013-25/estimating-corn-yields-prior-to-harvest>. [URL accessed Aug 2014].
Vyn, Tony. 2010. Corn Grain Yield Estimation: The Kernel Weight Factor. Pest & Crop Newsletter, Purdue Extension. Online at <http://extension.entm.purdue.edu/pestcrop/2010/issue22/index.html>. [URL accessed Aug 2014].
![]()

![]()