
USDA-NIFA Extension IPM Grant
Pest & Crop Newsletter, Entomology Extension, Purdue University
Black Cutworm Moths Blowing Into Indiana - (Christian Krupke and John Obermeyer)
• Recent rains have brought black cutworms along for the ride
• Timing of scouting can be improved by tracking heat unit accumulations, combined with pheromone trap catches
• Scouting fields and treating when necessary is generally more reliable than preventative applications of insecticides.
• Don’t rely on insecticide-treated seed to prevent economic damage.
Most of our dutiful trapping cooperators throughout the state captured black cutworm moths this past week - refer to the “Black Cutworm Adult Pheromone Trap Report” for captures. This recent flush of moths is attributed to storms from the southwestern portions of the country.
Moth arrival, along with the use of heat units to predict the beginning of larval activity, gives us an indication of the potential severity of the problem and locations of concern. Thus, we are able to predict with some degree of accuracy when and where crop damage is most likely to occur based on this information. Refer to future issues of the Pest&Crop as we track heat unit accumulations and predicted damage in your area.
Here’s a question we are often asked: Should one treat for black cutworm before or at planting? Because of the sporadic outbreak nature of this pest, the tried, true, and economic approach to black cutworm management is to scout fields, determine infestation and damage levels, and use a rescue treatment, if needed. Foliar insecticides are effective, especially when applied early (i.e. while cutworms are small and not yet “cutting”). Producers using insecticide-treated seed may have a false sense of security concerning black cutworm control. The systemic activity of these insecticides during the seedling stage should help suppress small larvae feeding on plants. However, this protection is short-lived, Fields attracting egg-laying moths during multiple flights will likely experience significant damage and stand losses.
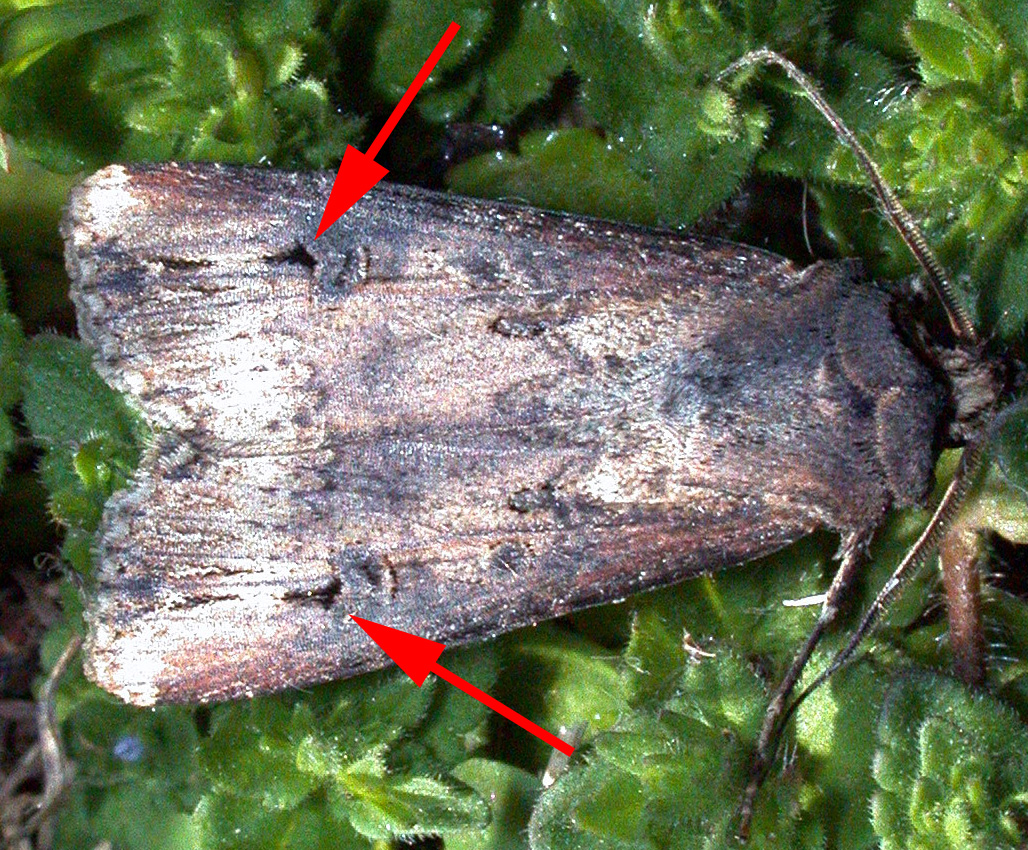
Black cutworm moth, "black dagger" markings
![]()
Click here to see the Black Cutworm Adult Pheromone Trap Report
![]()
Indiana has had enough warm, spring days for alfalfa growers to start seeing alfalfa weevil emerging in their fields. So producers should be scouting for the pest now instead of waiting to see obvious damage before doing anything about it, a Purdue Extension entomologist says.
The early season pest is active in both adult and larval forms in the spring, and heavy infestations can be destructive to the alfalfa crop.
In early spring, alfalfa weevil larvae hatch from eggs deposited in the plant stems and begin feeding within the folding leaves at the growing tips, Christian Krupke said. A heavy infestation of larvae can consume enough foliage that an entire field might take on a grayish appearance.
“When you can see the damage from the road and the field starts to look gray, you’ve missed the opportunity to treat the field with an insecticide,” he said.
Alfalfa larvae damage includes pinholes in the leaves, but as the larvae grow, they will start to chew larger holes that make plants look shredded. Adult feeding damage looks like small, circular cuts along leaf margins, but is minor and typically not a concern.
“Sampling a field to determine the extent of alfalfa weevil damage and average stage of weevil development is best accomplished by walking the field in an M-shaped pattern,” Krupke said. “Five alfalfa stems should be examined in each of five areas of a field for a total of 25 stems for the entire field.”
Krupke said each stem should be examined for:
• Evidence of feeding by alfalfa weevil larvae.
• Maturity of the stem, such as pre-bud, bud and flowers.
• Stem length.
• Average weevil larvae size.
“Although large larvae are relatively easy to find, small larvae are difficult to see,” he said. “Therefore, developing shoots showing pinhole feeding will have to be unfolded to find the small larvae.”
Depending on the severity of infestation, growers might want to treat their fields. A series of infestation thresholds can be used to determine if treatment is necessary and what types of treatments are best. Some infestations require immediate treatment with residual insecticides. Tables of heat units, thresholds and treatment recommendations, as well as more information about alfalfa weevil, are available at <http://extension.entm.purdue.edu/fieldcropsipm/insects/alfalfa-weevil.php>.
Another option would be to cut alfalfa a few days earlier than originally planned.
The good news for growers is that warm, humid, wet
weather encourages disease in alfalfa weevil populations, Krupke said.
“Humidity is detrimental to alfalfa weevil populations because it causes the spread of fungal pathogens,” he said. “Warm, wet weather causes natural ‘plagues’ in weevil populations and is a powerful natural control.”
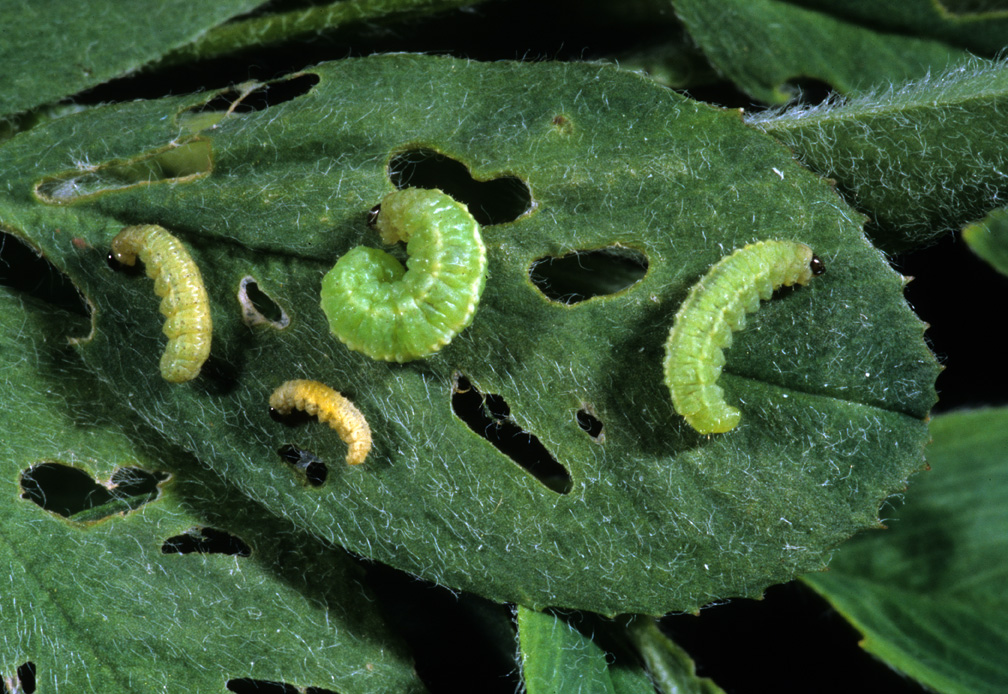
Alfalfa weevil larvae damage
![]()
Spring Burndown Applications To Weeds And Cover Crops – (Travis Legleiter and Bill Johnson) -
This spring so far has been cold and wet with short spurts of warm sunny days in-between. This weather cycle for the most part kept producers out of field and allowed the winter annual weeds to flourish the past couple of weeks. As we look ahead to the next couple of weeks in hope of getting out to the fields to do spring no-till burndown applications, there are a couple of things to keep in mind.
Winter annual weeds
The warm periods of weather, particularly the last two weeks, along with the ample soil moisture have been beneficial for winter annual weed growth and early emerging summer annuals. A few winter annual weeds that we have noticed are chickweed, purple deadnettle, and henbit that are for the most part already flowering in much of the state.
Producers will need to make winter annual burndown applications quickly, once conditions allow them to get into fields. These weeds, specifically chickweed, can create mats that slow soil drying and delay planting. Although these annuals may already be flowing and nearing the end of their life cycle a timely burndown application will speed up the desiccation processes for quicker soil drying and timely planting.
Marestail
This weed has no doubt been the biggest weed problem in Indiana the last couple of years and this spring is setting up to give it an advantage again. Any fall emerging marestail that survived the winter or was not controlled by a fall herbicide application has likely already begun to bolt and will be difficult to control if not treated soon. The spring emerging cohorts of marestail have likely started to emerge and will be very quickly gaining size if producers are kept out of fields by continued wet conditions.
Producers need to be aware of the size of marestail populations in fields and plan burndown treatments accordingly. The majority of marestail populations are glyphosate-resistant and must be controlled with other herbicides. Producers need to be aware of appropriate tank mixes and rates to control larger marestail populations that are glyphosate resistant.
For a more details of marestail control, specifically in no-till soybean, refer to our recently updated “Control of marestail in no-till soybean” publication <http://agcrops.osu.edu/specialists/weeds/marestail/marestailfact09_000.pdf>.
Cover Crops
The state of Indiana, according to personnel with NRCS, had an approx. 1 million acres of cover crops planted this last fall. Some of the cover crop species are designed to be winter killed, although several will need to be terminated prior to corn or soybean planting.
Producers who seeded cover crops need to be aware of the proper timing, herbicides, and rates for termination applications for each specific cover crop species. Many of the cover crops are relatively easily controlled with 0.75 lb ae/A of glyphosate in early spring prior to corn or soybean planting.
The one cover crop that poses a larger challenge is annual ryegrass. When allowed to grow extensively in the spring annual ryegrass can be very difficult to terminate with herbicides and can become a weed itself. Producers need to make applications prior to annual ryegrass reaching 6 inches to ensure a successful termination. Much like marestail, the combination of the warm spells and wet soils keeping producers out of the field can lead to annual ryegrass cover crops growing beyond manageable heights.
Regardless of the size of the annual ryegrass there are a couple of keys that producers need to keep in mind when making their termination applications. Glyphosate is the most commonly used herbicide to terminate annual ryegrass and must be applied at 1.5 lb ea/A (2 quarts of a 3lb ae/gal glyphosate product) to ensure complete termination. Application of glyphosate also need to be applied when the annual ryegrass in actively growing or during a period in which nighttime low temperatures are greater than 45°F.
It would also be a good idea to scout fields that have cover crops and see if marestail is present as well. If it is present do not rely just on glyphosate to terminate the cover crop. You will need to add sharpen, 2,4-D, or dicamba to glyphosate to control the marestail.
For more information on cover crop termination refer to our “Terminating Cover Crops: Successful Cover Crop Termination with Herbicides” publication <http://www.extension.purdue.edu/extmedia/ws/ws-50-w.pdf>.
Application
The increase in acres infested with glyphosate resistant weeds means many producers are making burndown applications with other herbicides and/or tank mixes. Some of the popular tank mixes contain contact herbicides like gramoxone and sharpen. When applying a contact herbicide, producers need to keep in mind that complete spray coverage is essential. To ensure complete coverage producers need to use carrier volumes of at least 15 to 20 gallons per acre (GPA). The use of proper adjuvants and spray nozzle tips as listed by the product label will also ensure optimal coverage and efficacy.
The slight delay in the planting season has likely given some of our winter annuals and early emerging summer annuals a head start this year, but with the proper herbicides, rates, and application methods producers will be able to get their no-till fields cleaned off and ready for a successful growing season.
![]()
The Planting Date Conundrum for Corn – (Bob Nielsen) -
• Early planting favors higher yields, but does not guarantee higher yields.
• Statewide averages for planting date and yield are not strongly related.
• Planting date is but one of many yield influencing factors.
Conventional wisdom says that the prime planting window to maximize corn yields in much of Indiana opens about April 20 and closes about May 10. This “window” typically opens about one week later across the northern tier of Indiana counties (later warmup) and about one week earlier across the southern tier of Indiana counties (earlier warmup).
Very little corn, if any, has been planted in Indiana yet this spring as of 14 April. By itself, this is not much cause for concern because typically only a very small percentage of acres are ever planted by this date in Indiana. However, the specter of delayed planting is clearly on the horizon because little other spring fieldwork has been completed due to the frequent and sometimes excessive rainfall in recent weeks. For some growers, tillage operations, herbicide applications, and nitrogen fertilizer applications must be completed first before they can consider planting their crops.
What are the consequences of a delayed start to planting? How important a predictor of statewide corn yield is planting date anyway? Does late planting in and of itself guarantee lower than normal yields? Good questions, but the effect of planting date on statewide average corn yield is not clearcut.
If one reviews USDA-NASS crop progress reports for the past 20 years (USDA-NASS, 2013), there is NOT a strong relationship between planting date and absolute yield on a statewide basis for Indiana. Specifically, departures from annual trend yields are not strongly related to corn planting progress. Figures 1 and 2 illustrate this relationship for two measures of planting progress; percent acres planted by April 30 or by May 15. Even though one can statistically define a mathematical relationship between departure from trend yield and planting progress by April 30 or May 15, the relationship only accounts for 22 to 24% of the variability in yield trend departures from year to year. In other words, a number of yield influencing factors (YIFs) in addition to planting date also affect the ultimate absolute yield for a given year.
Here’s the Conundrum
Why is it that every corn agronomist known to man preaches about the importance of timely planting and yet the statewide statistical data suggest that planting date accounts for only 23% of the variability in statewide yields from year to year? Let’s look more closely about this seeming conundrum.
It is true that corn grain yield potential declines with delayed planting after about May 1 (Myers & Wiebold, 2013, Nafziger, 2008; Nafziger, 2011). Estimated yield loss per day with delayed planting varies from about 0.3% per day early in May to about 1% per day by the end of May. Yield potential goes down with delayed planting because of a number of factors, including a shorter growing season, greater insect & disease pressure, and higher risk of hot, dry conditions during pollination.
However, the good news is that planting date is only one of many YIFs for corn. What is important to understand is that yield loss due to delayed planting is relative to the maximum possible yield in a given year. In other words, if all the other YIFs work together to determine that the maximum possible yield this year for the optimum planting date is 220 bu/ac, then the consequence of a 10-day planting delay beyond April 30 (at 0.3% decrease per day) would be a yield potential of about 213 bu/ac (i.e., 220 bushel potential minus [10 days x 0.3%] due to delayed planting). However, if all the other YIFs work together to determine that the maximum possible yield this year for the optimum planting date is only 150 bu/ac, then the consequence of a 10-day planting delay beyond May 1 (at 0.3% decrease per day) would be a yield potential of about 146 bu/ac (i.e., 150 bu/ac potential minus [10 days x 0.3%] due to delayed planting). Make sense?
Consequently, it is possible for early-planted corn in one year to yield more than, less than, or equal to later-planted corn in another year depending on the exact combination of YIFs for each year. Figure 3 illustrates this often confusing concept. In that graph, a delayed planting of corn (B) in an otherwise high yielding year may still be higher yielding than a crop planted on the optimum planting date (C) in an otherwise lower yielding year. Farmers know this to be true because some have had June-planted crops in recent years that ultimately yielded better than any crop they have ever had.............. because the remainder of the growing season following the delayed planting was exceptional.
For example, the crop years 2012 and 2009 represent early and late planting date years in Indiana. About 94% of the state’s crop was planted by May 15 in 2012, but only 20% of the crop was planted by May 15 of 2009 (Fig. 2). Yet, the earlier planted 2012 crop yielded 38.7% BELOW trend yield for that year and the later planted 2009 crop yielded 9.3% ABOVE trend yield. Why? Important differences in YIFs between the years other than simply the planting dates.
Bottom Line
Let’s not succumb quite yet to fearmongering triggered by the prospects of a delayed start to corn planting in 2013. “Mudding in” a crop early to avoid planting late will almost always end up being an unwise decision. While important, planting date is only one of many yield-influencing factors for corn.
Another reason that it is probably too early to fearmonger about the anticipated late start to planting is that growers have the machinery capacity to “catch up” quickly once the weather and soil conditions become favorable for planting. The 1992 planting season began as one of the slowest but quickly recovered within two weeks to a respectable pace and finished the season with the largest POSITIVE departure from trend yield in the past 20 years (Fig. 4). We also know from past years’ experiences that, on average, 50% of the state’s corn crop is typically planted over about an 21-day period (Fig. 5). Furthermore, it is not unheard of for growers to plant 45 to 50% of the state’s crop in a single week given good working conditions (Fig. 6).
References
Myers, Brent and Bill Wiebold. 2013. Planting Date 2013. Univ of Missouri Extension [On-line] Available at <http://ipm.missouri.edu/IPCM/2013/4/Planting-Date-2013>. [URL accessed Apr 2013].
Nafziger, Emerson. 2008. Thinking About Corn Planting Date and Population. The Bulletin (No. 2, Article 7, April 4), Univ. of Illinois Extension. [On-line]. Available at <http://www.ipm.uiuc.edu/bulletin/article.php?id=890>. [URL accessed Apr 2013].
Nafziger, Emerson. 2011. Corn Planting: Optimism on Hold. The Bulletin (No. 3, Article 9, Apr 22), Univ. of Illinois Extension. [On-line]. Available at <http://bulletin.ipm.illinois.edu/article.php?id=1469>. [URL accessed Apr 2013].
USDA-NASS. 2013. Crop Progress and Condition. USDA, National Agricultural Statistics Service. [On-line]. Available at <http://usda.mannlib.cornell.edu/MannUsda/viewDocumentInfo.do?documentID=1048>. [URL accessed Apr 2013].
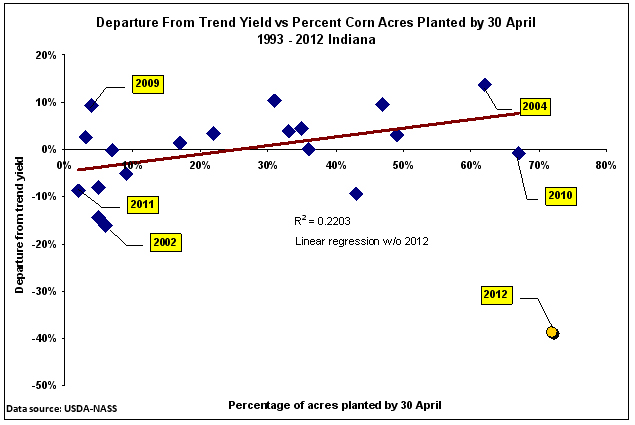
Fig. 1. Percent departure from trend yield versus percent of corn acres planted by April 30 in Indiana, 1993-2012.
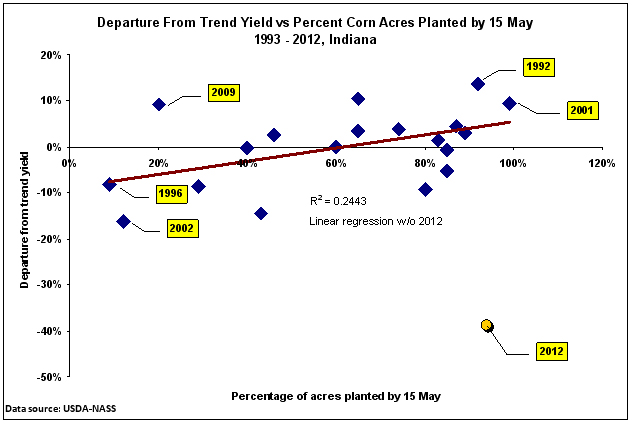
Fig. 2. Percent departure from trend yield versus percent of corn acres planted by May 15 in Indiana, 1993-2012.
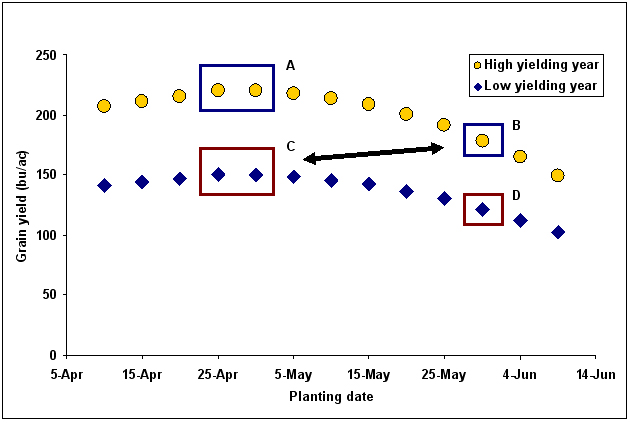
Fig. 3. The planting date conundrum relative to absolute yield potential; A delayed planted crop in one year (B) can yield better than a crop planted on the optimum date in another year (C).
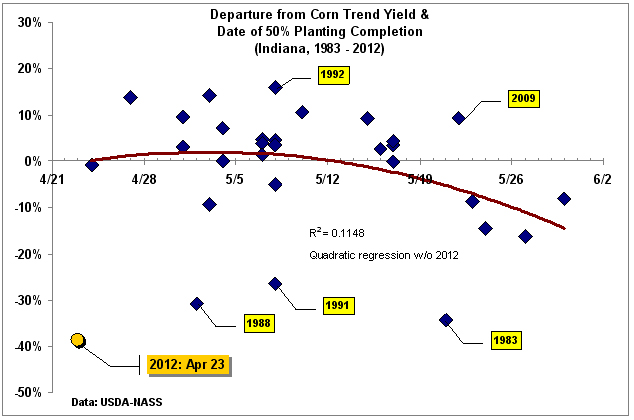
Fig. 4. Departure from trend yield vs. the date 50% of crop was planted, Indiana corn, 1983-2012.
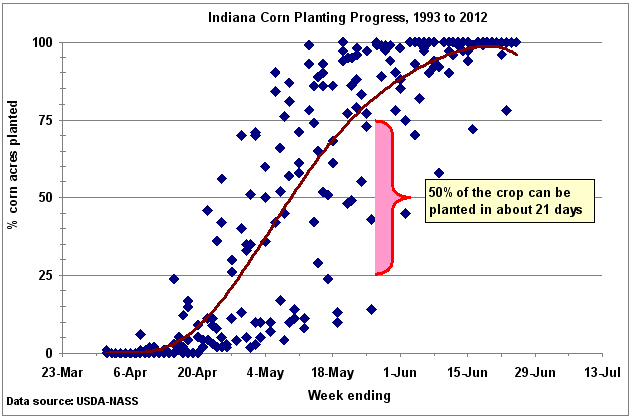
Fig. 5. Corn planting progress in Indiana during the years 1993-2012.
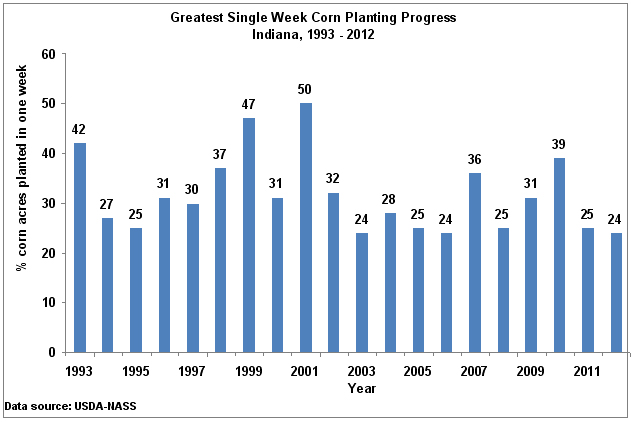
Fig.6. The fastest single week of corn planting progress in Indiana for individual years from 1993-2012.
![]()