Pest & Crop Newsletter, Entomology Extension, Purdue University
Late Soybean Insecticide Applications and Harvest Restrictions - (Christian Krupke and John Obermeyer)
• Harvest is fast approaching this drought year
• Insecticide labels have pre-harvest intervals, many listed below
• Treating spider mites at R6 (full seed) and beyond isn’t recommended
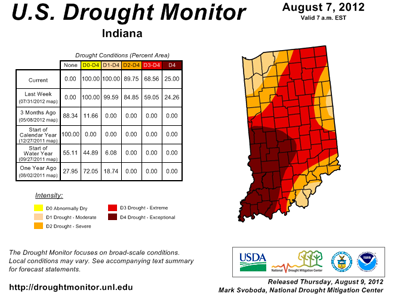
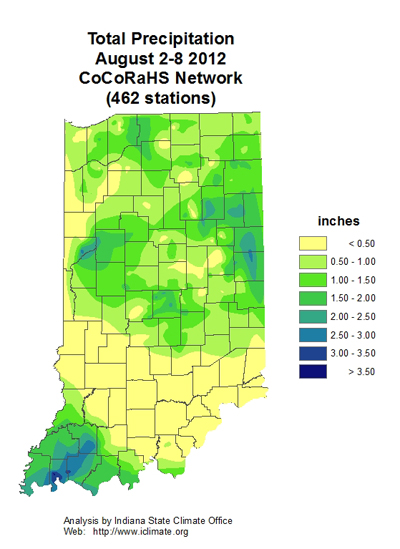
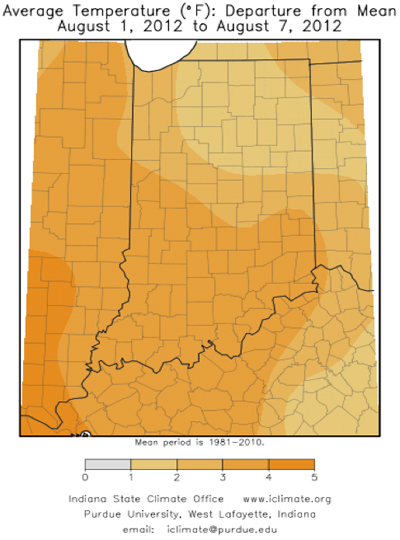
After a quick start to the growing season, the appearance of senescence is coming early to Indiana soybean fields – the poor growing conditions certainly have not helped the situation. Whether from spider mites, or in combination with the previous week’s drought and heat, stressed fields will likely see an early harvest. This reality quickly came to mind today after seeing a combine out of the shed getting prepped for harvest.
Keep in mind that although active spider mite populations, or even bean leaf beetle leaf/pod feeding may still be found, all insecticides have a pre-harvest interval that is stated on the label. In the table below are most of the common insecticides used and the days before one can legally harvest – know these intervals and plan accordingly!
That leads to another question: when is it too late to treat for insect pests, in terms of preserving yield? We don’t have any mite-specific data to go on, but for soybean aphids we have not seen yield benefits when treating at or beyond R5, regardless of pest pressure. Once we reach that stage, the plant is “shutting down” physiologically and there is nothing to be gained by wiping out insects feeding on what is essentially dying foliage – it’s not contributing anything to yield at this stage anyway. In the absence of more specific data, we extend the aphid recommendation to mites - at or beyond R5 there is no yield benefit in applying treatments.
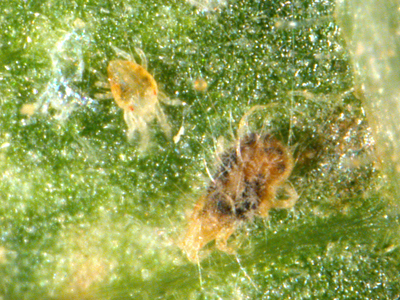
Recent rain and higher humidity has favored disease (discolored and “fuzzy”) development in the spider mite population
| Soybean Insecticides and Harvest Restrictions | ||
| Product | Rate and Formulation | Days Before Harvest |
| acetamiprid & bifenthrin (Justice)* | 2.5 - 3.0 fl. oz. EC | 30 |
| bifenthrin (generics)* | 5.1 - 6.4 fl. oz. EC | 18 |
| chlorpyrifos (Lorsban)* |
1 pt. 4E | 28 |
| chlorpyrifos & gamma cyhalothrin (Cobalt)* |
19 - 38 fl. oz. EC | 30 |
| clothianidin (Belay)* | 3 - 4 fl. oz. EC | 21 |
| cyfluthrin (Baythroid XL)* | 1.6y - 2.8 oz. 1EC | 45 |
| deltamethrin (generics)* | 1.5 - 1.9 fl. oz. 1.5EC | 21 |
| dimethoate | 1 pt. 4E | 21 |
| esfenvalerate (Asana XL)* | 5.8 - 9.6 oz. 0.66EC | 21 |
| gamma-cyhlothrin (generics) |
1.9 - 3.2 oz. 0.5EC 0.8 - 1.3 fl. oz. EC |
45 |
| imidacloprid & cyfluthrin (Leverage)* | 2.8 fl. oz. SE | 45 |
| lambda-cyhalothrin (Warrior II)* | 0.96 - 1.6 fl. oz. 2CS | 30 |
| zeta-cypermethrin (Mustang Max)* |
2.8 - 4.0 fl. oz. 0.8EW | 21 |
| zeta-cypermethrin & bifenthrin (Hero)* | 2.6 - 6.1 fl. oz. EC | 21 |
| zeta-cypermethrin & chlorpyrifos (Stallion, Tundra Supreme)* | 5.0 - 16.8 fl. oz EC | 28 |
| *Restricted Use Pesticide | ||
![]()
Click here for the Blacklight Trap Catch Report
Nutrient Management Related to Dry Soil Conditions and Poor Crop Yields - (Jim Camberato and Brad Joern) -
Potassium Deficiency
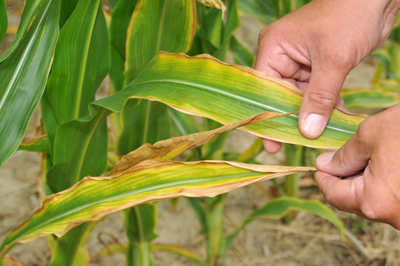
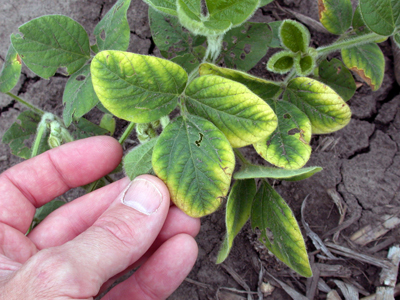
Dry soils have resulted in a high incidence of potassium (K) deficiency symptoms in both corn and soybean (see symptoms on right). Potassium deficiency occurs with low levels of soil test K. Dry soil reduces K uptake by slowing the movement of K from the soil solution to the plant root. Thus, K deficiency will occur in a dry year at higher soil test levels than will occur in a wet year.
Some of the K deficiency seen this year is in soil that normally has adequate K levels to supply the plant sufficiently, however much of the K deficiency is likely being seen in soil with low K levels. Soil sampling should be used to determine if soil K is adequate for future crops.
Soil Testing Problems in Dry Soils
Unfortunately if dry soil conditions continue, soil samples taken this fall (if the ground is soft enough to get a sample) may provide misleading results for K and pH. Soil test K has been shown to vary substantially with dry conditions. In soils with 2:1 clay minerals soil test K levels vary with moisture content. When field moist soil low in K is dried for analysis, an increase in soil test K occurs. However, when soils high in K are dried, soil test K decreases. If persistent dry conditions continue in the field this season, K availability will likely be overestimated in low testing soils and underestimated in high testing soils. In Indiana topsoils the change in soil test K with drying has been approximately ±15% at the highest and lowest soil test levels examined.
Soil pH measurements are also affected by dry soil conditions. With a dry season and poor plant growth much of the fertilizer added this spring and last fall remains in the 8-inch sampling zone. Higher than normal salt (fertilizer) levels affect the way the pH electrode functions and will produce a pH reading about 0.5-1.0 pH units lower than the actual pH. In addition, soil moisture has been insufficient for normal amounts of limestone reaction in soils limed this spring or last fall. Therefore, soil pH measured this fall will be lower than expected. The lime remains in the soil, however, and when moisture returns it will increase soil pH as expected. Re-testing this fall and adding more lime based on a low soil pH measurement may result in excessively high pH in future years.
Symptom of potassium deficiency in corn
Symptom of potassium deficiency in soybean
Depth of sampling is extremely important especially in fields with reduced tillage. Nutrients and pH are stratified within the upper 8 inches of soil without plowing. Soil test phosphorus (P) and K levels are highest at the soil surface due to the application of fertilizer and plant residues to the soil surface and levels of these immobile nutrients decrease with increasing distance from the soil surface. The stratification of soil pH depends on the placement of N and the relative frequency and quantity of lime application. Typically with subsurface application of N and infrequent liming, soil pH decreases with distance from the soil surface. Differences in sampling depth can substantially alter the results of soil analysis. Hard dry soil tends to reduce sampling depth, resulting in higher nutrient levels and pH than expected. Keep this in mind when comparing results from this year to results from previous years.
Nutrient Removal in Corn Harvested for Forage
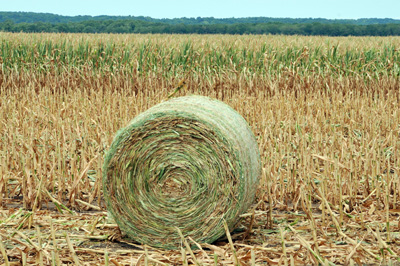
The amount of nutrient removed in drought-stressed corn harvested for forage is difficult to predict. Most estimates of nutrient removal typically used are based on plants with a normal ear, not barren plants. With unusually dry weather nutrient uptake as well as growth has been affected so the nutrient composition of the plants is probably not ‘normal’ either. The best way to determine nutrient removal is to obtain representative samples of the forage and have a commercial laboratory do a nutrient analysis. From the results of the analysis and an estimate of dry matter one can calculate nutrient removal. In the absence of a nutrient analysis a ballpark estimate would be about 0.25% P (0.57% P2O5) and 1.25% K (1.5% K2O). A dry ton of corn forage at these nutrient concentrations contains about 11.5 lb P2O5 and 30 lb K2O. Feed and nitrate analyses should also be requested to determine the value of the forage as a feed resource and any feeding limitations that may arise from high nitrate concentrations. Tamilee Nennich (Dept. of Animal Sciences) developed an information leaflet (see ref. #1) and calculation spreadsheet that can be used to determine nutrient removal and silage value (see ref. #2). Ron Lemenager (Dept. of Animal Sciences) and Keith Johnson (Agronomy) discuss feeding strategies based on feed and nitrate analyses (see ref. #3).
Nutrient Carryover in Poor Yielding Fields
In a dry year loss of nitrogen (N) from the soil via leaching and denitrification are negligible. Removal of N from the field via grain and/or forage harvest can also be greatly reduced with poor yield. Nitrogen accumulated by the crop remaining in the field will be released next season with decomposition of the plant tissues. Much of this year’s N, however, will remain as nitrate-N in the soil. Until rainfall returns to cause tile flow and/or saturated conditions in poorly-drained soils or deep leaching in sandy soils the N fertilizer applied for this season will be retained in the upper soil. Fall small grain or cover crops can scavenge the residual N and utilize it for growth, protecting it from loss. However, dry soil and residual herbicides may make establishment of these crops difficult. The amount of N that can be accumulated by the crops is difficult to predict, but a reasonable range may be 50 to 100 lb N/acre. Deciding how much to reduce next year’s N fertilization rate is also difficult.
Any nitrate-N in the soil this fall, winter, and spring will be subject to loss via leaching and denitrification. If moderate N loss occurs between now and next season, the remaining N can be assessed by measuring the nitrate-N content of a 0-1’- and 1-2’-deep soil sample taken a week or two before corn sidedress. Details on the testing procedure and interpretation of results can be found in ref. #4.
Phosphorus and K applied for this crop will remain in the soil if not removed in grain or forage. Availability of soil P and K should be sufficient for next season’s crop if soil test levels were in the maintenance range last season (not low). Phosphorus in the crop that remains in the field will be released with decomposition of the crop tissues in much the same way as N. Potassium will be leached from crop tissues by rainfall and should be returned to the soil more quickly than P or N. If P and K soil test levels were low prior to this season consider taking soil samples and making P and K applications next year if recommended as well.
References used in this article:
(1) Tamilee Nennich and Ken Hendrix. Determining a value for corn silage. <http://www.extension.purdue.edu/dairy/articles/ValueCornSilage.pdf>.
(2) Tamilee Nennich and Ken Hendrix. Corn silage crop calculator spreadsheet. <http://webcache.googleusercontent.com/search?q=cache:VAgxPV6S6hAJ
:www.extension.purdue.edu/dairy/articles/CornSilageValueCalculator2012.xls>.
(3) Ron Lemenager and Keith Johnson. Beef management practices when forages are in short supply. <http://www.agry.purdue.edu/ext/forages/CopingWithAShortForageSupply2012.pdf>.
(4) Sylvie M. Brouder and D.B. Mengel. The presidedress soil nitrate test for improving N management in corn. <http://www.agry.purdue.edu/ext/pubs/AY-314-W.pdf>.
Round bale of drought damaged corn
![]()

