
Click here to see the Black Light Trap Catch Report
Our sample boxes haven't arrived yet due to the holiday. Check back as I'll be updating this table as I get the information. Thank you!
![]()
Top Leaf Death or "Dieback" in Corn – (Bob Nielsen)
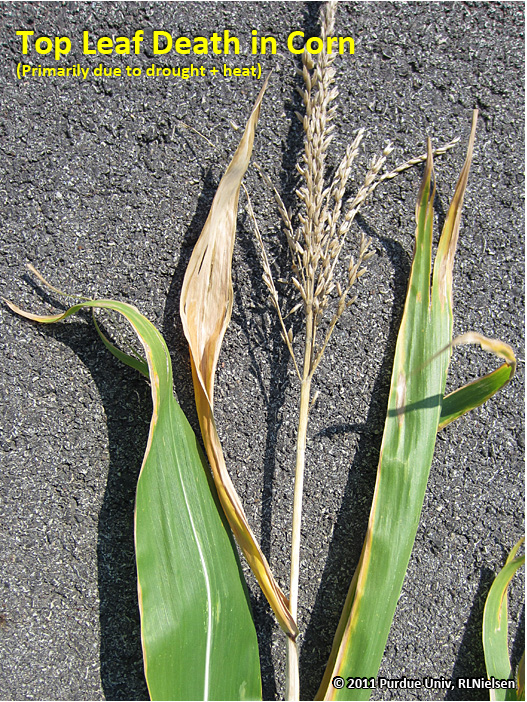
As a corn crop progresses toward physiological maturity, the leaves naturally begin to senesce (die). The timing and pattern of leaf senescence are genetically regulated but are also influenced by environmental triggers, including severe photosynthetic stress. In years where much of the grain fill period is characterized by severe drought and / or heat stress, the onset of leaf senescence can occur earlier than expected prior to kernel black layer. Not only do leaves begin to die sooner than expected, but the pattern of leaf senescence sometimes changes also.
The pattern of leaf senescence that many of us remember, perhaps wrongly, is one where leaf death begins at the bottom of the plants and slowly moves up toward the upper leaves. However, particularly in years with late-season stress, leaf senescence often progresses from both the bottom and the top of the plant, with green leaves remaining in the middle of the plants for some time until complete leaf senescence occurs. In fields where the upper leaves begin to die before those in the central part of the plant, the effect can cause an unusual golden "glow" in the upper canopy against the morning or evening sun.

Top leaf death in corn

Top leaf death in corn
Interestingly, the pattern of simultaneous upper and lower leaf senescence may not be that unusual from a physiological perspective. Canadian researchers (Tollenaar & Daynard, 1978) documented this same pattern of senescence among ten adapted dent corn hybrids in trials conducted in the mid-1970's. Furthermore, a faster rate of leaf senescence during one of the years of the study was attributed to a warmer, drier weather pattern during the grain fill period that accelerated the rate of grain filling (sound familiar in 2011?). More recent research (Valentinuz & Tollenaar, 2004) suggested that this pattern was also evident in good grain yield growing conditions.For many Indiana cornfields in 2011, the top-bottom pattern seems to have occurred most frequently in fields experiencing moderate to severe drought stress throughout the grain fill period. This "natural" pattern of upper leafsenescence usually affects all plants within a field or within areas of fields and perhaps distinguishes it from the more random plant pattern typical of leaf diseases like anthracnose or insect damage like European corn borer.
Death of top leaves may occur from one or more of several factors and may be partially distinguished by whether all plants are affected or only random plants throughout a field. The ultimate effect on grain yield obviously depends on how early in the grain-filling period the death of the upper leaves occurs.
Top leaf death in corn
Top leaf death in corn
Top leaf death in corn caused by drought stress
Top leaf death in corn
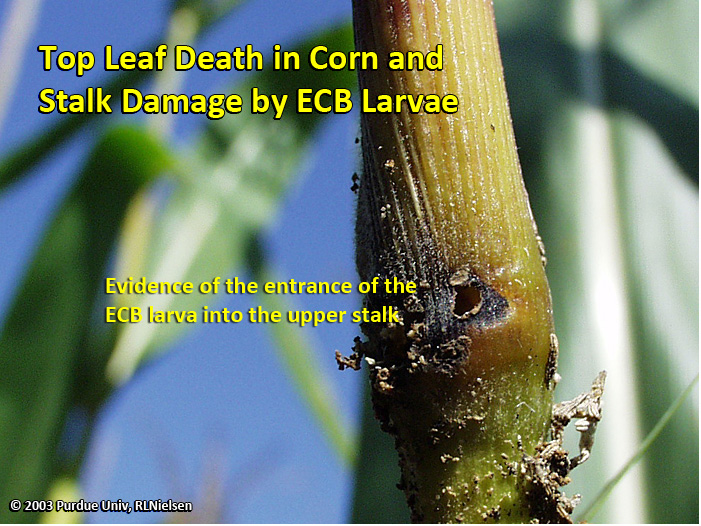
Top leaf death in corn and stalk damage by ECB
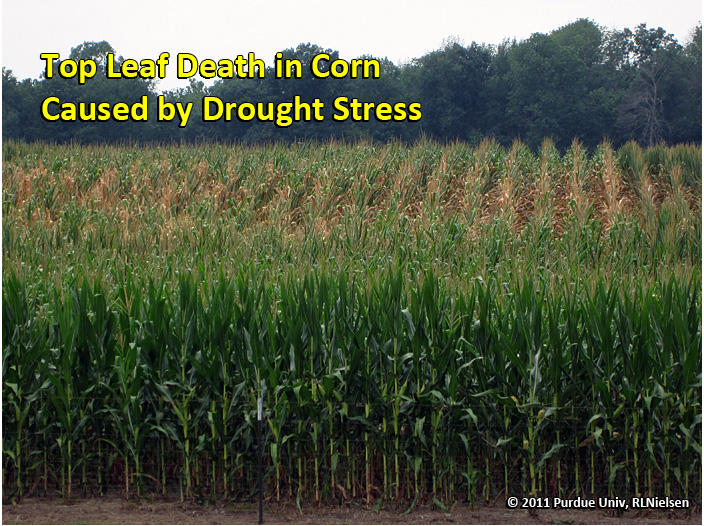
Death of top leaves can occur throughout the year as a direct result of a combination of excessive heat and drought stress as plants struggle to maintain leaf health during periods of soil moisture deficits and high transpiration before or during the grain fill period. Such leaf death is usually preceded by a gray-green color and wilting of the upper leaves. This drought-related pattern of upper leaf senescence also often affects all plants within severely drought-stressed areas of affected fields. In 2011, upper leaf death in response to heat + dryness occurred in some late-planted fields before they even reached the pollination stage.
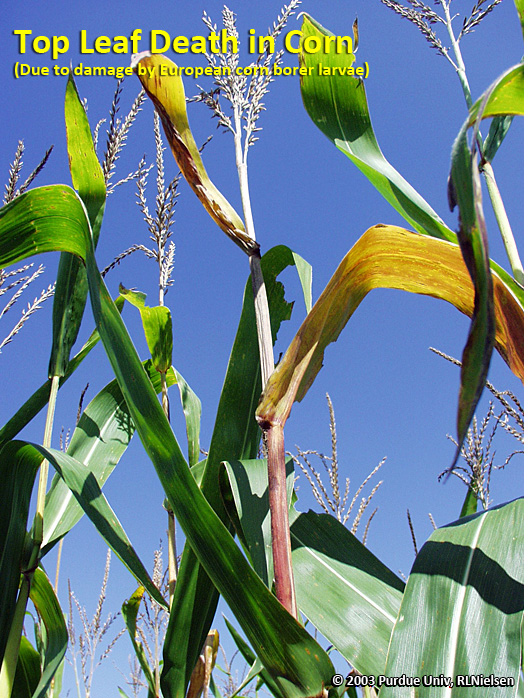
Death of top leaves can also be the result of European corn borer (ECB) or Southwestern corn borer (SWCB) tunneling damage to the upper stalk itself or girdling of the leaf sheath attachments at the stalk nodes. Such insect-related patterns of upper leaf senescence usually occur more randomly from plant to plant rather than affecting all plants within a field or area of field. This cause of damage to the upper canopy is less common today than 20 years ago because of the wide-spread adoption of Bt-corn borer trait hybrids, but can obviously still occur in fields planted to non-Bt trait hybrids.
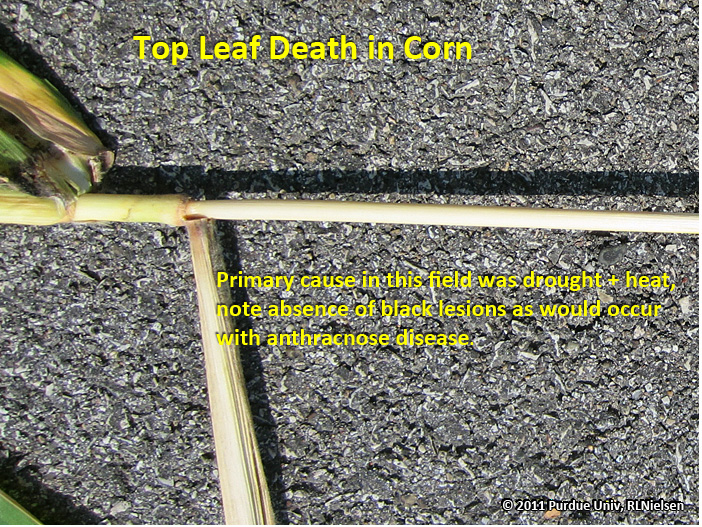
Finally, death of upper leaves and stalks can be the result of infection by anthracnose (Lipp & Mills, 2001; Robertson, 2007). One of the distinguishing symptoms of anthracnose "die-back" or "top-kill" is the presence of black lesions visible on the outer stalk tissue behind the leaf sheaths (Robertson, 2007). This fungal disease can be particularly damaging if it significantly shortens the grain-filling period resulting in premature kernel black layer development . Such disease-related patterns of upper leaf senescence usually occur more randomly from plant to plant rather than affecting all plants within a field or area of field.
Related reading
Bessin, Ric. 2004. Southwestern Corn Borer. Univ. of Kentucky Extension. Available online at http://www.ca.uky.edu/entomology/entfacts/ef108.asp [URL accessed Sep 2011].
Lipps, Patrick and Dennis Mills. 2001. Anthracnose Leaf Blight and Stalk Rot of Corn. Ohio State Univ. Extension Pub. AC-0022-01. Available online at http://ohioline.osu.edu/ac-fact/0022.html [URL accessed Sep 2011].
Robertson, Allison. 2007. Top dieback in corn: Is anthracnose the cause? Integrated Crop Management Newsletter, Iowa State Univ. [online] http://www.ipm.iastate.edu/ipm/icm/2007/9-10/topdieback.html [URL accessed Sep 2011].
Tollenaar, Matthijs & Terry Daynard. 1978. Leaf Senescence in Short-Season Maize Hybrids. Can. J. Plant Sci. 58: 869-874.
Valentinuz, Oscar R. and Matthijs Tollenaar. 2004. Vertical Profile of Leaf Senescence during the Grain-Filling Period in Older and Newer Maize Hybrids. Crop Sci. 44:827-834.
VanDyk, John. 2005. European Corn Borer Home Page. Iowa State Univ. Available online at http://www.ent.iastate.edu/pest/cornborer/ [URL accessed Sep 2011].
![]()
Predicting Corn Grain Maturity Dates for Delayed Plantings – (Bob Nielsen)
Delayed planting of corn in the upper Midwest often increases the risk that the grain will not mature prior to a killing fall freeze. Physiological maturity occurs when the "black layer" develops at the tips of the kernels where they connect to the cob. Kernel dry weight reaches its maximum at this point and the grain is generally considered to be safe from the effects of a subsequent killing fall freeze.
Under "normal" planting dates and growing conditions, the calendar time from individual grain fill stages to physiological maturity is similar across a wide geographical area of the U.S. Midwest. Physiological maturity (kernel black layer) for adapted corn hybrids occurs approximately 65 days after silking in the central Corn Belt (Abendroth et al., 2011; Brown, 1999; Neild & Newman, 1990) and 55 to 60 days after silking in the northern Corn Belt (Lauer, 2011). Earlier maturity hybrids not only reach silking in fewer days after planting, but will also reach black layer in fewer days after silking (Brown, 1999; Nielsen et al., 2002).
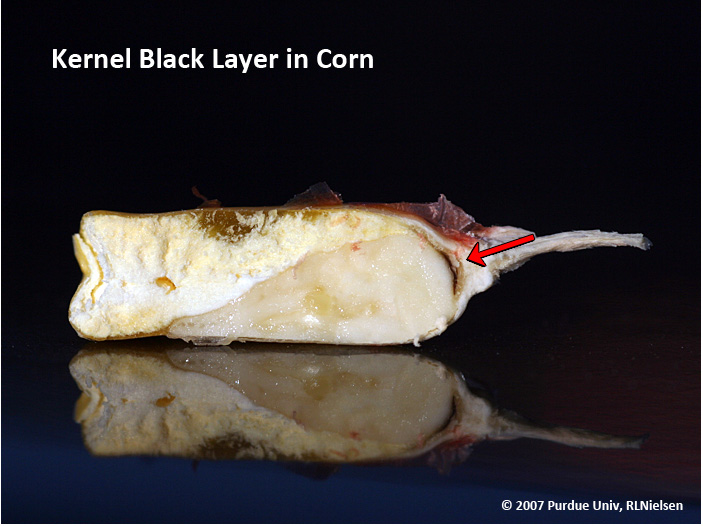
Kernel black layer in corn
The nagging question that worries farmers during the "dog days" of late summer following a delayed planting season is whether there are enough days left in the growing season for the crop to mature safely. The answer to that question depends on the current growth stage of the late-planted crop, the relative maturity of the hybrid planted in the field, the number of heat units (GDDs) yet to be received, and of course the actual date of the pending killing fall freeze.
Based on field research conducted in Indiana and Ohio (Brown, 1999), we know that corn hybrids typically mature with fewer accumulated heat units when planted late compared to planting on "normal" dates. This knowledge provides the basis for our hybrid maturity recommendations to farmers faced with late plantings (Nielsen, 2011b; Nielsen & Thomison, 2003).
That same research provided insight into both the calendar and thermal times typically required for grain at various stages of development to reach physiological maturity (kernel black layer, R6). The research was conducted at two locations in Indiana (westcentral and southeast) and two locations in Ohio (northwest and southwest) with three hybrids representing 97, 105, and 111 "day" relative maturities planted in early May, late May, and early June. The calendar and thermal times from silking to black layer for the three hybrid maturities are provided in Tables 1 - 3 that follow.
| Table 1. Calendar days and GDDs to black layer from grain fill stages R1 - R5 for an adapted 111 "day" corn hybrid with a GDD rating of 2760 GDDs from planting to black layer. Data averaged over eight trial sites. | |||||
| Planting Date | Calendar days to kernel black layer (R6) from... | ||||
| R1 | R2 | R3 | R4 | R5 | |
| Early May | 63 | 51 | 47 | 37 | 20 |
| Late May | 65 | 53 | 48 | 38 | 20 |
| Mid-June | 68 | 55 | 51 | 40 | 22 |
| Planting Date | GDDs to kernel black layer (R6) from... | ||||
| R1 | R2 | R3 | R4 | R5 | |
| Early May | 1231 | 965 | 884 | 670 | 327 |
| Late May | 1165 | 919 | 811 | 604 | 289 |
| Mid-June | 1029 | 781 | 681 | 489 | 217 |
| Adapted from Brown (1999). R1 = Fresh silks; R2 = Blister; R3 = White kernels w/ milky fluid; R4 = Dough, no visible denting; R5 = Late dent, all kernels visibly dented |
|||||
| Table 2. Calendar days and GDDs to black layer from grain fill stages R1 - R5 for an adapted 105 "day" corn hybrid with a GDD rating of 2695 GDDs from planting to black layer. Data averaged over eight trial sites. | |||||
| Planting Date | Calendar days to kernel black layer (R6) from... | ||||
| R1 | R2 | R3 | R4 | R5 | |
| Early May | 60 | 49 | 45 | 35 | 20 |
| Late May | 63 | 51 | 45 | 36 | 20 |
| Mid-June | 65 | 54 | 50 | 39 | 24 |
| Planting Date | GDDs to kernel black layer (R6) from... | ||||
| R1 | R2 | R3 | R4 | R5 | |
| Early May | 1194 | 945 | 866 | 658 | 337 |
| Late May | 1134 | 902 | 784 | 576 | 297 |
| Mid-June | 1021 | 786 | 691 | 491 | 259 |
| Adapted from Brown (1999). R1 = Fresh silks; R2 = Blister; R3 = White kernels w/ milky fluid; R4 = Dough, no visible denting; R5 = Late dent, all kernels visibly dented |
|||||
| Table 3. Calendar days and GDDs to black layer from grain fill stages R1 - R5 for an adapted 97 "day" corn hybrid with a GDD rating of 2578 GDDs from planting to black layer. Data averaged over eight trial sites. | |||||
| Planting Date | Calendar days to kernel black layer (R6) from... | ||||
| R1 | R2 | R3 | R4 | R5 | |
| Early May | 60 | 47 | 45 | 36 | 20 |
| Late May | 61 | 48 | 44 | 36 | 19 |
| Mid-June | 61 | 47 | 4 | 36 | 21 |
| Planting Date | GDDs to kernel black layer (R6) from... | ||||
| R1 | R2 | R3 | R4 | R5 | |
| Early May | 1176 | 901 | 841 | 665 | 319 |
| Late May | 1137 | 878 | 804 | 627 | 279 |
| Mid-June | 1010 | 743 | 671 | 482 | 223 |
| Adapted from Brown (1999). R1 = Fresh silks; R2 = Blister; R3 = White kernels w/ milky fluid; R4 = Dough, no visible denting; R5 = Late dent, all kernels visibly dented |
|||||
An interesting side note: The project was a nice example of bi-state cooperation between two universities in that Peter Thomison (OSU) and I co-advised the M.S. student in charge of the research project.
While there were slightly different responses among the four locations of the trial, there did not seem to be a consistent north / south relationship. Consequently, I believe growers can use the results summarized in the following tables to "guesstimate" the number of calendar days or heat units necessary for a late-planted field at a given grain fill stage to mature safely prior to that killing fall freeze.
Related Reading
Abendroth, Lori, Roger Elmore, Matthew Boyer, and Stephanie Marlay. 2011. Corn Growth and Development. Iowa State Extension Pub. PMR-1009.
Brown, Greg A. 1999. Influence of Delayed Planting on Growing Degree Day Requirements of Corn (Zea mays L.) Hybrids During Grain Fill and Maturation. M.S. Thesis, Purdue University.
Lauer, Joe. 2011. Corn Development. Univ. of Wisconsin. [online].
http://corn.agronomy.wisc.edu/Management/L011.aspx [URL accessed Aug 2011].
Neild, Ralph & Jim Newman. 1990. Growing Season Characteristics and Requirements in the Corn Belt. Purdue Extension Pub. NCH-40. [online]
http://www.extension.purdue.edu/extmedia/NCH/NCH-40.html [URL accessed Aug 2011].
Nielsen, RL (Bob). 2008. Grain Fill Stages in Corn. Corny News Network, Purdue Extension. [online] http://www.kingcorn.org/news/timeless/GrainFill.html [URL accessed Aug 2011].
Nielsen, R.L. (Bob). 2010. Heat Unit Concepts Related to Corn Development. Corny News Network, Purdue Extension. [online] http://www.kingcorn.org/news/timeless/HeatUnits.html [URL accessed Aug 2011].
Nielsen, RL (Bob). 2011a. Interpreting Corn Hybrid Maturity Ratings. Corny News Network, Purdue Extension. [online] http://www.kingcorn.org/news/timeless/HybridMaturity.html [URL accessed Aug 2011].
Nielsen, RL (Bob). 2011b. "Safe" Hybrid Maturities for Delayed Corn Planting in Indiana. Corny News Network, Purdue Extension. [online] http://www.kingcorn.org/news/articles.11/SafeHybridMaturities-0426.html [URL accessed Aug 2011].
Nielsen, R.L. (Bob) and Peter Thomison. 2003. Delayed Planting & Hybrid Maturity Decisions. Purdue Univ. Cooperative Extension Publication AY-312-W. [online]. http://www.agry.purdue.edu/ext/pubs/AY-312-W.pdf [URL accessed Aug 2011].
Nielsen, Robert L., Peter R. Thomison, Gregory A. Brown, Anthony L. Halter, Jason Wells, and Kirby L. Wuethrich. 2002. Delayed Planting Effects on Flowering and Grain Maturation of Dent Corn. Agron. J. 94:549-558.
![]()
Interpreting Corn Hybrid Maturity Ratings – (Bob Nielsen)
Hybrid maturity ratings have always been a sort of mystery to farmers and consultants alike. One factor that contributes to the mystery is that your definition of "maturity" may not be the same as my definition.
Agronomists usually refer to "maturity" as that point in time at the end of the grain filling period when maximum weight per kernel has occurred. The usual term for this is "physiological maturity" and is often associated with the development of the black layer at the tip of the mature kernel.
Grain moisture content at the onset of physiological maturity typically occurs within the range of 25 to 35 percent, though black layer can occur at grain moistures as wet as 40 percent. Grain moisture at physiological maturity varies year to year depending on growing conditions and can vary hybrid to hybrid.
Another definition of "maturity" is that point in time after physiological maturity when a hybrid can be safely harvested with minimal harvest loss, either by kernel loss or kernel damage. My term for this is "harvest maturity" and is usually associated with a grain moisture content of around 25 percent.
The traditional method for rating hybrid maturities (i.e., "days to maturity") is based on comparisons among hybrids near the time of "harvest maturity", with the assumption that grain moisture loss in the field is about 0.5 percentage point per day. For example, if the grain moisture content of a new hybrid is two percentage points wetter than that of a "standard" hybrid with an assigned relative maturity value of 110, the new hybrid is assigned a relative maturity value of 114 (two points of moisture divided by 0.5 point per day moisture loss).
Historically, folks have added the word "days" to this hybrid maturity rating value (i.e., 114-day hybrid), but it is important to recognize that this value does not refer to actual calendar time between planting and harvest maturity. Consequently, traditional relative maturity ratings of hybrids are of little help in determining whether a hybrid will safely mature before a killing fall frost.
The other common method for assigning relative hybrid maturities is based on the thermal time between planting and physiological maturity. Terms used to describe thermal time include "growing degree days" (GDD), "growing degree units" (GDU) and "heat units" (HU). Growing degree day values represent the amount of heat accumulated over a period of time. Since this method depends on actual measurement of thermal time, there is no need to compare hybrids in order to assign maturity rating values. In other words, the maturity rating for an individual hybrids stands on its own. Common values for such maturity ratings range from about 2500 (earlier maturity hybrids) to 2800 (later maturity) for hybrids commonly grown in Indiana.
The relationship between these two maturity rating methods is close but not always exact because each is based on a different definition of "maturity", the difference being the time period between physiological and harvest maturity. If hybrids vary for rates of grain moisture loss, their comparative maturity values may differ between the two maturity rating methods. Neither method is perfect, either, because of the influences of climatic conditions and plant stress on the grain maturation process.
Another "fly in the ointment" is the fact that there are no agreed upon standards within the seed industry for the application of either method for assigning relative hybrid maturities. Minor differences in methodologies among seed companies often result in the farmer's frustration in comparing maturity values among different brands of hybrids.
Unfortunately, the lack of industry standardization can make it difficult for growers who need to make a hybrid maturity decision for late planting situations and want to base that decision on the remaining available GDDs. Fortunately, at least one of the larger seed corn companies rates their hybrids according to GDD accumulations from planting to kernel black layer. Consequently, one can compare their relative hybrid maturity ratings against their growing degree day ratings to kernel black layer and develop a mathematical formula for predicting the GDD requirement of a hybrid using its relative hybrid maturity rating (Fig. 2).

Fig. 2. Relationship between company ratings for growing degree units (GDUs) from planting to kernel black layer with company ratings for relative hybrid maturity (CRMs). Adapted from data listed in "Characteristic Ratings of Pioneer® brand Corn Hybrids for 2011", Pioneer Hi-Bred, Int'l.
Disclaimer: Reference to any seed company in this article does not constitute an endorsement of said seed company by me or Purdue University. The public availability of said seed company's hybrid maturity ratings simply facilitates the mathematical modeling described in this article.
One can use this relationship to estimate the GDDs from planting to black layer for other companies' hybrids of similar relative maturities. For example, if the relative maturity of a hybrid is known to be comparable to a 110-day (CRM) Pioneer™ brand hybrid maturity, then Figure 1 suggests that the GDDs from planting to black layer would be approximately 2650. With this estimate in hand, growers can then begin the process of determining safe hybrid maturities for late planting situations.
Related References
Nielsen, R.L. (Bob). 2008. Grain Fill Stages in Corn. Corny News Network, Purdue Extension. [online] http://www.kingcorn.org/news/timeless/GrainFill.html [URL accessed Aug 2011].
Nielsen, R.L. (Bob). 2010. Heat Unit Concepts Related to Corn Development. Corny News Network, Purdue Extension. [online] http://www.kingcorn.org/news/timeless/HeatUnits.html [URL accessed Aug 2011].
Nielsen, R.L. (Bob). 2010. Hybrid Selection: Where's the Beef? Corny News Network, Purdue Extension. [online] http://www.kingcorn.org/news/timeless/HybridSeln.html [URL accessed Aug 2011].
Nielsen, R.L. (Bob). 2011. "Safe" Hybrid Maturities for Delayed Corn Planting in Indiana. Corny News Network, Purdue Extension. [online] http://www.kingcorn.org/news/articles.11/SafeHybridMaturities-0426.html [URL accessed Aug 2011].
![]()
Estimating Corn Grain Yield Prior to Harvest – (Bob Nielsen)
Fancy colored yield maps are fine for verifying grain yields at the end of the harvest season, but bragging rights for the highest corn yields are established earlier than that down at the Main Street Cafe, on the corner of 5th and Earl. Some patrons of the cafe begin "eyeballing" their yields as soon as their crops reach "roasting ear" stage. Some of the guys there are pretty good (or just plain lucky) at estimating yields prior to harvest, while the estimates by others are not even close to being within the proverbial ballpark. Interestingly, they all use the same procedure referred to as the Yield Component Method.
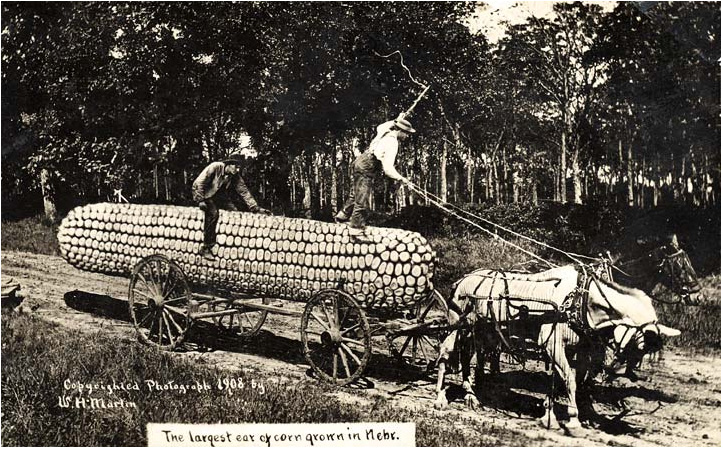
Largest ear of corn in Nebraska, ca. 1908. Courtest of the Nebr. Historical Society
Yield Component MethodOther pre-harvest yield prediction methods exist (Lauer, 2002; Lee & Herbek, 2005; Thomison, 2010), but the Yield Component Method is probably the most popular because it can be used well ahead of harvest; as early as the so-called "roasting ear" or milk (R3) stage of kernel development. Under "normal" conditions, the kernel milk stage occurs about 18 to 22 days after pollination is complete (Nielsen, 2008). Estimates made earlier in the kernel development period risk being overly optimistic if subsequent severe stresses cause unforeseen kernel abortion (Nielsen, 2011).
The Yield Component Method was originally described by the University of Illinois many years ago and is based on the premise that one can estimate grain yield from estimates of the yield components that constitute grain yield. These yield components include number of ears per acre, number of kernel rows per ear, number of kernels per row, and weight per kernel. The first three yield components (ear number, kernel rows, kernels/row) are easily measured in the field.
Final weight per kernel obviously cannot be measured until the grain is mature (kernel black layer) and, realistically, at harvest moisture. Consequently, an average value for kernel weight, expressed as 85,000 kernels per 56 lb bushel, is used as a proverbial "fudge factor" in the yield estimation equation. The equation originally used a "fudge factor" of 90, but kernel size has increased as hybrids have improved over the years. Consequently, a "fudge factor" of 80 to 85 is a more realistic value to use today.
Crop uniformity greatly influences the accuracy of any yield estimation technique. The less uniform the field, the greater the number of samples that should be taken to estimate yield for the field. There is a fine line between fairly sampling disparate areas of the field and sampling randomly within a field so as not to unfairly bias the yield estimates up or down.
1. At each estimation site, measure off a length of row equal to 1/1000th acre. For 30-inch (2.5 feet) rows, this equals 17.4 feet.
TIP:
For other row spacings, divide 43,560 by the row spacing (in feet) and then divide that result by 1000 (e.g., [43,560/2.5]/1000 = 17.4 ft).
2. Count and record the number of ears on the plants in the 1/1000th acre of row that you deem to be harvestable.
TIP:
Do not count dropped ears or those on severely lodged plants unless you are confident that the combine header will be able to retrieve them.
3. For every fifth ear in the sample row, record the number of complete kernel rows per ear and average number of kernels per row. Then multiply each ear's row number by its number of kernels per row to calculate the total number of kernels for each ear.
TIPS:
Do not sample nubbins or obviously odd ears, unless they fairly represent the sample area. If row number changes from butt to tip (e.g., pinched ears due to stress), estimate an average row number for the ear. Don't count the extreme butt or tip kernels, but rather begin and end where you perceive there are complete "rings" of kernels around the cob. Do not count aborted kernels. If kernel numbers are uneven among the rows of an ear, estimate an average value for kernel number per row.
4. Calculate the average number of kernels per ear by summing the values for all the sampled ears and dividing by the number of ears.
EXAMPLE:
For five sample ears with 480, 500, 450, 600, and 525 kernels per ear, the average number of kernels per ear would be (480 + 500 + 450 + 600 + 525) divided by 5 = 511.
5. Estimate the yield for each site by multiplying the ear number (Step 2) by the average number of kernels per ear (Step 4) and then dividing that result by the number below that best represents the kernel set and grain fill conditions this year for the field whose yield you are estimating. The values below represent the range in numbers of kernels (thousands) in a 56# market bushel.
| Table 1. Kernel numbers per bu. relative to growing conditions during the grain fill period | |
| Growing conditions | Range in kernel number per bu. (thousands) |
| Excellent | 75 to 80 |
| Average | 85 to 90 |
| Poor | 95 to 105 |
EXAMPLE:
Let's say you counted 30 harvestable ears at the first thousandth-acre sampling site. Let's also assume that the average number of kernels per ear, based on sampling every 5th ear in the sampling row, was 511. Let's also assume that growing conditions during grain fill were average. The estimated yield for that site would (30 x 511) divided by 85, which equals 180 bu./ac.
Repeat the procedure throughout field as many times as you deem to be representative. Calculate the average yield for all the sites to estimate the yield for the field.
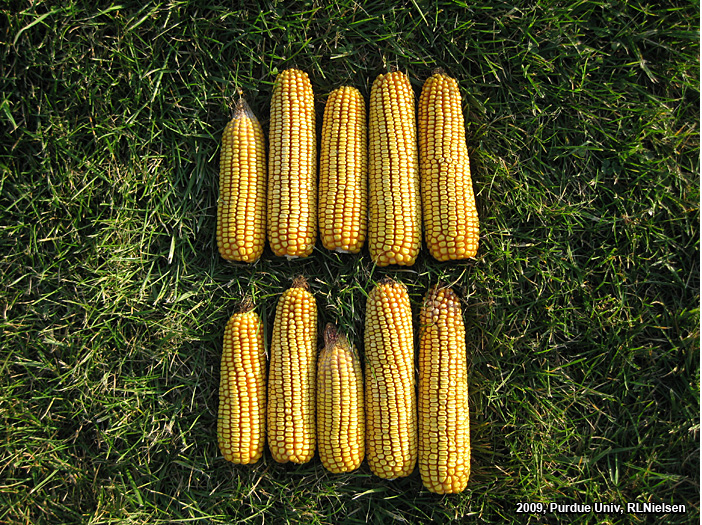
Random sample of ears
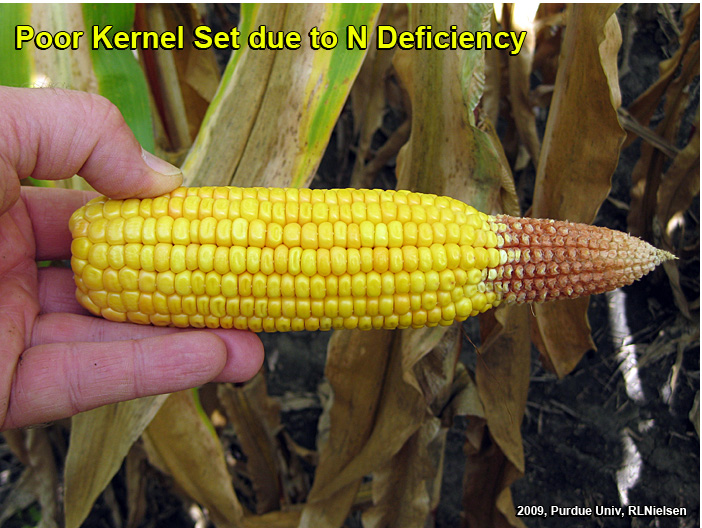
Poor tip fill due to N deficiency
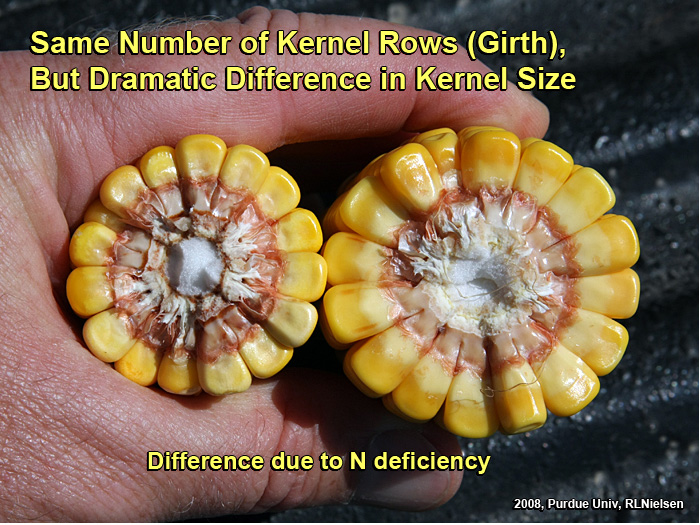
Kernel size differences due to N deficiency
Remember that this method for estimating pre-harvest grain yield in corn indeed provides only an estimate. Since kernel size and weight will vary depending on hybrid and environment, this yield estimator should only be used to determine "ballpark" grain yields. Yield will be overestimated in a year with poor grain fill conditions (e.g., low kernel size and weight from a drought year) and underestimated in a year with excellent grain fill conditions (e.g., larger kernel size and weight from non-stress grain fill periods).
Recognize that the Yield Component Method for estimating corn grain yield is probably only accurate within plus or minus 30 bushels of the actual yield. Obviously, the more ears you sample within a field, the more accurately you will "capture" the variability of yield throughout the field. Use the yield estimates obtained by this method for general planning purposes only.
The Pro Farmer Midwest Crop Tour Method
The Pro Farmer group of Farm Journal Media sponsors an annual Midwest Crop Tour that sends out teams of "scouts" to visit corn fields throughout the Midwest to estimate yields. The method used in that effort is a variation of one described years ago by University of Minnesota agronomist Dale Hicks (now Professor Emeritus) that combines the use of several yield components (ears per acre and kernel rows per ear) with a measurement of ear length (a proxy for kernel number per row).
The focus of the crop tour is not to necessarily estimate the yields of specific fields, but rather to more broadly estimate the yield potential within regions of the Midwest, so one probably should exercise caution in using this method for estimating yields within an individual field. Nevertheless, folks who have heard about the Pro Farmer Tour may be interested in trying the method themselves, so here are the steps involved with the Pro Farmer method (Flory, 2010). I would certainly suggest that these steps be repeated in several areas of an individual field because of natural spatial variability for yield.
1. Measure and record the row spacing (inches) used in the field.
EXAMPLE:
30 inches
2. Walk through the end rows into the bulk of the field, then walk about 35 paces down the rows to the first sampling area.
Tip:
For subsequent yield estimates within the field, I would suggest walking even further into the field and crossing over multiple planter passes to sample different areas of the field.
3. Measure or step off 30 feet down the row, then count all ears in the two adjacent rows. Divide that number by two and record it.
EXAMPLE:
(42 ears in one row + 45 ears in other row) divided by 2 = 43.5
4. Pull the 5th, 8th and 11th ears from plants in one row of the sampling area.
Tip:
Frankly, I would suggest harvesting up to 5 ears from each of the two adjacent rows to better sample the area and minimize the effect that one oddball ear could have on the calculated average ear lengths and kernel row numbers.
5. Measure length of the portion of each ear that successfully developed kernels. Calculate the average ear length of the three ears and record it.
EXAMPLE:
(6 inches + 7 inches + 5 inches) divided by 3 = 6
6. Count the number of kernel rows on each ear. Calculate the average kernel row number and record it.
EXAMPLE:
(16 rows + 14 rows + 16 rows) divided by 3 = 15.3
7.Grain yield for the sampling area is calculated by multiplying the average ear count by the average ear length by the average kernel row number, then dividing by the row spacing.
EXAMPLE:
(43.5 ears x 6 inches x 15.3 rows) divided by 30-inch rows = 133 bu/ac yield estimate
Related Reading
Flory, Chip. 2010. Crop Tour Insider. Pro Farmer, Farm Journal Media. [online] Available at http://www.agweb.com/profarmer/article/crop_tour_insider [URL accessed 2011].
Lauer, Joe. 2002. Methods for Calculating Corn Yield. Agronomy Advice, Univ. of Wisconsin-Madison. [On-Line]. Available at http://corn.agronomy.wisc.edu/AA/pdfs/A033.pdf [URL accessed Aug 2011].
Lee, Chad and Jim Herbek. 2005. Estimating Corn Yields (AGR-187). Univ. of Kentucky. [On-Line]. Available at http://www.ca.uky.edu/agc/pubs/agr/agr187/agr187.pdf. [URL accessed Aug 2011].
Nielsen, R.L. (Bob). 2008. Grain Fill Stages in Corn. Corny News Network, Purdue Univ. [On-Line]. Available at http://www.kingcorn.org/news/timeless/GrainFill.html [URL accessed Aug 2011].
Nielsen, R.L. (Bob). 2011. Kernel Set Scuttlebutt. Corny News Network, Purdue Univ. [On-Line]. Available at http://www.kingcorn.org/news/timeless/KernelSet.html [URL accessed Aug 2011].
Nielsen, R.L. (Bob). 2011. Effects of Stress During Grain Filling in Corn. Corny News Network, Purdue Univ. [On-Line]. Available at http://www.kingcorn.org/news/timeless/GrainFillStress.html [URL accessed Aug 2011].
Thomison, Peter. 2010. "Predicting" Corn Yields Prior to Harvest. C.O.R.N. Newsletter, Ohio State Univ. [On-Line]. Available at http://corn.osu.edu/newsletters/2010/2010-25/201cpredicting201d-corn-yields-prior-to-harvest [URL accessed Aug 2011].
![]()

![]()