
Pest & Crop Newsletter, Entomology Extension, Purdue University
- Fall Armyworm Target Late Growing Crops
- Caterpillars and Butterflies, Most Nice, Some Not
- Black Light Trap Catch Report
- Estimating Soybean Yields
- Field Drydown of Mature Corn Grain
- VIDEO: Crop Stress, Grain Fill and Corn Maturity
- Yield Monitor Calibration: Garbage In, Garbage Out
Fall Armyworm Target Late Growing Crops - (Christian Krupke and John Obermeyer)
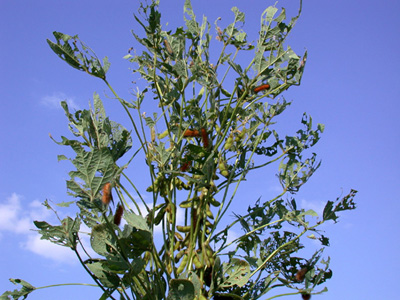
- This pest will target many different crops that are still green.
- Crops of various types are attacked by this caterpillar.
- Especially in southern counties, scout for this pest in late crops now.
The University of Kentucky has sent out an alert concerning the large numbers of fall armyworm moths being captured in their pheromone trapping program. Forage fields in that state have been severely damaged by larvae.
Female moths arriving from southern states will seek late-developing corn in which to lay their eggs. At this late date, with corn harvest initiated in southern counties, likely “trap” crops would be replanted corn in drowned out areas or late-market sweet corn. Initially, small larvae feed on the leaf surface, causing a “windowpane” effect, where the green tissue is removed and a transparent membrane remains. Whorl feeding by larger larvae appears as ragged-edged holes with excessive frass (caterpillar feces) being quite evident. The worms make their way into the ear and are capable of causing extensive kernel damage.
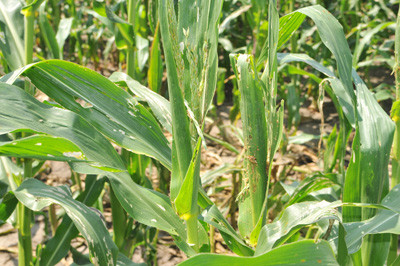
Whorl stage corn riddled by fall armyworm
The head of the fall armyworm is dark colored with a predominant white/yellow, inverted Y-shaped suture on the front. This “Y” distinguishes the fall armyworm from other worms in the ear, specifically the corn earworm. As well, the corn earworm have been high in numbers late this season, so finding both species within the same field would not be unusual. Fall armyworm will infest multiple species of grasses and broadleaf forages. Their insatiable appetite can denude alfalfa/hay crops rapidly, especially newly established stands.
Pest managers, especially in southern Indiana counties, should monitor crops that are still green for fall armyworm presence and their damage. With the unprecedented moth numbers being captured in Kentucky, targeted crops by the larvae will be defoliated quickly. Once the larvae are about 1” in length, this pest can “march” through a crop and seemingly make it disappear overnight.
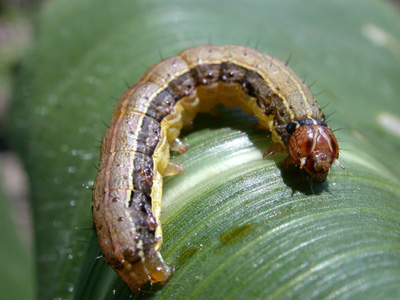
Fall armyworm, note inverted Y-shaped suture on front of head
![]()
Caterpillars and Butterflies, Most Nice, Some NOT - (Christian Krupke and John Obermeyer)
- Various butterfly species have been active feeding on nectar.
- Some of their caterpillars will cause minor damage in crops.
- Two caterpillar species can inflict painful stings.
- Other caterpillars, such as woollybears and thistle caterpillars, are harmless.
Pest managers occasionally observe peculiar-looking caterpillars feeding on the leaves of corn and soybean this time of the year. Most caterpillars found this late on corn or soybean foliage are of minor importance from their defoliation. Recently, sightings of silver-spotted skippers and woollybear caterpillars have been reported in soybean. From the number of silver-spotted skipper adults seen feeding on flowers, its obvious that this has been a banner year for them. The larvae are odd looking and grow up to 2 inches in length. They have a yellowish-green body with an obvious dark brown head and bright orange spots (“eyes”). As the caterpillar matures, it “knits” together leaves for a place of harborage where it eventually pupates. Very little introduction is needed for the furry, woollybear caterpillar. It is well known that multiple species take on various patterns and colors. On rare occasions, they can build in populations high enough to cause economic damage to very late-maturing soybean (e.g., replanted areas). Though some will disagree, there has been no truth to the color, or length of band on woollybear caterpillars to accurately forecast winter’s temperature. Don’t tell the kids – it’s fun to fool them!
Two species of caterpillars, the Io and saddleback, occasionally found in fields can sting when brushed against! Though both species can be found on many different plants, in field crops the Io feeds on both corn and soybean, while the saddleback is only encountered in corn.
The bodies of these caterpillars are covered with “stinging” or “urticating” hairs, which produce a stinging sensation and temporary rash when the caterpillars come into contact with the skin. These stinging hairs resemble spines; whereas the often encountered and harmless woollybear is just hairy looking. To add confusion to the matter, there are many more formidable looking caterpillars found on various plant species that are harmless. The old adage, “when in doubt, leave it alone” applies here. Should you come in contact with one of these caterpillars, most experience short-lived pain likened to that of “hot needles” and then temporary reddening of the skin.
Happy Scouting!
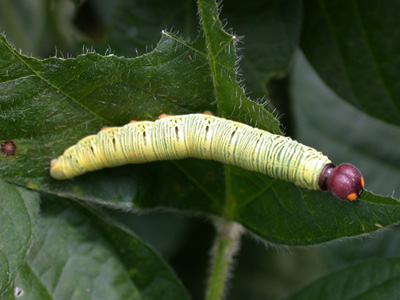
Silver-spotted skipper larva feeding on soybean

Silver-spotted skipper feeding on nectar
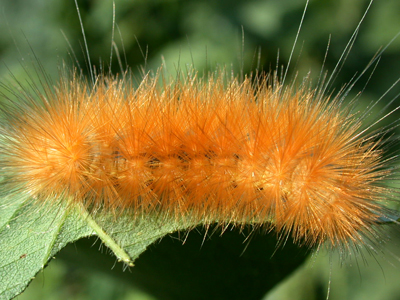
Woollybear caterpillar feeding on soybean
Significant defoliation by woollybear caterpillars
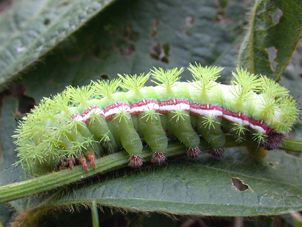
IO caterpillar, stinging hairs
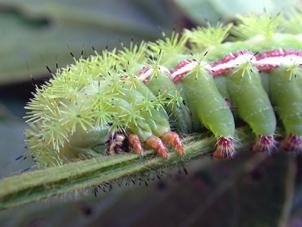
Close-up of Io caterpillar with urticating hairs
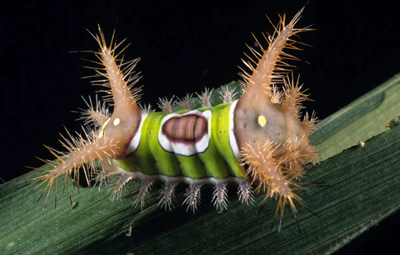
Close-up of a Saddleback caterpillar on corn
![]()
Click here to view the Black Light Trap Catch Report
![]()
Don't worry Bug Scout, there's plenty of silver-spotted skippers over at the flowers!
Sudden Death Syndrome and Brown Stem Rot in Soybean (Kiersten Wise)
Some soybean fields in Indiana are ready to be harvested, but in many fields across Indiana we can still see symptoms of the disease sudden death syndrome, or SDS. This disease is widespread in Indiana and appears to be most severe in fields planted in April or early May. Yield losses due to SDS are hard to quantify and depend on the variety planted and growth stage of the crop when symptoms first appear. Yield loss is most severe when symptoms are observed in early pod fill and when plants defoliate before they are at full seed.
SDS is a disease that is best managed through preventative methods. Producers are encouraged to plant varieties that are less susceptible to SDS in fields with a history of the disease. SDS is typically more problematic in early-planted soybeans. Planting fields with a history of SDS last may reduce the risk for SDS. Foliar fungicide applications are not recommended for management of SDS.
Brown stem rot, (BSR) has also been identified in several fields in Indiana. Foliar symptoms of this disease can resemble foliar symptoms of SDS and it is important to split the lower stem of symptomatic plants to determine which fungal disease is present. BSR can cause internal stem browning, resulting in a dark brown discoloration of the pith at the lower nodes of the plant. The pith of plants affected by SDS will remain white, while the tissue below the epidermis will have brown to gray discoloration present. BSR is best managed by planting varieties with moderate resistance to the disease. However, varieties that are resistant to SDS may not be resistant to BSR.
Estimating Soybean Yields – (Shaun Casteel)
The early plantings coupled with moderate precipitation and temperatures allowed many Indiana soybean fields to grow and develop faster than the past five years. The rate of bloom and pod set has been about a week ahead of the five year average (Figure 1 – Pod Set). The rate of maturation should keep this pace and may even speed up due to the stresses of high temperatures and limited water during August. Extended periods of heat stress during seed fill can shorten the duration of seed fill and thus, hasten leaf drop and reduce yield potential. Sudden Death Syndrome (SDS) has added insult to injury. The cool and wet growing conditions during early vegetative growth provided a perfect environment for infection. Then, the hot and dry August completed the recipe for high SDS incidence (presence) and infection, especially in those early planted fields.
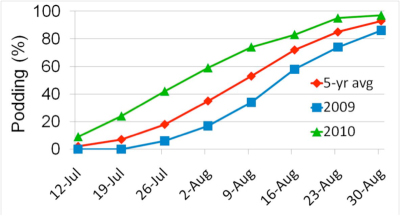
Figure 1. Pod set in 2010 Indiana soybeans (USDA-NASS, 2010).
Fields planted early this spring with an early maturity group soybean started shedding leaves in the middle of August (Figure 2) and harvest will probably start by early September. Fourteen percent of Indiana’s soybeans were shedding leaves as of August 30 compared to 6% for the five-year average (USDA-NASS, 2010). The first noticeable leaf drop of soybeans usually precedes (ever so slightly) the beginning of physiological maturity (R7 – any pod that has turned the mature pod color, see Figure 3). In a general sense, we can estimate that approximately 14% of the soybean crop has begun physiological maturity and that in 10 to 14 days they will reach full physiological maturity (R8 – 95% of the pods have turned the mature pod color). Then, grain moisture could be less than 15% with another 5 to 10 days of good drying weather. As a frame of reference, soybeans in a green pod are around 65% moisture and soybeans in a freshly matured pod will be around 35% moisture.
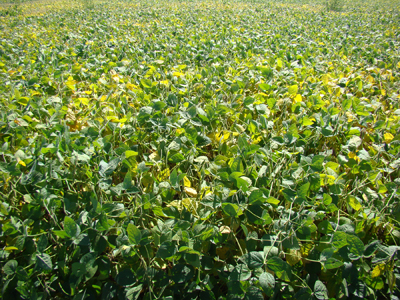
Figure 2. Soybeans shedding leaves prior to first signs of physiological maturity (R7)
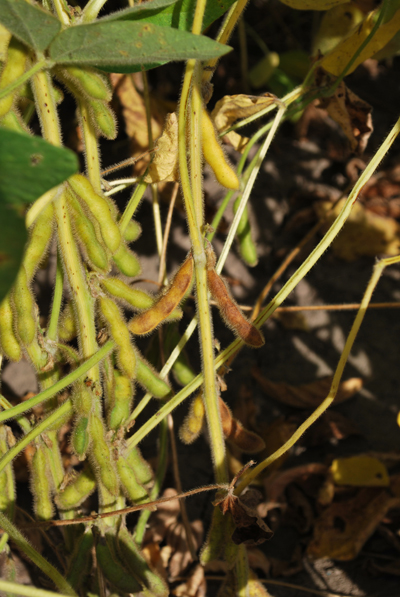
Figure 3. The first pod has turned mature pod color, which is the beginning of physiological maturity (R7)
Soybean yield estimations improve with each day toward harvest. Soybean yields are based on the number of plants per acre, pods per plant, seeds per pod, and seed size. The number of seed-bearing plants can change substantially throughout the growing season even during late stages of reproductive development. Plant stands taken early in the season are good for seedling establishment, but stand counts are needed for current yield estimations. Soybean stresses (disease, insect, and namely weather this season) influence pod retention, seed development, and seed fill. Soybean yield estimates during the end of seed fill and the beginning of maturation will assist us as we prepare for harvest and marketing the crop.
1. Determine the stand count of seed-bearing soybean plants. Stand counts should be taken in 10 randomly selected areas of the field and averaged. Hula-hoop stand counts are cumbersome and damaging to soybean plants at this time of the year, so stand counts based on 1/1000th of an Ac are suggested. Narrow rows require greater lengths of a single row to estimate stand counts of 1/1000th of an Ac, so I suggest counting 2 or 4 rows at a length that is ½ or ¼ as long as the single row length (Table 1). Some plants may be present with few to no pods, and they should not be counted. Disease-infected plants, such as SDS, should be counted unless the severity was high enough to abscise most pods and/or stop seed fill.
| 1 | 2 | 4 | |
|---|---|---|---|
| Row Width (in) | Length of Row(s) to Equal 1/1000th Ac | ||
| 7.5 | 69 ft. 8 in. | 34 ft. 10 in. | 17 ft. 5 in. |
| 10 | 52 ft. 3 in. | 26 ft. 2 in. | 13 ft. 1 in. |
| 15 | 24 ft. 10 in. | 17 ft. 5 in. | 8 ft. 11 in. |
| 20 | 26 ft. 2 in. | 13 ft. 1 in. | |
| 30 | 17 ft. 5 in. | 8 ft. 11 in. | |
Calculate the average plant population -> stand count x 1000 = __________
2. Count the # of pods per plant on 10 randomly selected plants from each sample area. Any plant that was counted in the stand counts, including disease-infected plants or water-stressed plants, should be among the choices.
Calculate the average pod # per plant = __________
3. Calculate pods per acre by multiplying plant population by pods per plant.
Line 1 × Line 2 = __________
4. Calculate seeds per acre by multiplying pods per acre by 2.5 seeds per pod. Seed number per pod can vary due to growing conditions during reproductive growth, especially during flowering and seed fill. However, 2.5 seeds per pod has been a good estimate over the years. A more accurate estimate of soybean yield could be obtained by counting the number of seeds per plant and multiplying by line 1 (i.e., skip step 3 and enter seed number per acre directly). If the number of seeds per pod seem to be higher (potential of new higher yielding soybeans?) or lower (stresses during flowering and seed fill), you may want to adjust accordingly.
2.5 × Line 3 = ________
5. Calculate pounds per acre by dividing seeds per acre by an estimate of 2,900 seeds per pound. Seed size will vary due to management (e.g, planting dates, seeding rates), variety, growing season (e.g., moderate temperatures and moistures during seed fill), and other stresses. Soybeans that endured heat stress and water stress during seed fill could be smaller due to a shorter seed fill period, and thus, a larger number could be used. SDS-infected soybeans could also have smaller soybeans.
Line 4 ÷ 2,900 = ________
6. Estimate yield by dividing pounds per acre by 60 pounds per bushel.
YIELD -> Line 5 ÷ 60 = ________
![]()
Field Drydown of Mature Corn Grain – (Bob Nielsen)
- Weather conditions strongly influence in-field grain drydown.
- Plant characteristics can also influence in-field grain drydown.
- Early grain maturation usually means faster in-field grain drydown.
- Later grain maturation usually means slower in-field grain drydown.
Grain moisture content at harvest obviously influences growers’ cost of artificially drying the grain after harvest. An early drydown of the crop also facilitates early or at least timely harvest of the crop prior to the colder and, often, wetter conditions of late fall.
Kernel moisture content decreases as the kernel develops through the blister stage (~ 85% moisture), milk stage (~ 80% moisture), dough stage (~ 70% moisture), dent stage (~ 55% moisture), and finally physiological maturity (~ 30% moisture). Prior to physiological maturity, decreases in kernel moisture occur from a combination of actual water loss (evaporation) from the kernel plus the continued accumulation of kernel dry matter via the grain filling process. After physiological maturity (identified by presence of the kernel black layer), percent kernel moisture continues to decrease primarily due to water loss from the kernel.
Weather & Timing of Grain Maturation
Grain moisture loss in the field occurs at a fairly linear rate within a range of grain moisture content from about 40 percent down to 15 to 20 percent, and then tapers off to little or no additional moisture loss after that. The exact rate of field drying varies among hybrids and years. Figure 1 illustrates changes in grain moisture content over time for an adapted medium maturity hybrid grown in Indiana in 1992 (unusually cool fall) and 1994 (more typical fall temperatures).
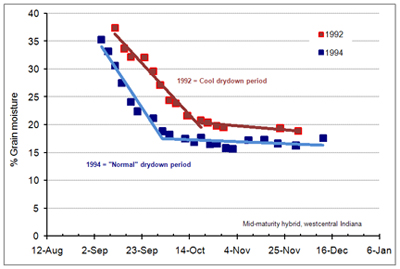
Figure 1.
Field drying of mature corn grain is influenced primarily by weather factors, especially temperature and humidity/rainfall. Figure 2 illustrates the relationship between the average daily temperature during the drydown period and the rate of field drying. Simply put, warmer temperatures and lower humidity encourage rapid field drying of corn grain.
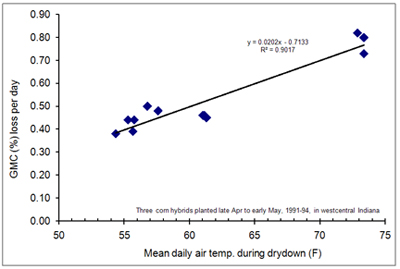
Figure 2.
Because grain drydown rates are greater when the drydown period is warmer, it stands to reason that a corn crop that matures in late August will dry down faster than one that matures in mid-September. In fact, there is a close relationship between the date when the grain nears physiological maturity (half-milkline or 2 to 3 weeks prior to kernel blacklayer) and the subsequent average daily drydown rate. Average daily drydown rates will range from about 0.8 percentage point per day for grain that nears maturity in late August to about 0.4 percentage point per day for grain that nears maturity in mid- to late September (Fig 3).
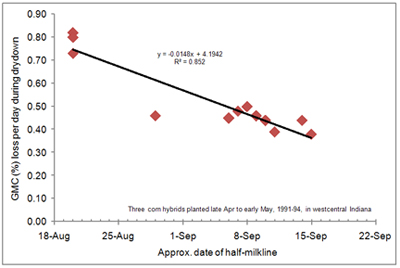
Figure 3.
Bear in mind that grain moisture loss for any particular day may be quite high or low depending on the exact temperature, humidity, sunshine, or rain conditions that day. It is not unheard of for grain moisture to decline more than one percentage point per day for a period of days when conditions are warm, sunny, windy and dry. By the same token, there may be zero drydown on cool, cloudy, rainy days.
Hybrid Variability for Field Drying
Hybrid variability for the rate of grain moisture loss during post-maturity drydown and the eventual grain moisture content at harvest are of great interest to grower and seed industry alike. Growers desire hybrids with superior yielding ability (maximum gross income) that also dry very quickly in the fall (minimum drying or grain shrinkage costs).
The seed industry uses grain moisture content data to assign relative hybrid maturity ratings on the basis of relative moisture differences among hybrids at harvest. Two hybrids that differ by one “day” of relative maturity will typically vary by about one half percentage point of grain moisture content (an average daily loss of moisture) if planted and harvested on the same days. Recognize that relative hybrid maturity ratings are most consistent within, not among, seed companies.
When weather conditions are great for rapid grain drydown, hybrids tend to dry at fairly similar rates. When weather conditions are not favorable for rapid drydown, then hybrid characteristics that influence the rate of grain drying become more important.
Researchers have identified the following traits or characteristics as ones most likely to influence grain drying in the field. The relative importance of each trait varies throughout the duration of the field drydown process and, as mentioned earlier, is most influential when weather conditions are not conducive for rapid grain drying.
- Kernel Pericarp Characteristics. The pericarp is the outermost layer of a corn kernel (botanically; the ovary wall). Thinner or simply more permeable pericarp layers have been associated with faster drying rates in the field.
- Husk Leaf Number. The fewer the number of husk leaves, the more rapid the grain moisture loss. In fact, modern hybrids have fewer husk leaves than those commonly grown years ago.
- Husk Leaf Thickness. The thinner the husk leaves, the more rapid the grain moisture loss.
- Husk Leaf Senescence. The sooner the husk leaves senesce (die), the more rapid the grain moisture loss.
- Husk Coverage of the Ear. The less the husk covers the tip of the ear, the more rapid the grain moisture loss.
- Husk Tightness. The looser the husk covers the ear, the more rapid the grain moisture loss.
- Ear Declination. The sooner the ears drop from an upright position after grain maturation to a downward position, the more rapid the grain moisture loss. In particular, husks of upright ears can “capture” rainfall.
Final Trivia For Coffeeshop Conversations
Interestingly, there is little, if any, documented evidence that moisture loss occurs through the pedicel (kernel connection to the cob) of the kernel through the cob tissue. Post-maturity grain moisture loss occurs primarily by evaporative loss from the kernel itself. Research many years ago established that post-maturity moisture loss through the kernel connective tissues (placental tissues) back to the cob is essentially non-existent (Kiesselbach and Walker, 1952; Crane et al., 1959). As those tissues cease to function (associated with the onset of kernel black layer and physiological maturity), the moisture and nutritional connection between kernel and cob is essentially broken.
Related References
Cavalieri, A.J. and O.S. Smith. 1985. Grain Filling and Field Drying of a Set of Maize Hybrids Released From 1930 to 1982. Crop Sci. 25:856-860.
Crane, P.L., S.R. Miles, and J.E. Newman. 1959. Factors Associated With Varietal Differences in Rate of Field Drying in Corn. Agron. J. 51:318-320.
Kiesselbach, T. A. and Elda R. Walker. 1952. Structure of Certain Specialized Tissue in the Kernel of Corn. Am J Bot 39:561-69
Nielsen, R.L. (Bob). 2008. Grain Fill Stages in Corn. Corny News Network, Purdue Univ. [online] <http://www.kingcorn.org/news/timeless/GrainFill.html> [URL accessed Aug 2010].
Troyer, A.F. and W.B. Ambrose. 1971. Plant Characteristics Affecting Field Drying Rate of Ear Corn. Crop Sci. 11:529-531.
![]()
Yield Monitor Calibration: Garbage In, Garbage Out – (Bob Nielsen)
Grain yield monitors have been in vogue for more than 10 years and can provide valuable spatial yield information to growers. Yield monitors offer a visual diversion from the boredom of harvest. They provide a source of historical yield records more detailed than that offered by elevator weigh tickets. They provide a viable alternative to weigh wagons or farm scales for measuring yiel e from about 0.8 percentage point per day for grain that nears maturity in late August to about 0.4 percentage point per day for grain that nears maturity in mid- to late September (Fig 3).
Most yield monitor systems operate on the same general principles. Typically, a grain flow impact sensor is located at the top of the clean grain elevator. Grain flow hits the impact sensor on its way to the loading auger. The impact of the grain flow is translated to electrical signals by the sensor. The electrical signal data are translated to estimates of grain flow rate by the yield monitor’s internal software. If equipped with a DGPS receiver, the yield monitor matches the individual yield estimate data points to geographic locations in the field.
Yield estimates on a whole field or individual load basis made by a well-calibrated yield monitor are accurate in the sense that they often very closely match yield estimates calculated from weigh wagons or commercial weigh scales. However, to achieve a satisfactory level of accuracy, yield monitors must be “trained” to correctly interpret the electrical signals generated by the impact sensor into estimates of grain flow rate . Some background information may help you better understand the nature of and importance of faithfully and regularly calibrating yield monitors.
Calibrating a yield monitor simply requires the harvest of individual “loads” of grain that represent a range of grain flow rates (i.e., a range of yield levels) expected in the field(s) to be harvested.The amount of grain required for each calibration “load” ranges from 3,000 to 6,000 lbs (50 to 100 bu grain) depending on the manufacturer’s recommendations for the specific model/make of yield monitor. The grain weight of each “load” is estimated by the yield monitor as the grain is harvested. The grain for that specific “load” is then offloaded from the combine hopper and weighed on weigh wagon or commercial scales. The actual weight is then entered into the yield monitor console and the yield monitor firmware makes adjustments to curve.
Conceptually, the calibration process is about fitting a response curve between grain flow rate and flow sensor signal strength in order to estimate low, medium, and high yields. Makes of monitors appear to differ in the nature of the calibration curve that is determined.
Some manufacturers suggest that only one grain load is necessary to perform an accurate calibration. The need for only one grain load implies that the calibration response curve is a straight-line or near-linear relationship between grain flow rates and flow sensor signals. While the standard recommendation is for only one grain load, the “fine print” in the owners’ manual suggests that additional calibration loads may be added to fine-tune the accuracy when necessary.
Other manufacturers recommend between 3 and 6 grain loads to perform a satisfactory calibration of the yield monitor. This suggests that the calibration response curve for these yield monitors is not a straight-line, but is rather some sort of non-linear response curve that requires a number of calibration points to best “train” the yield monitor how to interpret the flow sensor signals.
The goal here is to “capture” the full range of grain flow rates (aka yield levels) you expect to encounter during the harvest of your fields. Capturing a range of grain flow rates can be a nuisance because it typically requires harvesting individual full header width “loads” at different speeds or partial header width “loads” at a constant speed. This headache plus the time it takes to off-load and weigh the individual grain loads are among the most common reasons why growers do not faithfully calibrate their yield monitors. Yield monitor accuracy can be excellent if well-calibrated. Yield estimates by calibrated yield monitors that I use in my field-scale research trials are typically within 1 % of the actual grain weight measured with a weigh wagon or farm scales. Conversely, yield estimates can be very poor if yield monitors are not well-calibrated. The error in accuracy can be as much as 100 % if the yield monitor is taken “off the shelf” and put into service without any calibration. Errors in accuracy can easily range as high as 7 to 10 % late in harvest season if the yield monitor was calibrated only at the beginning of the harvest season. Errors in yield estimates are especially likely if the full anticipated range of harvested grain flow rates are not included in the calibration of the yield monitor.
Well, you may ask... who cares whether or not your yield monitor is providing you with accurate yield estimates. After all, growers are typically paid at the point of sale according to the weights printed on the scale ticket and not according to a yield map. Quite honestly, it also may not matter for simple farm record-keeping purposes.
However, if you want to USE the information that an accurate yield dataset provides, then you should strive to ensure accuracy in the yield estimates made by your yield monitor. Common uses for yield monitor data include comparisons of one field to another, one specific spot in a field to another, one hybrid’s performance to another, early versus late harvest season, and experimental treatments in on-farm field trials.
Yield monitor calibration accuracy can be influenced by yield levels outside the range of grain flow rates used for the yield monitor calibration, by seasonal changes in temperature, by grain moisture content early in the season versus late in the season, by hybrids in terms of their differences for grain weight, grain shape, and grain moisture, and by field topography. Calibrating your yield monitor once a season will typically not be satisfactory. Check the accuracy of the yield monitor calibration occasionally by harvesting and weighing additional calibration loads. Recalibrate the yield monitor when necessary to maintain an acceptable accuracy.
Don’t forget to...
Also calibrate the combine’s grain moisture sensor.
Also calibrate for the zero-flow combine vibration.
Also calibrate the temperature sensor at the beginning of the season.
Re-read the yield monitor operations manual prior to the harvest season.
Create a pre-season and in-season yield monitor checklist of all adjustments and settings.
Go through the yield monitor checklist every morning before beginning the day’s harvest.
Bottom Line
Yield data can be very useful for identifying and diagnosing yield influencing factors in corn or soybean. Yield monitors can also be useful for harvesting on-farm research trials. Yield monitor calibration, yield data processing, and yield data “cleaning” are necessary to ensure accurate yield data. Remember the old adage: “Garbage in….Garbage out”.
Related Reading
AgLeader Technology. 2010. Manuals and Quick Reference Sheets. [online ] <http://dealer.agleader.com/kbp/index.php?CategoryID=107>. [URL accessed Aug 2010].
Colvin, T.S. and S. Arslan. 1999. <Yield Monitor Accuracy>. Potash and Phosphate Institute Publ. SSMG-9. [online, URL accessed Aug 2010].
Digman, Matthew. 2009. Monitoring your yield monitor. Univ of Wisconsin Extension. [online] <http://ipcm.wisc.edu/WCMNews/tabid/53/EntryId/827/Monitoring-your-yield-monitor.aspx> [URL accessed Aug 2010].
Grisso, Robert, Mark Alley, and Phil McClellan. 2009. Precision Farming Tools: Yield Monitor. Virginia Cooperative Extension Pub 442-502. [On-line]. <http://www.pubs.ext.vt.edu/442/442-502/442-502.pdf> [URL accessed Aug 2010].
John Deere. 2009. Quick Reference Guides. [online]. <http://stellarsupport.deere.com/en_US/support/QuickReferenceGuides.html>. [URL accessed Aug 2010].
John Deere. 2009. Operator Manuals & Users Guides. [online]. <http://stellarsupport.deere.com/en_US/support/OperatorManual-UserGuide.html>. [URL accessed Aug 2010].
Shearer, S.A., J.P. Fulton, S.G. McNeill, S.F. Higgins, and T.G. Mueller. 1999. Elements of Precision Agriculture: Basics of Yield Monitor Installation and Operation. Univ. of Kentucky. [On-line]. Available at <http://www.bae.uky.edu/precag/PrecisionAg/Exten_pubs/pa1.pdf>. [URL accessed Aug 2010].
Watermeier, Nathan. 2004. Yield Monitor Calibration Tips—Making The Most From Your Data. Ohio State Univ. Extension Pub ANR-8-04. [On-line]. <http://ohioline.osu.edu/anr-fact/pdf/0008.pdf> [URL accessed Aug 2010].
![]()