
Pest & Crop Newsletter, Entomology Extension, Purdue University
Hessian Fly Continues to Spread - (Brandi Schemerhorn and Sue Cambron)
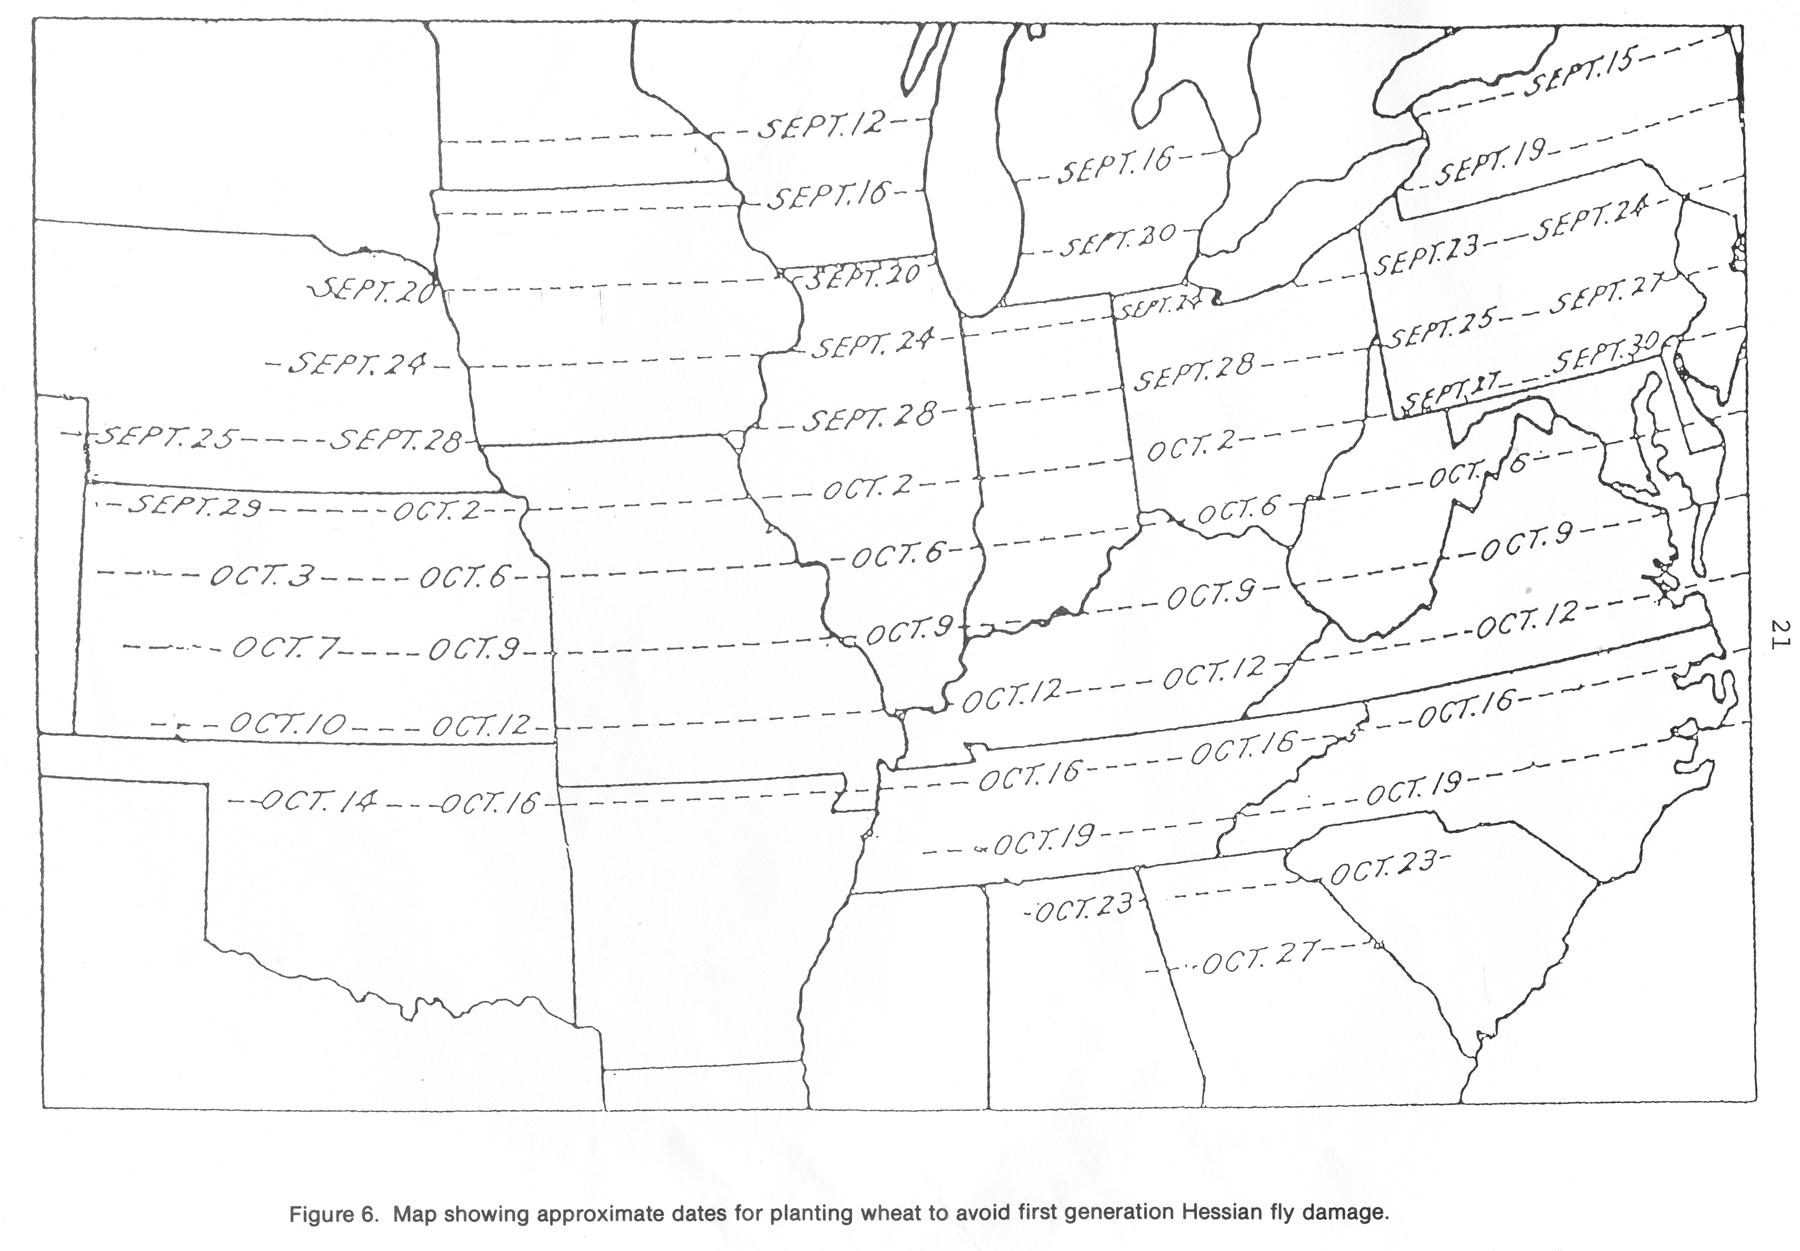
- Remember to utilize fly free dates.
- Destruction of volunteer wheat helps reduce insect reservior to avoid spring infestations.
The Hessian fly is present in wheat growing areas throughout the US, including Indiana. Even if wheat is not planted in a particular area, the Hessian fly can survive on alternative grass hosts. When the opportunity presents itself for a wheat infestation, there is potential for rapid increase of fly populations as a result of weather conditions or cropping practices that favor survival of eggs and young larvae in the fall.
A low fall infestation often goes unnoticed due to the tillering of the wheat plant. Much of the fall fly population can be avoided by planting after the fly-free date. This is key to avoiding subsequent infestation by the spring brood. Additionally, it has been shown that following the fly-free date will help reduce other wheat disease problems and reduce winter-kill from excessive growth. Crop rotation is a key management strategy for reducing Hessian fly problems.
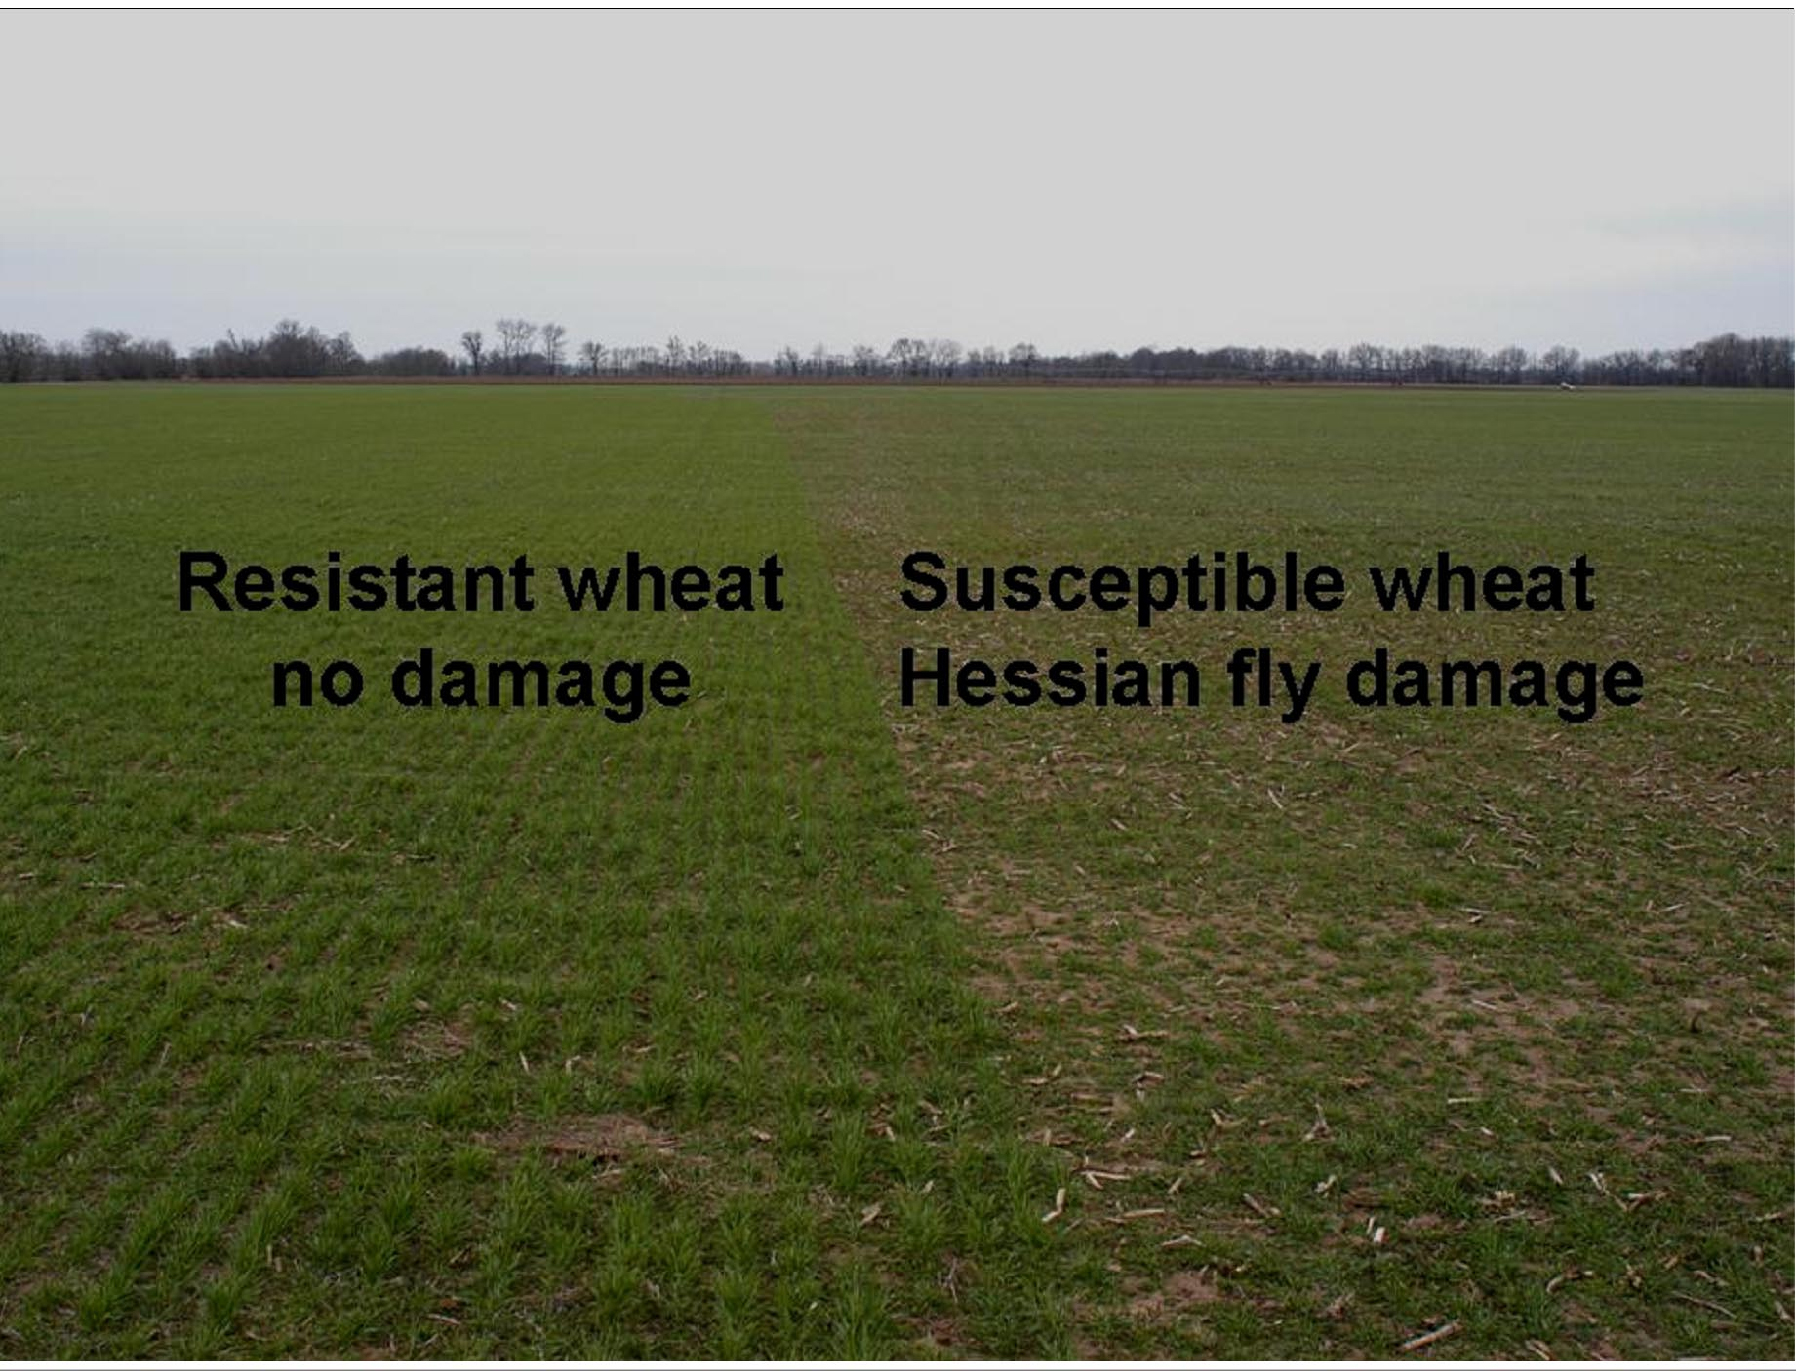
Tetst plots showing resistant and susceptible wheat
The Hessian fly passes the summer in the stubble of the current wheat crop. Plowing the stubble results in the destruction of the pest. Volunteer wheat germinates and begins growing just in time for the fall emergence of the Hessian fly. These plants are readily infested resulting in a rapid build-up of the population. Removal of volunteer wheat before the emergence of the fall brood greatly reduces the insect reservoir for a spring infestation.
The single best tool for preventing fall infestation is planting after the fly-free dates for your area. Infestations were heavy in southern Illinois and Missouri this year, but reports of Hessian fly damage in Indiana was down due greatly to the adherence to the fly free dates. Wisconsin is now considering a law to require adherence by farmers to the fly free dates.
![]()
Click here to view the Black Light Trap Catch Report
![]()
Impact of Heavy Rains on Corn: Potential for Lodging and Ear Rot Development - (Kiersten Wise and Charles Woloshuk)
The recent heavy rains and winds have caused extensive damage to areas of corn production in northern Indiana. Many fields remain flooded with the corn crop standing in several inches of water. With the likelihood that many of these fields will not drain quickly, questions are being asked about potential diseases that might threaten this corn. At this late stage in corn development the two disease threats are stalk rots, which will increase the chances of lodging, and ear rots, which can reduce grain quality.
The effects of standing water on stalk rot development are relatively unknown. However, root death and added stress caused by standing water will weaken late-planted corn and increase the likelihood that stalk rot pathogens will invade the plant. Plants that had stalk rot before flooding occurred may become more severely diseased and may readily lodge if winds pick up.
If the floodwater were high enough to cover the ears or if ears lay in the water because of lodging, there is an increased risk of contamination from bacteria not commonly associated with corn kernels. Ears on upright plants that are not exposed to standing water are safe from these bacteria. The only possible concern would be prolonged exposure to the high humidity generated by the standing water. Such conditions could promote growth of fungal ear rot pathogens at the tips of the ears. Whether the rot spreads down the ear or results in mycotoxin contamination will depend on several factors including the conditions of the ears prior to the flood, the temperature in the days ahead, and how long until the floodwater recedes and the ground dries.
Flooded areas as well as the entire field need to be monitored for stalk rot and ear rots. Fields or areas affected with significant amounts of ear rot should be harvested and handled separately. Grain should be harvested early and dried to 15% moisture or lower.
![]()
Dealing With High-Priced P and K Fertilizer – (Jim Camberato and Brad Joern)
The cost of phosphorus (P) and potassium (K) fertilizers have increased substantially resulting in heightened interest in the economical use of these nutrients. Fertilizer P and K applications should be based on the analysis of a representative soil sample. Using soil test results, P and K can be allocated to fields and portions of fields where crops are most likely to respond to fertilizer applications and omitted from areas where soil test P and K levels are already sufficient for supporting optimum crop yields. The judicious use of fertilizer P and K can help reduce the impact of high fertilizer prices.
Background Information About P and K Fertilizer Recommendations
In Indiana, fertilizer P and K recommendations are largely driven by soil test P and K levels and use the build-up, maintenance and drawdown philosophy to interpret soil test P and K levels and make fertilizer rate recommendations (Figure 1). See the Tri-State Fertilizer Recommendations for more details on this approach (Vitosh et. al., 1995).
Below some soil test P and K level, there is a good chance of getting a yield response to nutrient additions. We refer to this soil test level as the “critical level”. The likelihood and magnitude of response to P or K applications increases as the soil test drops farther below the critical level. Critical soil test P and K levels for corn, soybean, wheat and alfalfa are listed in Table 1. The soil test P critical level is higher for wheat and alfalfa than it is for corn and soybean. The soil test K critical level changes with cation exchange capacity (CEC) but is the same for all crops. Fertilizer P and K recommendations are designed to optimize crop yield and build-up soil test levels to the critical level after four years of application when the initial P or K soil test is below the critical level.
| Table 1. Critical Soil Test Levels for Several Agronomic Crops | |||||
Crop |
Critical Level P, ppm (lb/acre) |
Cation Exchange Capacity, meq/100 g |
|||
5 |
10 |
20 |
30 |
||
---- Critical Level K, ppm (lb/acre) ---- |
|||||
Corn |
15 (30) |
||||
Soybean |
15 (30) |
88 (165) |
100 (200) |
125 (250) |
150 (300) |
Wheat |
25 (50) |
---- Same Critical Level for All Crops ---- |
|||
Alfalfa |
25 (50) |
---- Same Critical Level for All Crops ---- |
|||
Similarly, above some soil test P and K level, there is very little chance of getting a yield response to additional P or K. We refer to this soil test level as the “maintenance limit”. Between the critical level and the maintenance limit, regular P and K fertilizer additions are recommended at rates that will maintain soil test P and K levels. For P, the rate needed to maintain soil test P levels (maintenance rate) is equal to the P2O5 removed by each crop. For K, the maintenance rate is equal to crop K2O removal plus 20 lbs of K2O that may be leached or fixed by soils in a form not measured by traditional soil tests.
Above the maintenance limit a fraction of the maintenance rate is suggested to allow soil test levels to gradually fall back to the maintenance limit, even though soil test levels above the maintenance limit are not required to support optimum yield. At even higher soil test levels no fertilizer P and K is recommended. Fertilizer P recommendations go to zero at 40 ppm for corn and soybean, and 50 ppm for wheat and alfalfa. Fertilizer K recommendations go to zero at 138, 150, 175 and 200 ppm for soils with CECs of 5, 10, 20 and 30 meq/100g, respectively. If your soil test is reported in lb/acre the value can be converted to ppm by dividing by 2 (assuming an 8” sampling depth). For example: 80 lb/acre/2 = 40 ppm.
In fields with high P and K soil test levels, P and K fertilizer additions often can be eliminated for at least a couple of years to offset high P and K fertilizer prices. When soil test P and K levels fall below the maintenance limit, regular fertilizer additions are recommended to keep soil test P and K levels in the maintenance range and to keep nutrient levels sufficient for optimum yield.
How Fast Do Soil Test P and K Levels Drop if No Fertilizer is Applied?
Soil test P and K levels decrease gradually in most soils when fertilization stops (the exception being very sandy soils). Soil test P levels decrease, on average, 1 ppm (2 lb/acre) for every 20 lb P2O5/acre removed by the crop. Changes in soil test K levels are dependent on CEC. High CEC soils change more slowly than low CEC soils. For example a soil with a CEC of 20 meq/100g would decrease 1 ppm (2 lb/acre) for about every 8 lb K2O/acre removed by the crop, while a soil with a CEC of 10 meq/100g would decrease 1 ppm (2 lb/acre) for every 6 lb K2O/acre, and a soil with a CEC of 5 meq/100g would decrease 1 ppm (2 lb/acre) for every 5 lb K2O/acre of crop removal. These estimates in soil test level changes, in conjunction with estimates of crop removal (Table 2), can be used to anticipate how quickly soil test P and K levels will decrease without fertilizer additions.
| Table 2. Nutrients Removed in Harvested Portions of Agronomic Crops | |||
Crop |
Unit of Yield |
Nutrient Removed Per Unit of Yield |
|
P2O5 |
K2O |
||
----- lb/unit ----- |
|||
Corn grain |
bushel |
0.37 |
0.27 |
Corn silage |
ton |
3.3 |
8.0 |
Soybean |
bushel |
0.80 |
1.40 |
Wheat grain |
bushel |
0.63 |
0.37 |
Wheat straw |
bushel |
0.09 |
0.91 |
Alfalfa |
ton |
13.0 |
50.0 |
Example to Show How to Estimate Decreases in Soil Test P and K Levels
You have a field where you grow only corn and soybean and this field has a soil test P level of 45 ppm, a soil test K level of 200 ppm and a CEC of 10 meq/100g. The soil test levels are above the point of zero fertilizer recommendation for both P (40 ppm) and K (150 ppm), so no fertilizer P or K would be recommended for this field. You are hoping to average 200 bu/acre and 60 bu/acre, respectively (you can always hope…). What levels of soil test P and K are expected after two years of crop removal without fertilization?
Phosphorus Removal and Soil Test P
From Table 2, each bushel of corn removes 0.37 lb P2O5/acre and each bushel of soybean removes 0.80 lb P2O5/acre. Therefore, a high yielding corn-soybean rotation (200 bu/acre corn and 60 bu/acre soybean) will remove about 120 lb P2O5/acre during this two year time period.
Corn P2O5 removal: 200 bu/acre-year x 0.37 lb P2O5/bu = 74 lb P2O5/acre
Soybean P2O5 removal: 60 bu/acre-year x 0.80 lb P2O5/bu = 48 lb P2O5/acre
Total lbs P2O5/acre removed by corn and soybean crop = 122 lb P2O5/acre
If soil test P will decrease by 1 ppm for every 20 lbs P2O5/acre removed by a crop, then you would expect the soil test P in this field to decrease by about 6 ppm after two years of cropping without P fertilization.
122 lb P2O5/acre divided by 20 ppm P/lb P2O5 = 6.1 ppm P
Therefore, after 2 years of crop production, soil test P in this field will decrease from 45 ppm to approximately 39 ppm.
Potassium Removal and Soil Test K
Similarly, from Table 2, each bushel of corn removes 0.27 lb K2O/acre and each bushel of soybean removes 1.40 lb K2O/acre. Therefore, a high yielding corn-soybean rotation (200 bu/acre corn and 60 bu/acre soybean) will remove about 180 lb K2O/acre during this two year time period.
Corn K2O removal: 200 bu/acre-year x 0.27 lb K2O/bu + 20 lb K2O/year “loss” factor =
74 lb K2O/acre
Soybean K2O removal: 60 bu/acre-year x 1.40 lb K2O/bu + 20 lb K2O/year “loss” factor = 104 lb K2O/acre
Total lbs K2O/acre removed by corn and soybean crop = 178 lb K2O/acre
If soil test K will decrease by 1 ppm for every 6 lbs K2O/acre removed by a crop, then you would expect the soil test K in this field to decrease by about 30 ppm after two years of cropping without K fertilization.
178 lb K2O/acre divided by 6 ppm K/lb K2O = 29.7 ppm K
Therefore, after 2 years of crop production, soil test K will decrease from 200 ppm to approximately 170 ppm.
Bottom Line
Now is a great time to save on fertilizer costs if soil test levels are above the maintenance limit because fertilizer P and K are not needed to support optimum crop yields and will not need to be replaced by future fertilizer applications.
At soil test levels between the critical level and the maintenance limit fertilizer P and K are recommended to maintain soil test levels in a range that is sufficient to support optimum crop yields, but not more than enough. Not applying P and K fertilizer this season will not decrease crop yield but the decision is only economically beneficial if fertilizer prices fall in the short-term.
If soil test levels are below the critical level then crop yields are expected to be limited by soil P and K. The value of the lost yield is likely greater than the cost of fertilizer, especially considering the multiple year impact of the fertilizer application.
Related References
Vitosh, M.L., J.W. Johnson, D.B. Mengel. 1995. Tri-state Fertilizer Recommendations for Corn, Soybeans, Wheat and Alfalfa (E-2567). Michigan State Univ, Ohio State Univ, and Purdue Univ Extension. [On-line]. Available at <http://www.ces.purdue.edu/extmedia/AY/AY-9-32.pdf>. [URL accessed 15 Sep 2008].
![]()