
Pest & Crop Newsletter, Entomology Extension, Purdue University
Stress During Grain Fill: A Harbinger of Stalk Health Problems - (Bob Nielsen)
Harbinger. [hahr-bin-jer]
Anything that foreshadows a future event; omen; sign: Frost is a harbinger of winter.
Dictionary.com. Dictionary.com Unabridged (v 1.1). Random House, Inc.
<http://dictionary.reference.com/browse/harbinger> (accessed: September 01, 2008).
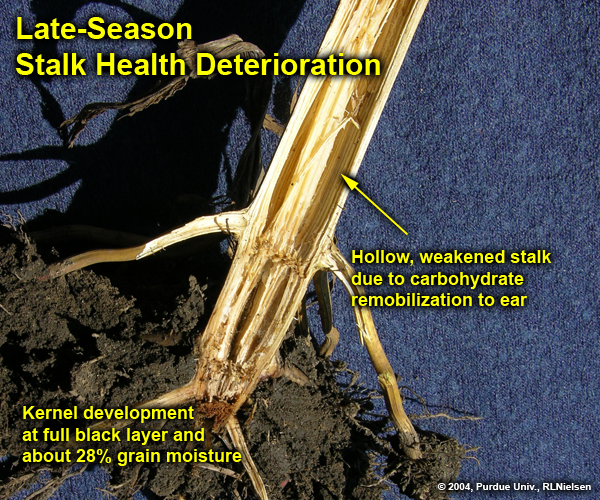
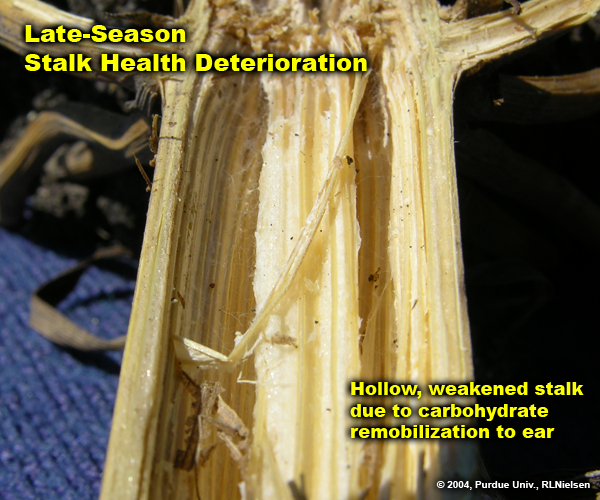
During the grain filling period, developing kernels become a significant photosynthetic “sink” for the products of photosynthesis and respiration. Corn plants prioritize the movement of these photosynthates to the kernels, even at the expense of not maintaining cellular health of stalk, leaf, and root tissues.
The primary effect of severe stress on a corn plant (drought, heat, nutrient deficiency, leaf diseases, insect damage, hail damage, consecutive days of cloudy weather) is a reduction in photosynthetic rates. If photosynthetic capacity decreases significantly during grain fill, plants often respond by remobilizing stored carbohydrates from stalk and leaf tissues to supply the intense physiological demand by the developing grain on the ears. In addition to physically weakening the stalk of plants, remobilization of stored carbohydrates and/or the consequent lower cellular maintenance of root and stalk tissues increases the susceptibility of the plant to root and stalk rots.
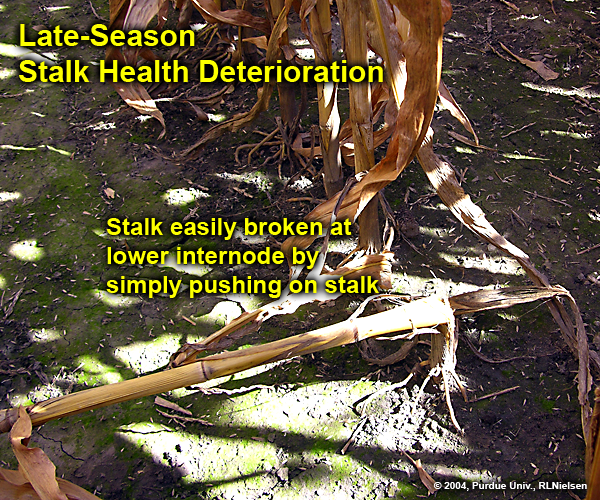
NOTE: Even if significant stalk rot does not develop in such stressed plants, loss of structural stalk integrity itself can greatly increase the risk of stalk breakage.
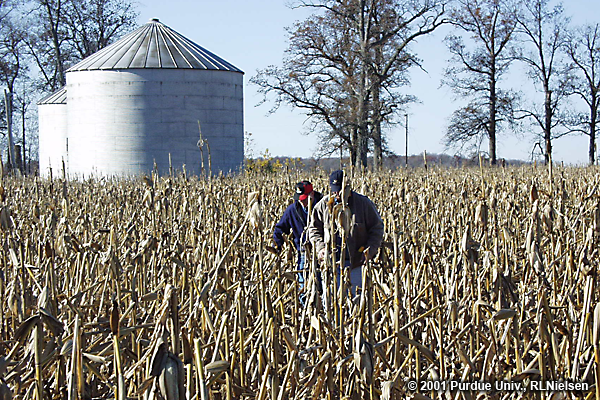
Fields at higher risk for weakened stalks and stalk rot development will be those where plants have managed to set fairly decent ears but have experienced severe stress during grain fill. Common photosynthetic stresses that occur during grain filling in Indiana include drought stress, nitrogen deficiency, and foliar leaf diseases. The effects of dry weather during August on corn stalk health are accentuated where compacted soils restricted root growth earlier in the season or on sandy soils with minimal water-holding capacity.
Growers should monitor stressed fields in late August and early September for compromised stalk strength or the development of severe stalk rots and adjust their harvest schedules accordingly to harvest these fields early in the season to avoid the consequences of severe stalk lodging.
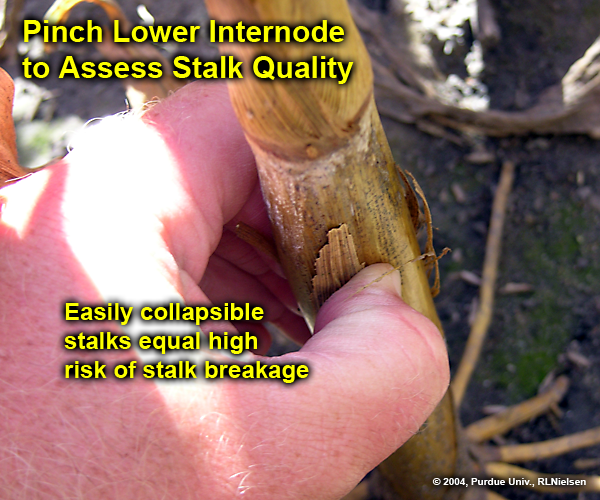
Stalk breakage itself is obviously easy to spot when scouting a field. However, compromised stalks may stand unnoticed until that October storm front passes through and brings them to their proverbial knees. The simplest techniques for identifying suspect stalk quality involve either pushing on stalks to see whether they will collapse or bending down and pinching the lower stalk internodes to see whether they collapse easily between your fingers.
TIP: Bending down to pinch lower stalk internodes may qualify as an aerobic exercise if you check enough stalks.
Fields and/or hybrids at high risk of stalk breakage should be harvested as early as possible to minimize the risk of significant mechanical harvest losses. Recognize that hybrids can vary greatly for late-season stalk quality even if grown in the same field due to inherent differences for late-season plant health or resistance against carbohydrate remobilization when stressed during grain fill.


Related References
Lee, Chad. 2007. Weak Corn Stalks from Drought. Corn & Soybean News, Univ. of Kentucky. [On-Line]. Available at <http://www.uky.edu/Ag/CornSoy/cornsoy7_7.htm> [URL accessed 9/1/08].
Mills, Dennis, Pierce Paul, and Peter Thomison. 2006. Corn Stalk Rot: A Disease Caused by Several Different Fungi. C.O.R.N. Newsletter, Ohio State Univ. [On-Line]. Available at <http://corn.osu.edu/story.php?setissueID=155&storyID=932> [URL accessed 9/1/08].
Nielsen, R.L. (Bob). 2007. Grain Fill Stages in Corn. Corny News Network, Purdue Univ. [On-Line]. Available at <http://www.kingcorn.org/news/timeless/GrainFill.html> [URL accessed 9/1/08].
Shaner, G. and D. Scott. 1998. Stalk Rots of Corn. Purdue Univ. Extension Publication BP-59. Available online at <http://www.ces.purdue.edu/extmedia/BP/BP-59.pm65.pdf> [URL accessed 9/1/08].
Thomison, Peter, Pierce Paul, and Dennis Mills. 2008. Dry Weather May Lead to Stalk Lodging Problems in Corn. C.O.R.N. Newsletter, Ohio State Univ. [On-Line]. Available at <http://corn.osu.edu/story.php?setissueID=248&storyID=1559> [URL accessed 9/1/08].
Vincelli, Paul. 2004. Factors That Could Enhance Stalk Rots in Corn. Kentucky Pest News (Aug 2). Univ. of Kentucky. Available online at <http://www.uky.edu/Agriculture/kpn/kpn_04/pn040802.htm#corrot> [URL accessed 9/1/08].
![]()
Field Drydown of Mature Corn Grain - (Bob Nielsen)
- Weather conditions are the major influence on in-field grain drydown.
- Plant characteristics can also influence in-field grain drydown.
- Early grain maturation usually means faster in-field grain drydown.
- Later grain maturation usually means slower in-field grain drydown.
Grain moisture content at harvest obviously influences growers’ cost of artificially drying the grain after harvest. An early drydown of the crop also facilitates early or at least timely harvest of the crop prior to the colder and, often, wetter conditions of late fall.
Kernel moisture content decreases as the kernel develops through the blister stage (~ 85% moisture), milk stage (~ 80% moisture), dough stage (~ 70% moisture), dent stage (~ 55% moisture), and finally physiological maturity (~ 30% moisture). Prior to physiological maturity, decreases in kernel moisture occur from a combination of actual water loss (evaporation) from the kernel plus the continued accumulation of kernel dry matter via the grain filling process. After physiological maturity, percent kernel moisture continues to decrease primarily due to water loss from the kernel.
Weather & Timing of Grain Maturation
Grain moisture loss in the field occurs at a fairly linear rate within a range of grain moisture content from about 40 percent down to 15 to 20 percent, and then tapers off to little or no additional moisture loss after that. Figure 1 illustrates changes in grain moisture content over time for an adapted medium maturity hybrid grown in Indiana in 1992 (unusually cool fall) and 1994 (more typical fall temperatures).

Fig. 1. Decrease in grain moisture content of a mid-maturity corn hybrid over time
(westcentral Indiana).
Field drying of mature corn grain is influenced primarily by weather factors (especially temperature and humidity) and, to a somewhat lesser degree, by ear and husk characteristics of hybrids. Simply put, warmer temperatures and lower humidity encourage rapid field drying of corn grain (Fig. 2).

Fig. 2. Average daily grain moisture loss (percentage points/day) relative to average daily air temperature during the drydown period for three corn hybrids planted late April to early May, 1991-1994, westcentral Indiana.
Because grain drydown rates are greater when the drydown period is warmer, it stands to reason that a corn crop that matures in late August will dry down faster than one that matures in mid-September. In fact, there is a close relationship between the date when the grain nears physiological maturity (half-milkline or 2-3 weeks prior to kernel blacklayer) and the subsequent average daily drydown rate. Average daily drydown rates will range from about 0.8 percentage point per day for grain that nears maturity in late August to about 0.4 percentage point per day for grain that nears maturity in mid- to late September (Fig 3).
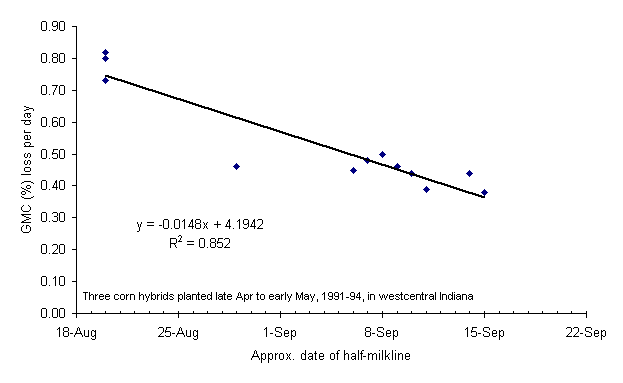
Fig. 3. Relationship between daily grain moisture loss (drydown) and the date at which the grain nears maturity (half-milkline) for three corn hybrids planted late April to early May, 1991-1994, westcentral Indiana.
Bear in mind that grain moisture loss for any particular day may be quite high or low depending on the exact temperature, humidity, sunshine, or rain conditions that day. It is not unheard of for grain moisture to decline more than one percentage point per day for a period of days when conditions are warm, sunny and dry. By the same token, there may be zero drydown on cool, rainy days.
Hybrid Variability for Field Drying
Hybrid variability for the rate of grain moisture loss during post-maturity drydown and the eventual grain moisture content at harvest are of great interest to grower and seed industry alike. Growers desire hybrids with superior yielding ability (maximum gross income) that also dry very quickly in the fall (minimum drying or grain shrinkage costs).
The seed industry uses grain moisture content data to assign relative hybrid maturity ratings on the basis of relative moisture differences among hybrids at harvest. Two hybrids that differ in one “day” of relative maturity will typically vary by about one half percentage point of grain moisture content (an average daily loss of moisture) if planted and harvested on the same days. Recognize that relative hybrid maturity ratings are most consistent within, not among, seed companies.
When weather conditions are not favorable for rapid grain drydown, then hybrid characteristics that influence the rate of grain drying become more important. Researchers have identified the following traits or characteristics as ones most likely to influence grain drying in the field. The relative importance of each trait varies throughout the duration of the field drydown process and, as mentioned earlier, is most influential when weather conditions are not conducive for rapid grain drying.
• Husk Leaf Number. The fewer the number of husk leaves, the more rapid the grain moisture loss. In fact, modern hybrids have fewer husk leaves than those commonly grown years ago.
• Husk Leaf Thickness. The thinner the husk leaves, the more rapid the grain moisture loss.
• Husk Leaf Senescence. The sooner the husk leaves senesce (die), the more rapid the grain moisture loss.
• Husk Coverage of the Ear. The less the husk covers the tip of the ear, the more rapid the grain moisture loss.
• Husk Tightness. The looser the husk covers the ear, the more rapid the grain moisture loss.
• Ear Declination. The sooner the ears drop from an upright position after grain maturation to a downward position, the more rapid the grain moisture loss. In particular, husks of upright ears can “capture” rainfall.
• Kernel Pericarp Characteristics. The pericarp is the outermost layer of a corn kernel (botanically; the ovary wall). Thinner or simply more permeable pericarp layers have been associated with faster drying rates in the field.
Final Trivia For Coffeeshop Conversations
Post-maturity grain moisture loss occurs primarily by evaporative loss from the kernel itself. Research many years ago established that post-maturity moisture loss through the kernel connective tissues (placental tissues) back to the cob is essentially non-existent (Kiesselbach and Walker, 1952). As those tissues cease to function (associated with the onset of physiological maturity), the moisture and nutritional connection between kernel and cob is essentially broken.
Related References
Cavalieri, A.J. and O.S. Smith. 1985. Grain Filling and Field Drying of a Set of Maize Hybrids Released From 1930 to 1982. Crop Sci. 25:856-860.
Crane, P.L., S.R. Miles, and J.E. Newman. 1959. Factors Associated With Varietal Differences in Rate of Field Drying in Corn. Agron. J. 51:318-320.
Kiesselbach, T. A. and Elda R. Walker. 1952. Structure of Certain Specialized Tissue in the Kernel of Corn. Am J Bot 39:561-69
Nielsen, R.L. (Bob). 2007. Grain Fill Stages in Corn. Corny News Network, Purdue Univ. [On-line]. Available at <http://www.kingcorn.org/news/timeless/GrainFill.html> [URL accessed 7/29/08].
Troyer, A.F. and W.B. Ambrose. 1971. Plant Characteristics Affecting Field Drying Rate of Ear Corn. Crop Sci. 11:529-531.
![]()
Corn Crop Continues Slow Progress - (Bob Nielsen)
The Indiana corn crop continues to lag in its race to the finish of the 2008 growing season. The slow planting pace coupled with a relatively cool May and early June put the corn crop about 2 weeks behind the 5-year average by the time pollination occurred in July (Fig 1). Statewide crop progress has continued to lag about 2 weeks behind the 5-year average throughout the grain filling period (Fig’s 2 - 3), in part due to the relatively cool temperatures throughout much of August.
The progress of Indiana’s corn crop to date this year has tracked closely with that of the 2003 crop. If it continues to do so, then Indiana growers can expect that crop maturity will similarly lag about 2 weeks behind the 5-year average (Fig. 4), with the latter half of the state’s crop likely maturing after late September with the prospects of some of the crop possibly not maturing safely prior to a killing fall freeze (Nielsen, 2008b). Later maturity of the crop will obviously translate to a later harvest of the crop (Fig. 5).
Not only will the harvest of the 2008 crop be delayed, but grain moisture at harvest will likely be higher (Fig. 6). Grain that matures later in the season does so in a time frame that is usually relatively cooler and so daily field drydown rates will be less (Nielsen, 2008a). The prospects of wetter grain at harvest and higher fuel costs to artificially dry the grain, coupled with the higher risk of poor stalk health this year (Nielsen, 2008c) certainly dampen the spirits of many corn growers as the fall harvest season approaches. Warmer than normal temperatures throughout September would go a long ways to help this crop mature a bit sooner than expected and to facilitate more rapid field drying of the grain prior to harvest.
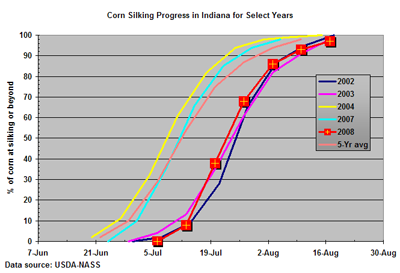
Fig. 1. Corn silking progress in Indiana for select years. Adapted from data published by USDA-NASS.
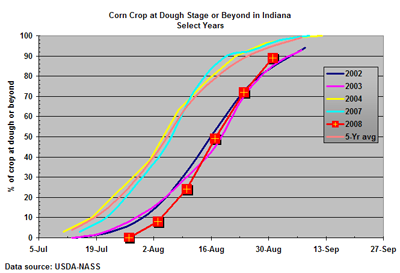
Fig. 2. Percent of Indiana’s corn crop at dough stage or beyond for select years. Adapted from data published by USDA-NASS.
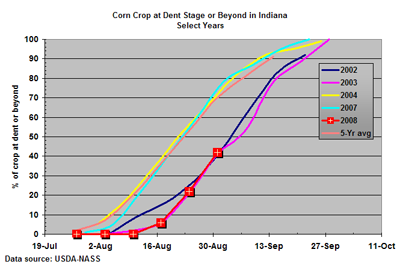
Fig. 3. Percent of Indiana’s corn crop at dent stage or beyond for select years. Adapted from data published by USDA-NASS.

Fig. 4. Percent of Indiana’s corn crop mature and safe from frost for select years. Adapted from data published by USDA-NASS.
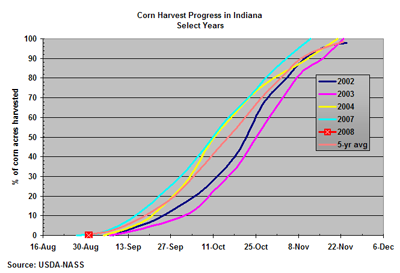
Fig. 5. Percent of Indiana’s corn crop harvested for select years. Adapted from data published by USDA-NASS.
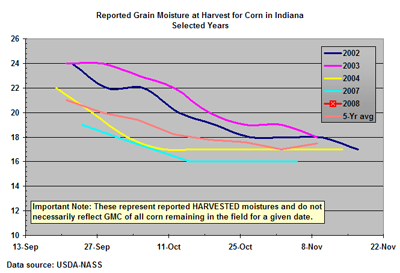
Fig. 6. Reported grain moisture content (GMC) at harvest for corn in Indiana for select years. Adapted from data published by USDA-NASS.
Related References
Nielsen, R.L. (Bob). 2008a. Field Drydown of Mature Corn Grain. Corny News Network, Purdue Univ. [On-line]. Available at <http://www.kingcorn.org/news/timeless/GrainDrying.html>. [URL accessed 9/3/08].
Nielsen, R.L. (Bob). 2008b. Late Planted Corn: Enough Time to Mature? Corny News Network, Purdue Univ. [On-line]. Available at <http://www.kingcorn.org/news/articles.08/DaysAfterSilk-0729.html>. [URL accessed 9/3/08].
Nielsen, R.L. (Bob). 2008c. Stress During Grain Fill: A Harbinger of Stalk Health Problems. Corny News Network, Purdue Univ. [On-line]. Available at <http://www.kingcorn.org/news/timeless/StalkHealth.html>. [URL accessed 9/3/08].
USDA-NASS. 2008. Crop Progress. USDA Nat’l Ag Statistics Service. [On-line]. Available at <http://usda.mannlib.cornell.edu/MannUsda/viewDocumentInfo.do?documentID=1048>. [URL accessed 9/3/08].
![]()
Potassium Deficiency on Young Soybean Leaves? - (Jim Camberato1 Gail Ruhl2 and Kiersten Wise2
1Agronomy Department, Purdue Univ., West Lafayette, IN. 2Department of Botany and Plant Pathology, Purdue Univ., West Lafayette, IN)
Soybeans in Iowa, Wisconsin, and Indiana are showing potassium (K) deficiency symptoms. Although the symptoms are classic in many respects, one aspect of their occurrence differs from the norm -- the symptoms are occurring on the youngest uppermost leaves, oddly enough, rather than on the older lower leaves. Iowa State Extension specialists described this condition in Iowa several years ago and saw it again last year, referring to it as ‘Soybean Top Dieback’. X.B. Yang and John Sawyer describe the condition in the newsletter article Soybean Top Dieback Shows up in Iowa Again <http://www.extension.iastate.edu/CropNews/2008/0822yangsawyer.htm>.
Low soil test K, and the fungi Phomopsis and Diaporthe seem to be associated with Soybean Top Dieback but there is no solid evidence on what conditions cause the problem. There is also anecdotal evidence that soybean cyst nematode (SCN) populations may be higher in fields exhibiting Soybean Top Dieback. However, SCN and the fungi Phomopsis and Diaporthe have not been proven as pathogens for this ‘disease’.
Samples from Indiana fields exhibiting K deficiency symptoms on the upper leaves have been sent to the Purdue Plant and Pest Diagnostic Laboratory (PPDL) both this year and last year. Although Phomopsis and Diaporthe spp. were isolated last year from soybeans exhibiting these symptoms, there is no proven correlation between the presence of these fungi and the top dieback symptoms.
Tissue analysis of soybeans showing symptoms of Soybean Top Dieback from three different Indiana fields this year showed only 0.60% K in the uppermost fully expanded trifoliate leaf, well less than ½ the critical level. Soil test K levels in these soils were extremely low, <55 ppm for soils with cation exchange capacity ranging from 8 to 18 meq/100g. Potassium deficiency may not have shown up earlier in the season because of the high moisture conditions that are known to increase K uptake.
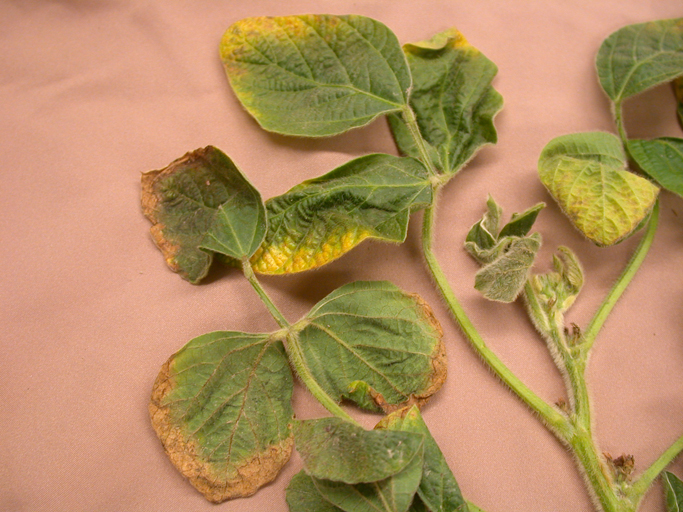
Close-up of soybean leaf showing potassium deficiency symptoms
If your soybean fields are showing Soybean Top Dieback consider sending plant samples to the PPDL for disease diagnosis and a soil sample to the nematology lab for nematode analysis. Dig plant samples and follow sample submission guidelines found at: <http://www.ppdl.purdue.edu/PPDL/samples.html> for disease samples and <http://www.entm.purdue.edu/nematology/services.html> for nematode samples. The sample handling fee for disease diagnosis is $11.00 per sample. There is a separate charge for nematode analysis. At the same time submit leaf and soil samples for nutrient analysis to a commercial laboratory.
Potassium deficiency is often confused with SCN damage, and in fields where SCN populations are high, low-potassium conditions can intensify SCN symptoms. Identifying fields with high SCN populations and low soil test K should enable improved management of next year’s crop by controlling those two issues. If Phomopsis or Diaporthe infection is confirmed in the sample, avoid saving seed from the sampled field as these diseases are capable of infecting seed and establishing disease through seed transmission.
For more information contact Jim Camberato (765-496-9338, jcambera@purdue.edu or Kiersten Wise (765-496-2170, kawise@purdue.edu.
![]()
Click here to view the Black Light Trap Catch Report
![]()