
Pest & Crop Newsletter, Entomology Extension, Purdue University
Western Bean Cutworm Moths Flying – (John Obermeyer and Larry Bledsoe)
- Moth captures are just beginning.
- Scouting in northwestern Indiana counties for egg masses/young larvae should begin.
- Ear damage more likely from corn earworm.
Like last year, pheromone trap cooperators are beginning to capture western bean cutworm moths. It is too early to speculate on this year’s flight intensity, but numbers so far are lower than last year. In addition, there are more trapping sites this year. You can track future Indiana, and other Midwestern state captures, via the Western Bean Cutworm Monitoring Network at <http://www.ent.iastate.edu/trap/westernbeancutworm/> and click on “Trap Sites” under the Site Navigation on the left hand side.
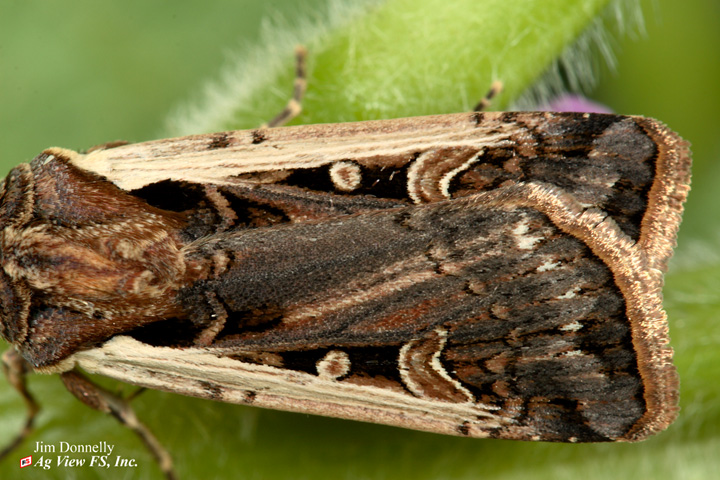
Close-up of western bean cutworm moth (Photo credit: Jim Donnelly Ag ViewFS)
Scouting and treatment guidelines are likely only a concern for northwestern counties, where moth numbers have been highest and damage was observed last year. University of Nebraska entomologists have known this sporadic pest for decades. They suggest that egg scouting begin once moths become active. In five different areas of a field, inspect 20 consecutive plants for egg masses which are laid on the upper surface of the top leaves of corn and/or larvae that may have hatched and crawled to the whorl and begun to feed. A treatment threshold of 8% of the plants with an egg mass and/or larvae in the whorl is suggested. Timelomess is critical, because as soon as pollination begins, larvae will make their way into the ear via the silks and become impervious to insecticides. This threshold has recently been tweaked by crop consultants, and suggested by Iowa State University, to be about 5% of plants infested because of higher commodity prices.
Last year, damage from this pest was found only in occasional fields in northwestern counties. Hot spots within a field had numerous ears infested, but usually only one worm was found and damage was primarily in the ear tips. Corn earworm damage will look similar to the untrained eye. Considering the number of earworm moths captured in pheromone traps this spring, earworm appears to be the greater threat for corn ears, especially for the many late planted fields throughout Indiana. Unlike western bean cutworm, earworm moths prefer to lay their eggs directly on corn silks, making scouting very difficult.
In the weeks to follow, we will keep you abreast of observations shared from others concerning these ear-attacking insects. Too, we’ll post photos to help in worm identification. Till then…happy scouting!
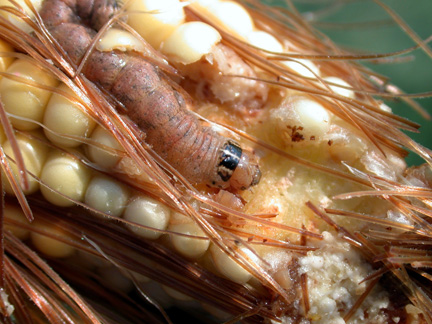
Western bean cutworm damaging ear tip
![]()
Potato Leafhoppers in Soybeans - (John Obermeyer and Larry Bledsoe)
- Yellow and distorted soybean leaves may be caused by several factors, one of them being leafhoppers.
- Abundant moisture will alleviate most leafhopper feeding and may lead to their demise.
- Treatment for leafhoppers on our soybean lines is usually not necessary.
Potato leafhoppers are in an abundant supply this year, just look at your windows at night! Some have wondered whether the leafhoppers could be causing the soybean discoloration and leaf puckering showing up in some fields. Although most soybean lines that we normally grow are resistant to leafhopper attack (“hairy” leaf surface), we do occasionally see some feeding damage caused by this insect. Yellowing and crinkling of soybean foliage could be due to leafhoppers, but there are a number of factors that more often cause this situation to develop, including diseases, potassium deficiency, nitrogen deficiency, herbicide injury, nematodes, twospotted spider mite, water-logging, etc.
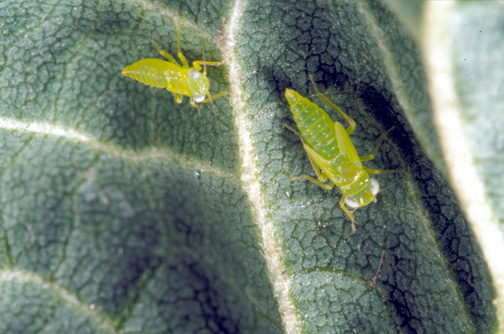
Potato leafhopeer nymphs on soybean leaflet
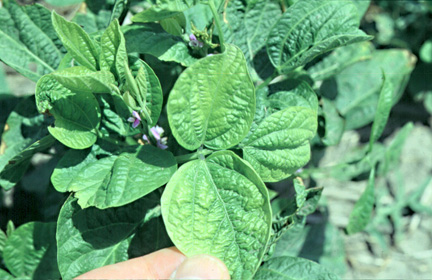
Symptoms of potato leafhopeer damage on soybean
There have been questions concerning at what point one becomes concerned with the density of leafhoppers and their damage. First of all, this has been a wet year in Indiana (somewhat of an understatement). Since the potato leafhopper is a sucking insect, it generally causes its greatest damage to plants in fields with droughty conditions. Where moisture is abundant, they rarely cause problems.
When the conditions are conducive to damage occurring, it normally takes approximately 1 or more leafhoppers per trifoliolate leaf at flowering (R1-2 growth stages) or 2 or more leafhoppers per trifoliolate leaf at mid pod development (R5.5 growth stage) to cause problems. Leafhoppers populations this high will be obvious as they kick-up while you’re walking through the field. We’ve had populations reported at these densities in some fields of late V(n) to R1, but they are not likely to suffer economic damage (even at present commodity prices) because adequate moisture is present. If droughty conditions are noted and leafhoppers are at or above threshold levels, a control may be needed.
Watch suspect fields over the next several weeks for leafhoppers, consider that populations may begin their natural decline sometime within the next several weeks. The decline may occur sooner if an epizootic of the pathogenic fungus, Zoophthora radicans, occurs which is favored by warm-muggy conditions. This condition has been reported in the Midwest in the past, especially in alfalfa.
![]()
Soil Sampling for Assessing Plant Available N in Previously Flooded Soils – (Jim Camberato and Bob Nielsen)
- Concentrate sampling in fields whre nitrogen (N) loss was likely.
- Use appropriate sampling techniques if N sources were banded.
- Take a 1-2' deep sample in addition to a 0-1' deep sample for greater information, especially in sandy soils.
- Request exchangeable ammonium-N as well as nitrate-N if the field was recently fertilized.
Sidedressing of fertilizer nitrogen is essentially complete for cornfields planted in late April and early May, but may yet occur for late-planted or replanted fields that were a result of the excessive rainfall and flooding that occurred throughout Indiana. We’ve been thinking about methods for estimating the amount of soil nitrogen remaining in these fields if they were fertilized prior to the rains and floods. The accuracy of what we propose in this article is not well-documented, but we believe the method will nevertheless be useful in helping growers assess the potential for N loss in affected fields.
Soil Sample Fields Where N Loss Was Likely
The three major forms of nitrogen (N) found in common N fertilizers are ammonium, urea, and nitrate. The ammonium and urea forms of N must convert to nitrate before substantial N loss can occur. Where urea or 28% UAN was applied more than 2 weeks before or where anhydrous ammonia was applied more than 4 weeks before the onset of the heavy June rains, most of the fertilizer N was likely already in the susceptible nitrate form. Less fertilizer N may have converted to nitrate where urea or 28% UAN was applied 1 to 2 weeks before or where anhydrous ammonia was applied 3 to 4 weeks prior to the rains.
If most of the fertilizer N was in the nitrate form, then ponding, flooding, or soil saturation for 3 days or more likely caused significant N loss in silt loam and heavier soils. In sandy soils, rainfall amounts greater than 4 inches that infiltrated the soil (versus running off) likely resulted in significant leaching of soil nitrate below the root zone. Fields where these conditions occurred are candidates for soil N sampling.
Soil Sampling Strategies
Sample field areas where N loss is suspected separately from those areas where N loss is suspected to be minimal. Sampling both areas will allow you to compare soil N in the two areas and may help you determine if N loss or flooding stress is the cause of yellow stunted corn.
Collect soil cores for soil nitrate analyses to a depth of at least 1 foot. Where earlier-applied fertilizer N was broadcast rather than banded, collect 20 to 30 soil cores per sample. Where earlier-applied fertilizer N was banded (e.g., anhydrous ammonia), collect 15 to 20 soil cores using the sampling scheme illustrated in the Figure 1. Consider collecting a separate deeper soil sample from between 1- and 2-foot deep for a more complete assessment of plant available N, especially in sandy soils where leaching through the soil profile is the predominant form of N loss.

Figure 1. Recommended soil sampling pattern in relation to two corn rows when N fertilizer has been banded with the row. Always sample perpendicular to the direction fertilizer was applied. (Source of image: Brouder & Mengel, 2003).
Sample Handling
Dry or refrigerate your soil samples as soon as possible to stop the soil microbes from altering N levels. Spread the soil thinly on plastic to air dry and hasten drying with a fan if possible. Otherwise refrigerate the samples and keep them cold through shipping to the lab. A list of certified soil testing laboratories is available at <http://www.agry.purdue.edu/ext/soiltest.html> (URL accessed 7/3/08). Most should offer soil N test analysis services, but contact them first to confirm.
Soil-Test Laboratory Analyses
Ammonium is just as plant available as nitrate, but typically little accumulates in the soil because it is readily converted to nitrate under most conditions. However, if fertilizer was recently applied, there may well yet be some ammonium N available in the soil for plant use.
When you submit the soil samples to the soil-testing laboratory, request analyses for exchangeable ammonium as well as for nitrate, particularly if anhydrous ammonia was applied relatively recently or a nitrification inhibitor was used with the N fertilizer. Significant levels of soil ammonium are most likely if anhydrous ammonia was the N source, a nitrification inhibitor such as N-Serve™ or DCD was used, or soil pH was low (around 5.0). In these situations, low soil test levels of soil nitrate may indicate little conversion of ammonium to nitrate, rather than simply loss of nitrate.
If soil test values for ammonium and nitrate are reported as ppm or mg/L nitrogen (NH4-N or NO3-N), then pounds per acre of available N are calculated by multiplying the test results by 4 when the sample depth was 1 foot. For other sample depths, divide the sample depth (in inches) by 3 and then multiply by the test results.
Example: Soil NO3-N in a 1-foot sample was 30 ppm.
Conversion from ppm to pounds per acre is (12 inches / 3) x 30 ppm = 120 pounds per acre.
If soil test values are reported directly as NH4 or NO3, then these values must be converted to an ‘N’ basis first. The calculations are: NH4-N = NH4/1.2 and NO3-N = NO3/4.5.
Example: Soil NO3 was reported to be 90 ppm.
Conversion from NO3 to NO3-N is 90 ppm NO3 / 4.5 = 20 ppm NO3-N.
Interpreting Soil Nitrate and Ammonium Levels
In our opinion, soil nitrate and ammonium levels can be used to guide additional N applications to fields subjected to saturation and flooding. However, there are admittedly no hard and fast research-based recommendations for this particular situation.
The primary tool for soil N sampling in the Eastern Corn Belt has been the pre-sidedress soil nitrate test (PSNT) which is most applicable as an indicator of N availability in soils where manure had been applied or a legume such as clover or alfalfa had been plowed down (Brouder & Mengel, 2003). For these field situations, the level of soil nitrate found is considered an index of N availability, i.e., an indicator of how much N is currently available AND how much N may become available from the manure or organic matter. When used in this context, soil NO3-N levels greater than 25 ppm are thought to be adequate for optimum corn yield without the addition of more fertilizer N. During the research that developed this soil test, sampling deeper than 1 foot or analyzing for exchangeable ammonium did not increase the predictive ability of the PSNT enough to warrant the extra effort.
However, when the intent is to assess the loss of N due to rainfall, we suggest that deeper sampling plus analysis for ammonium content can provide useful information to help growers decide whether additional fertilizer N is merited. It is important to recognize that in this context, measurements of soil nitrate and ammonium following fertilizer N applications indicate current N availability only, because there is no manure- or legume-derived N to be released later in the season. Considering this fact, the commonly accepted 25 ppm NO3-N critical level for manure- or legume-N fertilized soils may be too low for soils that have only received fertilizer N.
Leaching of soil nitrate is expected with ponding, flooding, or soil saturation, but not all of the nitrate will be moved below the root zone. A shortcoming of the 1-foot sampling depth is that it does not always reflect plant available N deeper in the profile, particularly when abnormal leaching occurs. This is why we suggest also sampling from the 1- to 2-foot depth for assessment of soil N availability in sandy soils.
In our on-going N rate trials conducted throughout the state, the “normal” background levels of soil N in the upper 1 foot of mineral soils typically range from 5 to 10 ppm NO3-N and 4 to 8 ppm NH4-N for corn grown in rotation with soybean or corn without manure- or legume-derived N. Typically the deeper 1- to 2-foot soil samples would have slightly lower N levels.
Making a Decision
Many soil fertility specialists in the Midwest suggest adhering to the usual critical level of 25 ppm NO3-N for determining when no additional N is needed after the recent heavy rains. We suggest that this level of soil NO3-N may be insufficient where N loss conditions have been severe. Areas of Indiana had as much as 14 inches of rainfall in a two-week period that certainly resulted in high probabilities of substantial N loss. We suggest this level of rain has depleted the lower soil profile as well as the upper foot of soil.
The accompanying table contains estimates of expected soil NO3-N levels with different fertilizer rates assuming “normal” background levels of nitrate and ammonium at the time of fertilization and a “normal” amount of movement below the one foot sampling depth (approximately 1/3 of the fertilizer N is moved below the 1-foot sampling depth but retained within the root zone with normal rainfall). If the corn is healthy and the growing season typical from here on out, we would suggest applying no more than 10 pounds of N for every 2 ppm reduction in soil sample N below the expected levels listed in the table.
Recognize that as a healthy crop moves through the rapid growth phase prior to pollination, soil N levels will naturally decrease in response to rapid N uptake by the plants. However, by the time a healthy crop reaches the V9 leaf stage (about 30 inches tall), only 19 lbs/ac N (equivalent to 5 ppm soil NO3-N) have typically been taken up the plants (Mengel, 1995). However, by the time a healthy crop reaches shoulder-high (~ V15 or 60 inches tall), approximately 116 lbs/ac N (equivalent to 29 ppm soil NO3-N) have been taken up by the plants.
The following examples give you an idea of how the tabular information may be used to make this decision.
Example calculation when only NO3-N is determined:
Fertilizer N was applied at 160 pounds of N per acre in April as 28% UAN in southern Indiana. Only soil NO3-N analysis was requested because it was assumed that most of the urea- and ammonium-N had been converted to nitrate since temperatures were warm for many weeks prior to the late May/early June rain. The expected NO3-N level from the table below for a 160-lb N application is 35 ppm. Laboratory results indicated only 20 ppm NO3-N. The suggested N application rate would be: ((35 ppm – 20 ppm) / 2) x 10 = (15 ppm / 2) x 10 = 7.5 x 10 = 75 pounds per acre.
Example calculation when both NO3-N and NH4-N are determined:
Anhydrous ammonia was applied at 160 pounds of N per acre in mid May in northern Indiana. Since temperatures were warm for only 2 weeks prior to the late May/early June rain, both NO3-N and NH4-N analysis of soil samples were requested. The expected NO3-N plus NH4-N levels listed in the table for a 160-lb N application is 41 ppm. Laboratory results indicated 15 ppm NO3-N and 20 ppm NH4-N for a total measured N level of 35 ppm. The suggested N application rate would be: ((41 ppm – 35 ppm) / 2) x 10 = (6 ppm / 2) x 10 = 3 x 10 = 30 pounds per acre.
Table 1. Expected levels of nitrate (NO3-N) and NO3-N plus ammonium (NH4-N) in the upper 1-foot of soil. NOTE: Use the NO3-N column if this is the only form of N measured in your soil sample. Add NO3-N and NH4-N levels together if both forms of N are measured in the soil sample and use the last column to assess N supply. |
||
Fertilizer N Applied Prior to Rains |
Nitrogen Analysis |
|
NO3-N* |
NO3-N + NH4-N** |
|
lb/acre |
Expected N levels ppm or mg/L N |
|
130 |
30 |
36 |
140 |
31 |
37 |
150 |
33 |
39 |
160 |
35 |
41 |
170 |
36 |
42 |
180 |
38 |
44 |
190 |
40 |
46 |
200 |
41 |
47 |
210 |
43 |
49 |
220 |
45 |
51 |
*Assumes background level of ammonium at 6 ppm and "normal" levels of soil N below the 1-foot sampling depth. |
||
Response to Late-Season Nitrogen Applications
Less than normal rainfall during the remaining part of the growing season following late N fertilizer application can limit yield response to the added N because of limited movement of the applied N in the soil solution and limited root function in the dry upper soil layers, so consider this risk when determining whether applying supplemental N will be useful. Similarly, growers need to assess the overall vigor of a stand of corn that survived earlier ponding or flooding events. Remember that the stunting and discoloration of corn following such events is not entirely due to a loss of soil nitrogen. Root damage that occurred as a result of the anaerobic (saturated) soil conditions contributes greatly to the initial onset of yellowing and stunting.
The greater the delay in N application beyond the initiation of the rapid growth phase of corn (beyond about leaf stage V8), the lower the yield benefit of additional N. However, a healthy corn crop can respond economically to N applied very late in the season even though maximum potential yield may not be attained. Scharf et al. (2002) reported from N rate trials with healthy corn that “little or no evidence of irreversible yield loss when N applications were delayed as late as stage V11, even when N stress was highly visible. There was weak evidence of minor yield loss (about 3%) when N applications were delayed until stage V12 to V16.”
In a study conducted in 2007 by one of our graduate students (Dan Emmert) at the Pinney Purdue Agricultural Center in northwest Indiana, 35 pounds of N per acre applied at V13 increased yield 18 bu/ac in plots where only starter N (25 lbs N/ac) was applied (a low N supply situation similar to what growers may face with severe N loss). Application of 70 pounds of N per acre at V13 increased yield an additional 17 bushels per acre. Higher N rates did not increase yield any further.
At two other locations in the Lafayette area, 35 pounds of N per acre applied at V14 or V16 increased yield 18 bushels per acre when only starter was applied. However, 70 lbs/ac did not increase yield any further likely because those locations received extremely limited rainfall following the late N application.
Acknowledgements
Our colleague Brad Joern assisted in the preparation of this article.
Related References
Blackmer, A.M., D. Pottker, M.E. Cerrato, and J. Webb. 1989. Correlations between soil nitrate concentrations in late spring and corn yields in Iowa. J. Prod. Agric. 2:103-109.
Brouder, Sylvie and David Mengel. 2003. The Presidedress Soil Nitrate Test for Improving N Management in Corn (AY-314-W). Purdue Extension. [On-line]. Available at <http://www.agry.purdue.edu/ext/pubs/AY-314-W.pdf>. [URL accessed 6/30/08].
Certified Soil Testing Laboratories. 2008. Purdue Agronomy Extension [On-line]. Available at <http://www.agry.purdue.edu/ext/soiltest.html>. [URL accessed 7/3/08].
Ferrer, Francesc, J.M. Villar, C.O. Stockle, P. Villar, and M. Aran. 2003. Use of a pre-sidedress soil nitrate test (PSNT) to determine nitrogen fertilizer requirements for irrigated corn. Agronomie 23:561-570.
Mengel, David. 1995. Roots, Growth, and Nutrient Uptake. Purdue Agronomy Extension Paper AGRY-95-08. [On-line]. Available at <http://www.agry.purdue.edu/ext/pubs/AGRY-95-08.pdf>. [URL accessed 7/3/08].
Scharf, Peter, William Wiebold and John Lory. 2002. Corn Yield Response to Nitrogen Fertilizer Timing and Deficiency Level. Agron. J. 94:435-441.
![]()
Possible Potential for Arrested Ear Development - (Bob Nielsen)
The prospects of selling $7 corn, or $8 corn, or $10 corn this fall increases the desire of any corn grower to do whatever it takes to maximize yield per acre to capitalize on these historic grain prices. Growers who have lost acres of corn to floodwaters or ponding are also anxious to maximize grain yield on their remaining acres as well as maximize the yield potential of corn that survived the numerous events of excessive rainfall.
Towards this end, the use of post-emergence applications of foliar herbicides, fungicides, insecticides, and fertilizers is more common today than ever before. In particular, some of these applications occur during the 1 to 2 week period preceding the onset of pollination. This time period coincides with the last stages of ear size determination and early stages of silk elongation by the developing ovules (Nielsen, 2007b).
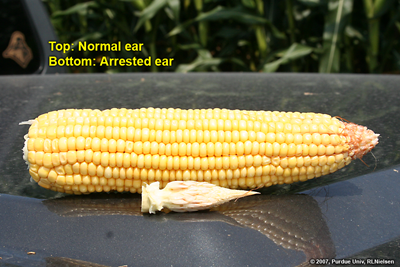
Some of the regulars down at the Chat ‘n Chew Cafe remember the problems with arrested ear development that were reported in 2007 in some fields treated with certain foliar fungicides, insecticides, and/or fertilizers. I described some of the symptoms in an article published last September (Nielsen, 2007c), but most could be described simply as a total or near total arrest of further ear development following the applications of these chemicals. The arrested ear symptoms in the affected fields were different from another form of arrested ear development that is referred to as “Blunt Ear Syndrome” (Nielsen, 2007a).
The primary common thread that linked all of the affected fields was the timing of a chemical application during the 1 to 2 week period preceding the onset of pollination. Applications of foliar fungicides captured most of the attention. Most of the reported fields were indeed treated with foliar fungicide, but many were treated with a combination of foliar fungicide plus insecticide, and some were treated with foliar fungicide plus fertilizer. Anectdotal reports suggested the worst of the arrested ears occurred in fields where the chemicals were applied with high-clearance spray applicators versus aerial applications.
To my knowledge, no one has conclusively diagnosed the specific causal factor that led to the arrested ear development in the affected fields last year. None of the fungicide labels appear to have been modified with cautions about the timing of application relative to crop growth stage (BASF, 2008; Bayer CropScience, 2008; Syngenta, 2008).
Update: As of 10 July, the manufacturer of one fungicide, has published a technical information bulletin on their Web site (BASF, 2008a) that includes a table that cautions against using adjuvants with their product prior to full tassel emergence and also states that the "optimal application timing" of their product is from VT (full tassel emergence) through R2 (kernel blister stage) or "prior to the onset of disease."
Nevertheless, I simply offer this fearmongering opinion that growers ought to be cautious about the application of foliar pesticides or fertilizers during this important phenological period leading up to pollination unless there is a demonstrated need to do so.
Related References
BASF. 2008. Headline fungicide label. [On-line]. Available at <http://www.cdms.net/ldat/ld62L047.pdf>. [URL accessed 7/8/08].
Bayer CropScience. 2008. Stratego fungicide label. [On-line]. Available at <http://www.agrian.com/pdfs/Stratego_Fungicide_(011008)_Label0.pdf>. [URL accessed 7/8/08].
Bradley, Carl. 2008. Making Profitable Fungicide Applications in Corn. The Bulletin. Univ of Illinois Extension. [On-line]. Available at <http://www.ipm.uiuc.edu/bulletin/article.php?id=976>. [URL accessed 7/8/08].
Loux, Mark M., Anthony F. Dobbels, Jeff M. Stachler, William G. Johnson, Glenn R.W. Nice, and Thomas T. Bauman. 2008. Rain Intervals, Spray Additives, and Maximum Crop Size for Postemergence Corn Herbicides. in “Weed Control Guide for Ohio and Indiana”. Purdue Univ. and Ohio State Univ. Extension. [On-line]. Available at <http://www.btny.purdue.edu/Pubs/WS/WS-16/CornRainFast.pdf>. [URL accessed 7/8/08].
Nielsen, R.L. (Bob). 2007a. Blunt Ear Syndrome in Corn. Corny News Network, Purdue Univ. [On-line]. Available at <http://www.kingcorn.org/news/articles.03/BeerCanEars-0812.html>. [URL accessed 7/8/08].
Nielsen, R.L. (Bob). 2007b. Ear Size Determination in Corn. Corny News Network, Purdue Univ. [On-line]. Available at <http://www.kingcorn.org/news/timeless/EarSize.html>. [URL accessed 7/8/08].
Nielsen, R.L. (Bob). 2007c. Symptomology of Arrested Ear Development in Corn. Corny News Network, Purdue Univ. [On-line]. Available at <http://www.kingcorn.org/news/articles.07/ArrestedEars-0904.html>. [URL accessed 7/8/08].
Syngenta. 2008. Quilt fungicide label. [On-line]. Available at <http://www.syngentacropprotection.com/pdf/labels/SCP1178AL6B0308.pdf>. [URL accessed 7/8/08].
![]()