
Pest & Crop Newsletter, Entomology Extension, Purdue University
- Rootworm Sampling in High Risk Fields
- Corn Borer Populations Are Generally Low
- Black Light Trap Catch Reports
Rootworm Sampling in High Risk Fields– (John Obermeyer and Larry Bledsoe)
- High-risk fields should be evaluated for rootworm larva and damage.
- Insecticide efficacy on early-planted corn is suspect.
- Stressed Bt-RW plants will likely have lower protein production.
- Larval sampling procedures are outlines.
- Rescue treatment guidelines are given below.
Rootworm larvae have been hatching and seeking corn roots for over a week in northern counties and two or more weeks in southern counties. When first hatched the larvae are very small and live mostly within the roots. As they increase in size, so does their appetite. They will feed both inside and outside of the roots, causing tunneling and pruning. It would be prudent to sample roots of plants in high-risk fields, especially where insecticide efficacy is in question. Too, the endotoxin (protein) production in Bt-RW corn that is stressed, e.g., yellowed, will be lower, which may reduce efficacy.
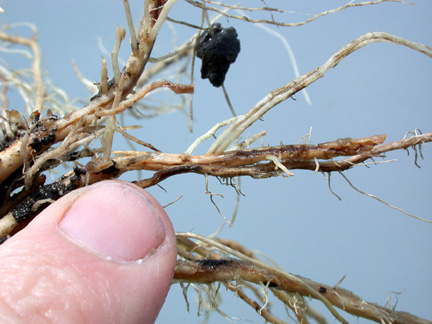
Rootworm scarring and tunneling from early feeding
To sample for rootworms, use a shovel and lift out the root mass and surrounding soil and place on a dark surface (black plastic garbage bags work well). Carefully break up the clods and sort through the soil. Look for 1/4 to 1/2 inch long, slender, creamy-white larvae with brownish-black heads and tails. Once the soil has been separated from the root mass, inspect it for root scarring and pruning. You may find the larvae under the leaf collars that are close to nodal roots; tear these leaves away to check. Also, you may even observe the rootworms sticking out of roots. Repeat this process with several plants representing different areas of a field. An average of two or more larvae per plant represents a rootworm population that signals the need for a rescue cultivation application.
Insecticides applied after planting should be directed toward the base of the plant. It is also important to throw soil up around plants to incorporate the insecticide and promote the establishment of brace roots. A good brace root system will help prevent plant lodging and reduce yield losses due to rootworm feeding. If a no-till field has an economic population of larvae, placing the insecticide on top of the ground will usually not be effective. The only exception may be if the soil insecticide is watered in through irrigation or rainfall (ideally ½” or more). Two liquid soil insecticides, Furadan 4F and Lorsban 4E, are labeled for post-emergent applications. If one decides to mix the insecticide with a liquid nitrogen source for a side-dress application, compatibility checks should be made. Broadcasting the insecticide will greatly diminish rootworm efficacy.
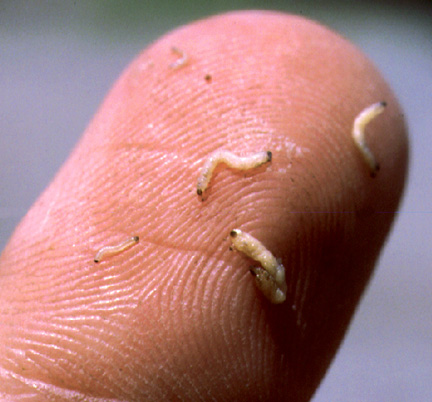
Different sizes of rootworm larvae
Watch a movie of rootworm larval sampling
![]()
Corn Borer Populations Are Generally Low - (John Obermeyer and Larry Bledsoe)
- European corn borer infestation levels are low in most fields.
- Infested fields are usually found too late.
- Before applying a control, determine if control is possible and/or economical.
For most non-Bt corn at this time, first generation European corn borer appears to be causing only minor damage. However, with the variability of planting dates in southern Indiana, cornfields that are further advanced may have been a “magnet” for egg-laying moths. These fields should be assessed soon, because once the borers have burrowed into stalks they are no longer treatable.
Therefore, pest managers should closely examine stalks for borer entry while scouting suspect fields. If treatment is necessary, it is recommended that the control material be applied before 1/3 of the borers have entered the stalk. Midvein leaf feeding indicates that stalk tunneling is soon to begin; frass accumulation in a leaf axil signals that the stalk has been entered by a borer.
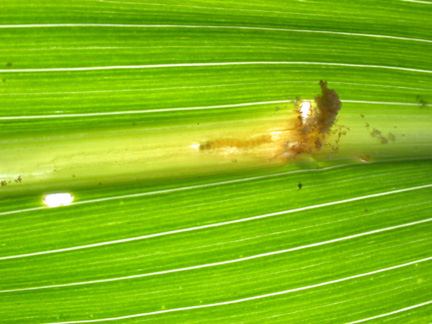
Corn borer in the midrib will soon burrow into the stalk
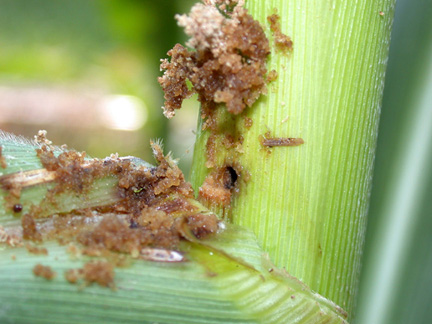
Corn borer in stalk is impervious to insecticides
![]()
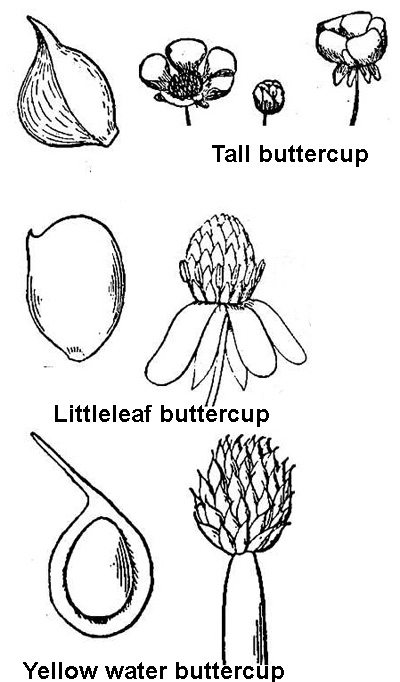
The Buttercups in Indiana – (Glenn Nice, Bill Johnson, and Adrienne M. Held)
The Short Story.
There are several buttercups found in Indiana. The buttercups are toxic plants and can cause poisonings in grazing animals; however, they are reported not to be toxic in hay. In almost all or at least in the most frequently encountered buttercups the flowers are yellow. These plants can be problematic in no-till crops, gardens, pastures, wheat, and waste areas. Fall or early spring applications of glyphosate + 2,4-D, Autumn [corn only], Princep [corn only] and Canopy XL + 2,4-D [soybean only] have provided excellent (90 to 100% control) control of smallflower buttercup. In grass pastures, Cimmaron, 2,4-D, and crossbow will provide good to excellent control of most buttercups. Dicamba’s control of buttercups may be a little more inconsistent ranging from fair to excellent. In winter wheat, Osprey, Olympus, Peak, and Harmony Extra have been reported to provide excellent control of smallflower buttercup. Always read and follow pesticide labels when using pesticides.
The Longer Story.
Introduction:
The word ‘buttercup’ is a common name that is associated with a fairly large group of plants. Although, they are predominantly in the genus Ranunculus spp. there are other important genera in this family, but we will leave that for another day and this article will focus on the genus Ranunculus spp. To complicate matters, the genus Ranunculus spp. also includes similar plants called the ‘spearworts’ and so the common name game goes on. In Indiana, there are approximately 20 species in this group of plants called the buttercups. Others can only be found in the Western US and Canada, yet others can be found only in the Southern US. Plants in the buttercup family (Ranunculaceae), also called the crowfoot family have a few characteristics that are typical to the family.

Buttercup (Photo Source: A. Held)
Buttercups, although considered attractive to some, can often be found in no-till row crops, wheat fields, pastures, and neglected areas. Dense populations of small flower buttercup have been observed in no-till studies in Southeast Indiana.
Identification:
Typically when thinking of buttercups many think single yellow flowers with five petals. In some cases that would be correct, but buttercup flowers can have a variable number of petals within the same species and some flowers are white or pink. However, in Indiana they are most often bright to light yellow. In some species the petals are waxy in appearance. One characteristic of the flowers that is consistent, but you have to take a good look, is that there are many reproductive structures within a flower. The many female components of the flower are born on a cone like structure in the center and the many male components surround the cone.
These cones in the middle of the flower will eventually become the fruit of the plant. When looking at the fruit of the Ranunculus I often think of a raspberry. The seeds are an achene that always has a notch or described as a beak in Britton and Brown’s “An Illustrated Flora of The Northern United States.” This ‘beak’ is often an identifying character of the species in question; it can be an indiscreet bump to a curled hook.
The leaves are variable even within a specific species1. They range from entire to many types of lobbing. Some are finely divided and others, as in the case of the basal leaves, can be rounded or kidney shaped. For simplicity sake, we will give identifying characteristics of only five buttercups; the buttercups that we may often encounter in agriculture.
Smallflower buttercup [R. parviflorus]² - This is an annual and can reach a mature height of 6 to 10 inches. Stem and petioles can be hairy. Basal leaves have long petioles and round leaves which are more or less 3-cleft and approximately 1 inch in diameter. The upper stem leaves are either short petioled or sessile (attached to the stem with out a petiole) and lobed into 3 to 5 linear to oblong lobes. Flowers are yellow and tiny, 0.06 to 0.2 inches wide. Close inspection of the flower will show small oblong petals a little longer than the calyx (the whorl of sepals below the flower, the ‘flowers cup’). The fruit is round and approximately 0.17 inches wide. The seed is an achene that is flat and has a sharp beak about 0.25% of its length. The surface of the achene has tiny bumps, but this will require a magnifying glass to see. Generally blooms in the summer months.
Tall buttercup [R. acris]² - This buttercup is a perennial and can reach a height of 2 to 3 feet tall. This buttercup is also hairy. The upper portion of the stems can branch. The basal leaves are tufted and divided 3 to 7 lobes and the margins of the lobes can be further indented. The upper leaves have short petioles and are divided 3 times. Flowers are bright yellow with a waxy appearance and about 1 inch wide. The petals are 2 to 3 times longer than the calyx and round. The fruit is bulbous and 0.5 to 0.6 inches wide. The achene has a short sharp beak.
Harvey’s buttercup [R. harveyi]² - This buttercup is also a perennial. It is branched and can reach a height of 8 to 18 inches tall. Harvey’s buttercup does not have any hair; it is ‘glaborous’. It tends to branch as you move up the stems. The basal leaves are on long petiols and round or slightly kidney shaped. They have rounded ridges on the margins (crenate) or can be slightly lobed and are 0.4 to 1.5 inches wide. Like smallflower buttercup, the upper leaves are sessile or have small petioles and are deeply cleft about 3 times. Flowers are bright yellow, with 4 to 8 petals and are 0.5 to 0.75 inches wide. In this case, the petals are 4 to 5 times longer than the calyx. The fruit is 0.17 inches in diameter and the achene is tipped with a small straight beak.
Littleleaf buttercup [R. abortivus]3,4 - Annual or biennial, this buttercup is slightly hairy, branches from the base of the plant, and is 6 to 20 inches tall. Basal leaves are round with margins similar to Harvey’s buttercup and are on long petioles. Upper leaves have short petioles and are divided into 3 to 4 leaflets. The flowers are yellow and have 5 small oblong petals. Petals are close to the same size as the sepals. Achenes have a small hooked beak. Generally blooms March to June.
Creeping buttercup or corn buttercup [R. repens]2,5 - This buttercup can be distinguished at first glance by having stolons that root at the nodes. This perennial can spread forming colonies. This plant can be hairy to sparsely hairy. Basal leaves and upper leaves have 3 leaflets. In the upper leaves two leaflets are sessile while the center is extended on the petiole. Flowers are bright and shinny having a waxy appearance and are approximately 1 inch wide. Petals are round and are longer than the sepals. Fruit are 0.3 inches wide and the achene has a short thick and slightly bent beak.
Toxicity:
Buttercups are problematic in pastures. The buttercup family includes several toxic plants. This family also contains the larkspur and staggerweed (Delphinium spp.). The whole plants are toxic to all live stock. Cursed crowfoot (R. sceleratus) is reported to be one of the most toxic6. The toxic component is an acrid volatile substance called anemoral and an irritant called protoanemonin, reported to be a plant produced anibiotic6,7. All buttercups have various amounts of this or related compounds. Symptoms of poisoning are drooling, diarrhea, increased heart rate, behavior changes such as weakness and depression, bleeding, and convulsions6,8. Protoanemonin has been reported to cause irritation to the skin in humans. Amounts of plant tissue required to be dangerous depends on species of plant but in the article “Poisonous Pasture Plants and Livestock” by Dwight Lingenfelter and Bill Curran of Pennsylvania State University, reported approximately 1 to 3% of body weight could cause poisoning9. Toxicity does not appear to carry through in the hay, possibly due to the rapid break down of the toxins involved6.
Control:
There may be differences between specific species and efficacy work done on one species may not mean that same treatment will be successful on all species. Much of the work in the mid-west has been done on smallflower buttercup. Products that are reported to be effective on smallflower buttercup may not be as affective on all buttercups for example tall buttercup which is a perennial10,11.
In studies done at Purdue University10, smallflower buttercup was controlled above 95% and higher with 2,4-D [1 pt/A], glyphosare [0.5 to 0.75 lb ae/A], Autumn [0.3 oz/A and up], Canopy XL plus 2,4-D, and fall applications of 2,4-D [1 pt/A]. Glyphosate plus 2,4-D can be used as a fall or early spring burndown in corn or soybean. If 1 pt/A of 2,4-D is used before soybean a one week planting restriction will need to be observed. Canopy XL plus 2,4-D can also be used as a fall or early spring burndown. The Canopy component will provide some residual activity. Autumn is labeled for applications before corn. There are reports of triazines alone not be highly effective on buttercups10,13.
In winter wheat, Osprey, Olympus, Peak, and Harmony Extra provided excellent control of smallflower buttercup10,12. Osprey and Olympus can be applied in the fall or early spring before jointing. Peak can be applied in the fall or spring before the second node is visible (Feek’s Growth Stage 7) and Harmony Extra can be applied in the fall or spring after the 2-leaf stage and before jointing.
Buttercups in grass pastures can be an increased concern due to the toxicity posed to grazing animals. The products Cimmeron, Cimmeron Max, and Crossbow have excellent (> 90% control) of most buttercups you will encounter. Other products that have good control of buttercups are 2,4-D, Curtail, Milestone, and Forefront. Dicamba may provide fair to good control but appears to be a little more inconsistent than 2,4-D.
Reference:
1. Menadue, Y. and R. K. Crowden. 1989. Leaf Polymorphism in Ranunculus nanus Hook. (Ranunculaceae). New Phytologist, Vol. 114, No. 2, pp. 265-274
2. Britton, N. and A. Brown. 1913. An Illustrated Flora of the Northern United States and Canada. Vol. II. Dover Publications Inc., New York. pp. 104-115.
3. Wax, L.M., R.S. Fawcett, L.J. Moshier, W.F. Meggit, D.L. Wyse, L.C. Haderlie, C.G. Messersmith, L.B. Bendixen, W.E. Arnold, J. Doll, M.K. McCarty, K.P. Dorschner, and H.R. Lund. 1981. Weeds of the North Central States. University of Illinois. pp. 82-83.
4. Anonymous. Missouri Plants. com; Ranunculus abortivus. Accessed May 29, 2008. <http://www.missouriplants.com/Yellowalt/Ranunculus_abortivus_page.html>
5. Uva, R.H., J.C. Neal, and J.M. DiTomaso. 1997 Weeds of the Northeast. Comstock Publishing Associates, Cornell University Press.
6. McCain, J.W., R.J. Goetz, and T.N. Jordan. 1985. Indiana Plants Poisonous to Livestock and Pets. Cooperative Extension Service, Purdue University. pp. 42, 63.
7. Blasco, R., M. Mallavarapu, R. Wittich, K.N. Timmis, and D.H. Pieper. 1997. Evidence that formation of protoanemonin from metabolites of 4-chlorobiphenyl degradation negatively affects the survival of 4-chlorobiphenyl-cometabolizing microorganisms. Applied and Environmental Microbiology. Vol. 63 (2).
8. Majak, W. 2001. Review of Toxic Glycosides in Rangeland and Pasture Forages. Journal of Range Management, Vol. 54, No. 4
9. Lingenfelter, D. and B. Curran. Accessed on May 29, 2008. 2007. Poisonous Pasture Plants and Livestock. Field Crop News, Pennsylvania State University. <http://fcn.agronomy.psu.edu/2007/fcn0717.cfm>
10. Johnson, B. Accessed on May 29, 2008. Purdue Integrated Weed Management Annual Research Report. 2007-2002. <http://www.btny.purdue.edu/weedscience/resreport/BJ2005/default.htm>
11. Annonymous. Accessed on May 29, 2008. Tall buttercup (Ranunculus acris L.) control in 1999 following fall herbicide application in 1998 Woodland, MN – Kanabee Co. <http://appliedweeds.coafes.umn.edu/reports/1999/99pdfs/misc/99mis04.pdf>
12. Krausz, R.F. and B.G. Young. 2007. Brass and broadleaf weed management in winter wheat. NCWSS PROC. Vol. 62:92.
13. Annonymous. Pest Facts Sheet: Ranunculus repens L. North American Plant Protection Organization.
To Spray or Not to Spray? Decision Aids for Applying Fungicides to Hybrid Corn - (Fiersten Wise and Gregory Shaner)
- Early season weather conditions are favorable for leaf blight development.
- Scout fields frequently to determine when disease first appears in a field.
- Benefit of fungicide application depends on hybrid susceptiblity and disease pressure.
The warm, wet, weather conditions in the state over the past few weeks have been favorable for fungal leaf blight diseases of hybrid corn. The fungi that cause gray leaf spot and northern corn leaf blight survive the winter on corn stubble and residue in the field, and infect leaves in the spring during wet, humid, and warm conditions.
Genetic resistance has long been the main defense against leaf diseases of corn. However, hybrids vary in their degree of resistance. Many are partially resistant, some have a greater degree of resistance, but some are susceptible (Figures 1 and 2). A moderately resistant hybrid may provide adequate protection when conditions are only moderately favorable for disease. When conditions are more favorable for disease development, a moderately resistant hybrid may sustain some loss in yield and quality. Large amounts of corn residue left from the previous crop and warm, wet weather prior to, and just after tasseling promote leaf blight development.
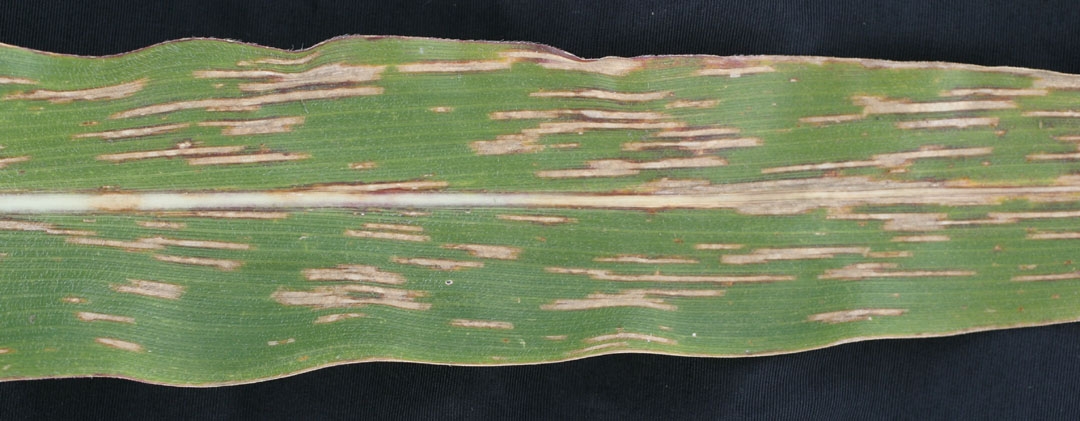
Gray leaf spot lesions on a more susceptible variety of hybrid corn.
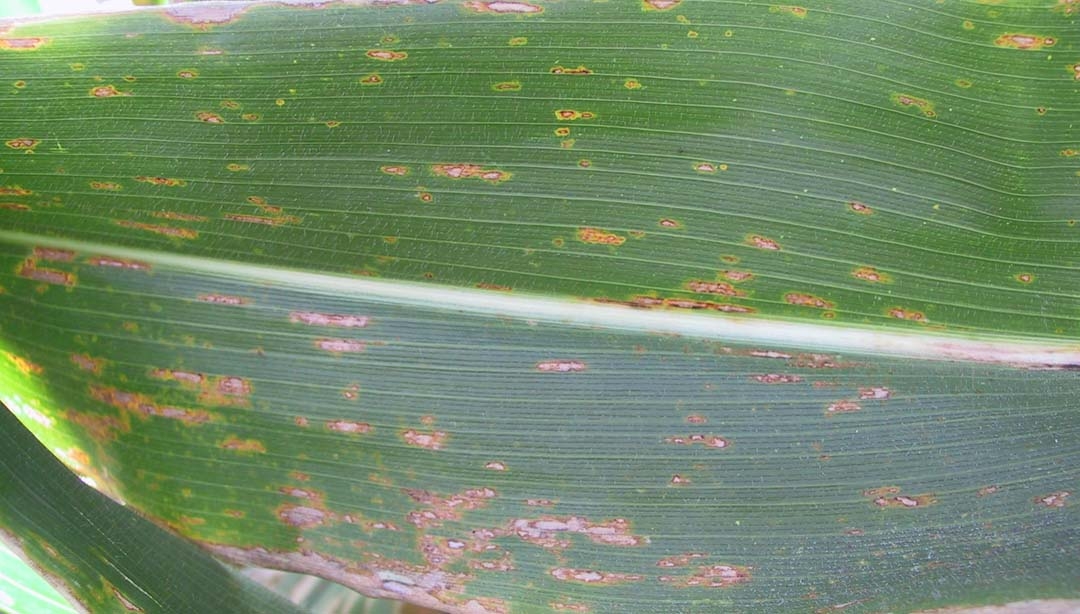
Gray leaf spot on a moderately resistant variety of hybrid corn.
In recent years several fungicides have been registered for use on corn against leaf diseases. Last year, in large part because of the high price of corn, growers sprayed millions of acres across the Corn Belt. Corn prices are even higher this year, so growers may once again want to protect their crop with a fungicide application.
Currently there are no standard disease threshold-based guidelines for when to spray fungicides on hybrid corn. Fungicides, even those that are absorbed by the plant and have some curative activity, perform best when applied at the onset of disease. Therefore, correct timing of treatment is important.
Ideally, a fungicide should be applied just before disease becomes established. With leaf blight pathogens, it is difficult to determine if an infection has occurred until lesions are visible on the leaf. When an infection occurs, symptoms (lesions) on the leaf do not appear immediately. Two weeks may elapse between when a spore of the gray leaf spot fungus infects and when a lesion becomes visible. Once lesions are present, additional spores are produced within the dying tissue of the lesion. These spores can spread to new leaves on the plant, destroying more leaf tissue and possibly reducing yield.
Frequent, careful scouting of fields can help determine when disease first appears. Typically, the first “crop” of lesions are few in number and only on lower leaves. If these can be detected, there is still time to apply a fungicide and effectively control subsequent development of disease. Paul Vincelli, a corn pathologist at the University of Kentucky, summarized threshold and scouting recommendations from Kentucky, Illinois, and Iowa in 1999, and recently redistributed these. Twenty or more plants should be checked for disease in five locations throughout a field. If 15% of these plants have lesions on the three leaves below the ear leaf, a fungicide application may be beneficial. This recommendation does not take into account the hybrid susceptibility, and if a very susceptible hybrid is planted, the threshold may be lower. If a hybrid is moderately resistant or resistant, the threshold may be higher.
Data from university trials and on-farm strip trials summarized by Pioneer indicate that the benefit of a fungicide application depends on the susceptibility of the hybrid and disease pressure. When there is low disease pressure, the response to fungicide is not sufficient to cover the cost of application. Fungicide applications reduce disease and increase yields on hybrids that are susceptible to gray leaf spot. The yield response from fungicide applicationdecreaseswith hybrids that havegreater levels of resistance to gray leaf spot (Jeschke and Doerge, 2007).
Beware of pre-harvest fungicide intervals when timing a fungicide application. Certain restrictions exist on fungicide use on corn used in animal feed, and pre-harvest intervals vary among the fungicides labeled for use on hybrid corn. Be sure to understand fungicide label restrictions and use the fungicide according to the label.
References
1. Jeschke, M. and Doerge, T. 2007. Management of foliar diseases in corn with fungicides. Crop Insights, Pioneer Hi-Bred International Inc., Johnston, IA. Vol.17:1-4.
Nitrogen Loss in Wet and Wetter Fields – (Jim Camberato, Brad Joern, and Bob Nielsen)
Heavy rainfall and ponded soils at this time of the year will result in nitrogen (N) loss. The quantity of N lost is difficult to predict and depends on many factors, including soil type, fertilizer type, placement and timing, soil temperatures since application and the amount of rainfall received. We cannot tell you how much N you lost but we can give you information that will assist you in estimating the loss for your situation.
Conversion of Fertilizer Nitrogen to Nitrate
With the exception of urea just after application, N must be in the nitrate form for N loss to be significant. Urea is just as leachable as nitrate when in the urea form. If rains come within the first 12-24 hours or so of urea or 28% application, the leaching of urea can be significant from sandy soils.
Although urea and anhydrous ammonia contain no nitrate at application and only 1⁄4 of the N in 28% is nitrate, the N present in all of these fertilizers is converted to nitrate by soil bacteria in the process known as nitrification. Therefore we need to estimate how much nitrification has occurred before we can speculate about N loss.
Nitrification begins almost immediately after application with urea and 28%, but is delayed at least 10-14 days with anhydrous ammonia because anhydrous ammonia kills the soil bacteria in the injection zone. Soil temperature has a large influence on nitrification, with about 2 weeks required for complete conversion at 60F and 1 week needed at 70F. Soil temperatures have been in the 60’s and 70’s since about May 20 th . That means the vast majority of N applied pre-plant or at planting was converted to nitrate before the heavy rains hit. If you were lucky enough to have sidedressed shortly before the rains (or have not yet sidedressed) you have lost little nitrogen.
Loss of Nitrate by Leaching and Denitrification
Soil type, rainfall and temperature control both how and how much N is lost from the soil once it is converted to nitrate. In well-drained sandy soils, much of the nitrate can be lost by leaching as water moves nitrate down through the soil profile. Sandy soils have a low water holding capacity and a high infiltration rate. This means that much of the rainfall moves through a sandy soil and runoff is generally pretty small. Consequently, the depth of nitrate movement in sandy soils is closely related to the amount of rainfall. Since every inch of rain can move nitrate 6 to 8 inches deeper in the soil profile in lighter textured soils, sandy soils that have received more than 8 inches of rain in the past week have likely lost significant amounts of N below the root zone.
In heavier textured soils (silt loam, clay loam, etc.), nitrate can be lost by either denitrification or leaching. Leaching in heavier textured soils is substantially slower than in sandy soils due to the greater water holding capacity and slower infiltration rates of heavier textured soils. That is why ponding is so prevalent in these soils after rainfall, even though the field may be tile drained.
Over time in a ponded area, soil microorganisms quickly deplete oxygen levels in the soil and cause denitrification. Denitrification is the conversion of nitrate to nitrogen gases as soil microorganisms use the oxygen in nitrate to survive. Denitrification losses take place at a much slower rate than nitrate leaching. Average N loss is usually around 2% of the nitrate per day of saturation, but has been reported to be as high as 5% per day. The longer the soil remains saturated and the higher the temperature the more N is lost via denitrification.
Typical N losses from heavier soils in winter and spring have been in the range of 20 to 50 pounds of N per acre in tile drainage studies at Purdue (Brouder et al., 2005). Ohio studies showed an average total N loss of 50 pounds per acre from fall N applied at 160 pounds per acre as anhydrous ammonia, but some years as much as 90 pounds N per acre was lost. The Ohio studies were conducted on a Crosby silt loam soil that is pretty typical of central Indiana . Rainfall in April through June during these studies was around 14 inches. Unfortunately some Indiana fields have had this much rainfall in 1 week although much of it has run off the field or collected in low spots rather than infiltrate into the soil.
Using Soil Testing to Determine Nitrogen Availability
A 1 foot deep soil sample analyzed for nitrate can be used to determine soil N levels. If N application was recent, also request ammonium levels. Consult Purdue Extension publication AY-314-W (Brouder & Mengel, 2003b) for proper sampling guidelines, especially if the fertilizer was banded. Soil samples can be taken once the soil drains and the field can be walked comfortably. Guidelines suggest 25 parts per million nitrate-N in the upper 1 foot is sufficient for optimum grain yield. In sandy soils, take an additional sample from the 1- to 2-foot soil depth to measure nitrate that has moved down, but not out of, the root zone. Each part per million of nitrate- or ammonium-N in 1 foot of soil is equivalent to 4 pounds of N per acre.
Using Reference Strips to Monitor Nitrogen Availability
Consider applying high N rates to several reference strips in several representative fields now if you can sidedress additional N to the rest of the field later in the season with high clearance application equipment. Nitrogen rates for these reference strips should be high enough so that N is not limiting. Consider approximately 150 pounds of N per acre N or at least as much as you would consider applying to the remainder of the field. A chlorophyll meter (Brouder & Mengel, 2003a) can be used to compare the N status of corn in the bulk field to that of the reference strip to determine if additional N is needed.
Grain Yield Response to Fertilizer Nitrogen
Determining the amount of lost N is not an easy task. Determining what to do from here on out is even more difficult. Corn in ponded areas may be damaged and incapable of responding to additional N. Corn replanted this late in the season may have a different N requirement than timely planted corn. Otherwise for most remaining corn fields, the decision to add N should be based on an estimate of how much N was lost, the initial application rate, the projected optimum N rate for the field under minimal N loss conditions, N cost, and grain value.
The projected economic optimum N rate (EONR) differs from field to field. For corn grown after soybean, the EONR was 150 pounds of N per acre (calculated at $6.50/bushel and $0.75/pound N) in 31 studies conducted in the past 2 seasons (Camberato et al., 2008). Nitrogen was sidedressed in many of these trials and N loss was considered minimal. Although the average EONR was 150 pounds of N per acre, some fields required as little as 100 pounds of N per acre to achieve the economic optimum yield while others needed as much as 200 pounds of N per acre. Soils in northeastern Indiana tended to require more N than average whereas silt loam soils in northwestern and west central Indiana required less N than average.
The average yield at 150 pounds of N per acre was 184 bushels per acre. Yield at 105 pounds of N per acre was 173 bushels per acre, representing an 11 bushel per acre yield decrease with 50 pounds of N per acre less. As the N rate approaches the EONR, it takes 7 to 8 pounds of N to produce the last additional bushel of yield with $0.75 per pound N and $6.50 per bushel grain. Yield may continue to increase above the EONR, but the cost of N exceeds the value of grain produced. Corn grown after corn required about 30 pounds of N per acre more than corn after soybeans to achieve economic optimum yield, but the yield decrease with 50 pounds less N per acre was the same 11 bushels per acre.
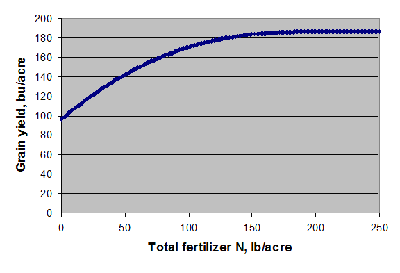
Figure 1 . Average grain yield response of corn grown after soybean to fertilizer N in Indiana in 2006 and 2007. The line represents the average of 31 trials on a number of different soils with limited N loss conditions.
To Fertilizer or Not to Fertilize, That is the Question
These are our opinions based on our knowledge of N loss mechanisms and experience. Consider your experience and specific field and weather conditions in evaluating our suggestions.
Additional N Likely Required:
Consider 60 to 120 pounds of N per acre for fields where urea or 28% UAN was applied more than 2 weeks prior, or anhydrous ammonia applied more than 4 weeks prior, to excessive rain, especially if:
• Silt loam and poorly drained field areas were saturated long enough to kill the crop and you will be replanting those areas to corn. Also consider starter fertilizer to get the replant corn off to a good start.
• Sandy fields received more than 8 inches of rainfall that infiltrated the soil.
Additional N May Be Required:
Consider 30 to 60 pounds of N per acre for fields where urea or 28% UAN was applied 1 to 2 weeks prior, or anhydrous ammonia was applied 3 to 4 weeks prior, to excessive rain, especially if:
• Silt loam field areas were saturated for more than 3 days and the crop survived.
• Poorly drained field areas were ponded for more than 3 days and the crop survived.
• Sandy fields received 4 to 8 inches of rainfall that infiltrated the soil.
Additional N Likely NOT Required:
Fields where N loss is estimated to be less than 30 pounds of N per acre and the projected optimum N rate or higher was used initially. For example:
• Fields where N was applied 2 to 7 days (urea or 28%) or 3 weeks (anhydrous ammonia) before excessive rain.
• Silt loam field areas that were saturated for less than 3 days.
• Poorly drained field areas that were ponded for less than 3 days.
• Sandy fields receiving less than 4 inches of rainfall.
Special Circumstance:
If you sidedressed with urea or 28% within 24 hours of the heavy rains on sandy soils, urea may have leached below the root zone. The amount of additional N required is dependent on how much rain fell on the field.
• Sandy fields that received 4 to 8 inches of rainfall that infiltrated the soil.
o Apply 60 to 120 pounds of N per acre
• Sandy fields that received 4 to 8 inches of rainfall that infiltrated the soil.
o Apply 30 to 60 pounds of N per acre
• Sandy fields that received less than 4 inches of rainfall
o Additional N likely not required
Nitrogen Loss Worksheet
Peter Scharf (2008) at the University of Missouri created an easy-to-use N loss worksheet that may be of additional assistance in deciding whether to fertilize and how much N to apply. <http://ppp.missouri.edu/newsletters/ipcm/archives/v18n10/v18n10.pdf>.
Related References
Brouder, Sylvie and David Mengel. 2003a. Determining Nitrogen Fertilizer Sidedress Application Needs in Corn Using a Chlorophyll Meter (AY-317-W). [On-line]. Available at <http://www.agry.purdue.edu/ext/pubs/AY-317-W.pdf> [URL accessed 6/13/08 ].
Brouder, Sylvie and David Mengel. 2003b. The Presidedress Soil Nitrate Test for Improving Soil N Management in Soil (AY-314-W). Purdue Extension. [On-line]. Available at <http://www.agry.purdue.edu/ext/pubs/AY-314-W.pdf> [URL accessed 6/13/08 ].
Brouder, Sylvie, Brenda Hofmann, Eileen Kladivko, Ron Turco, Andrea Bongen, and Jane Frankenberger. 2005. Interpreting Nitrate Concentration in Tile Drainage Water (AY-318-W). Purdue Extension. [On-line]. Available at <http://www.ces.purdue.edu/extmedia/AY/AY-318-W.pdf> [URL accessed 6/13/08 ].
Camberato, Jim, R.L. (Bob) Nielsen, Dan Emmert, and Brad Joern. 2008. Nitrogen Management Update 2008. Corny News Network, Purdue Univ. [On-line]. Available at <http://www.kingcorn.org/news/articles.07/NMgmtUpdate-1206.pdf> [URL accessed 6/13/08 ].
Laboski, Carrie. 2008. Potential for Nitrogen Loss from Heavy Rainfalls. Wisconsin Crop Manager Newsletter. Univ. of Wisconsin. [On-line]. Available at <http://ipcm.wisc.edu/Portals/0/Blog/Files/17/564/WCM_15(14)b.pdf> [URL accessed 6/13/08].
Sawyer, John. 2008a. Estimating Nitrogen Losses. Integrated Crop Management News, Iowa State Extension. [On-line]. Available at <http://www.extension.iastate.edu/CropNews/2008/0611JohnSawyer.htm> [URL accessed 6/16/08].
Sawyer, John. 2008b. Measuring the Nitrogen Status. Integrated Crop Management News, Iowa State Extension. [On-line]. Available at <http://www.extension.iastate.edu/CropNews/2008/0612JohnSawyer.htm> [URL accessed 6/16/08].
Sawyer, John. 2008c. Nitrogen Loss – How Does it Happen? Integrated Crop Management News, Iowa State Extension. [On-line]. Available at <http://www.extension.iastate.edu/CropNews/2008/0610JohnSawyer1.htm> [URL accessed 6/16/08].
Scharf, Peter. 2008. Nitrogen loss scoresheet. Integrated Pest & Crop Management Newsletter, Univ. of Missouri . [On-line]. Available at <http://ppp.missouri.edu/newsletters/ipcm/archives/v18n10/v18n10.pdf> [URL accessed 6/13/08 ].
![]()
Heavy Rains and Flooding Equal Delayed Soybean Planting – (Ellsworth Christmas)
- Excessive rains and flooding equate to delayed soybean planting.
- Northern Indiana producers should now change to an earlier maturity group of soybean.
The Indiana Crop & Weather Report for the week ending June 15, 2008 (USDA-NASS, 2008) indicated that about 20% of the acreage intended for soybean has yet to be planted, with the majority of this acreage in the southern third of the state. Rainfall reported across Indiana these past two weeks has been very intense across central and southern Indiana. In general, total rainfall across this part of Indiana is running as much as 10 to more that 15 inches above normal for the year to date, with extensive flooding. Soybean planting obviously has been delayed, with only 60% of the acreage reported as being planted in southern Indiana as of June 15.
Delayed planting has less effect on the yield of soybean than on corn. Unlike corn, which requires a certain number of growing degree days to mature, the soybean is more sensitive to day length. As the day length shortens later in the growing season, soybean maturity speeds up. As a general rule of thumb, for each three days planting is delayed, harvest is delayed only one day. The soybean plant shortens each part of the reproductive phase of growth, resulting in a shorter plant with fewer pods. Below is a comparison of estimated yield reductions experienced by corn and soybean as planting is delayed.
May 21 |
May 26 |
May 31 |
June 5 |
June 10 |
June 30 |
|
| Corn* | 9% |
13% |
19% |
25% |
32% |
50% |
| Soybeans | 0 |
2% |
4% |
7% |
10% |
38% |
| *Corn yeild losses adapted from Nafziger (1994), Univ. of Illinois. | ||||||
As yield levels of soybeans have increased over the past ten years or so, the percentage yield loss has increased slightly. For example, data from a recent study, given in the graph below, indicates that the reductions in yield for May 20 and June 10 average about 0.5%per day. Yield losses for the period from June 11 to June 30 average about 1.4 percent per day for each day of delay after June 10.

We are approaching the date where soybean planting has been delayed long enough to consider changing maturity groups. It is advisable to stay with a full-season variety of soybeans for your particular area until about June 15 in the northern quarter of Indiana, June 20 for the central half of Indiana and June 25 in southern Indiana quarter of the state. Full season soybeans will almost always yield better than shorter season varieties for a given geographic area even when planting is modestly delayed.
Once June 15 has been reached in northern Indiana, June 20 in central Indiana, and June 25 in southern Indiana, producers should move from a full season variety of soybeans to a mid season variety for their respective area. This will equate to a change of one-half maturity group assuming that a full season variety is being grown. Additionally, seeding rates should be increased by 15 to 20 percent to promote shading and taller plants to increase podding height and to increase the number of nodes per acre. The increase in the number of pods per acre will help offset the reduced plant height and pod numbers caused by delayed planting.
A commonly used rule of thumb for a cutoff date to stop planting soybeans is 90 days prior to the first 32 degree frost for a given area within the state. Using a 25% probability, or one in four years of a 32 degree or lower temperature, the magical date for the Bluffton area in northeastern Indiana is June 30, while in the Lafayette area it is July 5. Soybean planting should cease in most of the southern half of Indiana by July 10 except for the southwest corner where planting can occur up to July 15.
Related References
USDA-NASS. 2008. Indiana Crop & Weather Report. USDA, National Ag Statistics Service. [On-line]. Available at <http://www.nass.usda.gov/Statistics_by_State/Indiana/Publications/
Crop_Progress_&_Condition/2008/wc061608.pdf>. [URL accessed 6/18/08].
- New extension specialist for field crop diseases has joined faculty of the Department of Botany and Plant Pathology.
Kiersten Wise began work at Purdue last week. She is the new extension specialist for diseases of field crops. She will participate in DTC training, PAC field days, and PARP meetings.
Kiersten grew up in Iowa and earned her bachelor’s degree from Iowa State University. She moved from there to University of Georgia for a master’s degree. She recently completed her PhD work at North Dakota State University, where she worked on disease control in chickpea. She also conducted extension programs on chickpea for North Dakota farmers. She looks forward to helping Indiana growers manage diseases of corn, soybean, and wheat.
Kiersten’s e-mail address is <kawise@purdue.edu>. Her office phone number is 765-496-2170.
![]()