
Pest & Crop Newsletter, Entomology Extension, Purdue University
- Know Your Worms in the Ear
- Beware of Corn Earworms
- Soybean Aphid Update
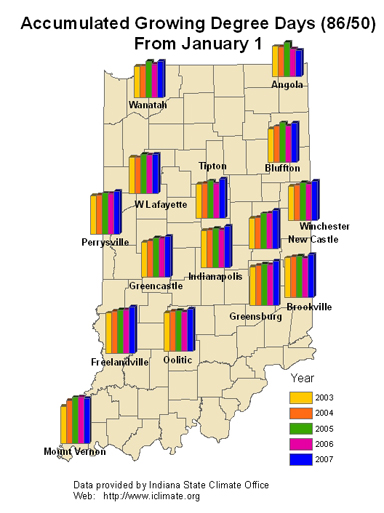
- Black Light Trap Catch Report
![]()
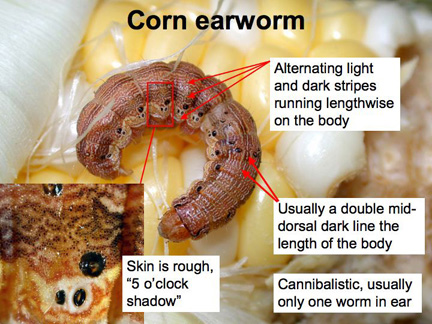
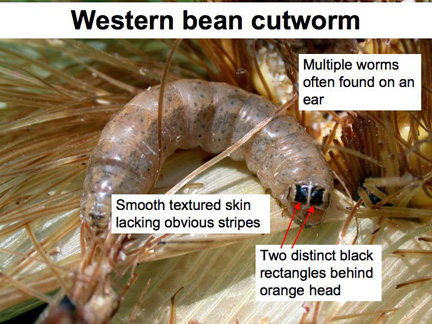
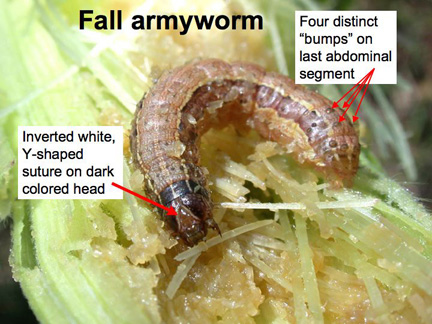
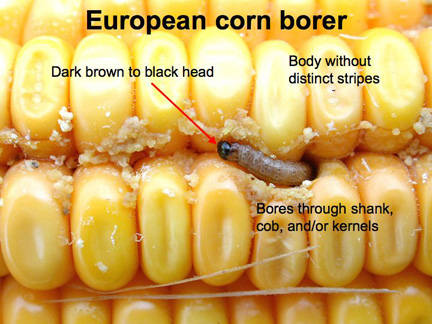
Know Your Worms in the Ear– (Christian Krupke and John Obermeyer)
Since our article on western bean cutworm last week, several folks have called in and/or sent pictures of infestations being found in northwestern Indiana counties. Increased pheromone trapping of western bean cutworm moths this year has spurred this increased awareness of this new pest. However, there is probably some misidentification going on as well. Note that, in general, you cannot use overall body color or damage for identification. Several caterpillars in the ear can be very similar in appearance and habits, so identification to species of some of the worms in ears can be tricky. Some identification tips, though not foolproof, appear below for the corn earworm, western bean cutworm, fall armyworm and European corn borer. We suggest you inspect cornfields soon before the larvae leave the ear and pupate.
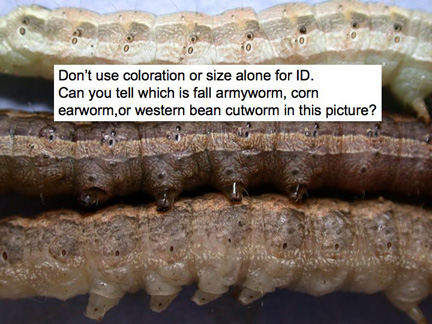
Answer: Top to bottom, corn earworm, fall armyworm, Western bean cutworm
Please refer to the following corn earworm article, as high numbers of moths are being captured in pheromone traps.
![]()
Beware of Corn Earworms – (Rick Foster)
Over the past 9 nights, we have caught extremely high numbers of corn earworm moths in our pheromone traps. On August 15, we had 459 moths in our trap in Lafayette and this morning (August 21) we had 346 moths. Remember that we generally recommend treating sweet corn that has green silks when we catch 10 moths per night, so our catches are 35-45 times higher than the threshold. What does that mean? To me it means that if you have sweet corn that has green silks, you should be spraying every other day with the high rate of your best insecticide (Capture, Warrior, Mustang Max), and you may want to add some Penncap M to the spray tank to increase your kill of adult moths. As I like to say, anyone can control insects in sweet corn in June and July, but when we start getting moth flights like this in August and September, then we find out who knows what they are doing. When the pressure is this high, you should also make sure your sprayer is calibrated properly, clean all your nozzles tips are clear and putting out the right amount of spray, made sure that you are getting insecticide on the silks where you need it, and made sure that your spray water pH is correct. Even if you do everything right, you may still see some damage when pressure is this high, but you should do everything you can to avoid a crop failure.
Tomato and pepper growers should also be aware of the potential form earworm (fruitworm) damage. This can be a particular problem if your tomato or pepper fields are surrounded by corn fields that are drying down and are no longer attractive to corn earworm moths for egg laying. Growers should tighten their insecticide spray schedules to at least once per week to avoid economic losses.
![]()
Soybean Aphid Update - (John Obermeyer and Christian Krupke)
It looks like our 2007 aphid year is finally coming to an end. The combination of heavy rains in the northern Indiana “aphid belt” counties, combined with hot conditions and maturing beans have aphid populations declining rapidly over much of the observation area. Note that the exception is late-planted beans, which will be vulnerable to any aphids looking for soybeans to feed on before overwintering. Continue to monitor these beans until the R6 growth stage is reached.
![]()
Click here to view the
Black Light Trap Catch Report - (John Obermeyer)
Weed Science Surveys I: Problematic Plants – (Glenn Nice, Bill Johnson, and Tom Bauman)
Surveys are an important tool to acquire information from large groups. They are used in politics (Gallup Poll), marketing (the person that stops you in the mall ask questions), government (US Census Bureau), television rating (Nielson ratings) and science. Surveys can be conducted by sending out a mail-in survey, over the internet, or by contacting people directly. In some cases surveys are conducted by going out and making observations, for example weed identification and density in grower’s fields. In most cases, they are used to obtain information for a large group by sampling a subset group within the larger group. One of the hardest aspects of designing a survey is being sure that you have equal representation of the large group in the smaller subset. For example, how many randomly selected fields do you have to survey to get the “bigger picture” of what is actually going on across a large area? How many homes does Nielson Media Research have to survey to get the best representation of everyone in the US.
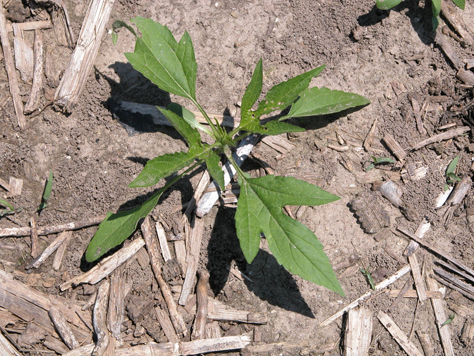
Giant Ragweed
In the case of voluntary surveys, large numbers are often contacted to obtain a minimum number of people that need to respond to provide an adequate subset. The number of surveys sent out is related to the amount that you expect to get back. Survey response rates can be from 5 to 30%, but the trick is to send out enough that you get the required number of responses to make the survey valid.
The Extension Weed Science Team at Purdue University has used surveys in the past to investigate problematic weeds, the perception of growers with resistant weeds, the distribution of resistance weeds, and the management of resistant weeds. The following series of articles will touch on some of the surveys that have been done and present some results from these surveys. In 2004, one such survey asked growers what their primary pest was. An average of 78% of respondents reported that weeds were their highest ranked pest, followed by insects and disease at 8%, and nematodes at 6%.
The following series of articles over the next weeks, will explore some of the surveys that the weed science team at Purdue University have done and published. The first, one that has been written about in the past, investigates the problematic weeds in the state of Indiana.
Top Ten Weed Problems
The Purdue University Cooperative Extension Service has been using surveys for many years to determine Indiana’s top ten most problematic weeds in agriculture and to try and identify any shifts in the weed spectrum. Surveys were mailed out in 1996, 2000, and 2004 to growers, county educators, and consultants, to identify the problematic weeds in Indiana. Although there are some additions and subtractions from year to year and some changes in rank, the usual suspects are generally present. Giant ragweed, Canada thistle, common lambsquarters, and burcucumber always make the list. One trend that is seen in the list of weeds is the removal of the annual grasses giant foxtail and fall panicum. Although giant foxtail is very common in Indiana, the introduction of Roundup Ready® soybean and glyphosate as an in crop herbicide in 1996 provided an effective tool to control giant foxtail. Johnsongrass is also notably missing from the 2004 results. It might be suggested that the presence of horseweed (marestail) in 1996, its disappearance in 2000, then the reappearance 2004 mirrors the introduction of glyphosate then the development of glyphosate resistance in that plant in the state of Indiana.
In the 2004 survey, winter annuals were included as a selection, adding common chickweed as the number one problematic winter annual. In the same survey, results were broken down across the state into nine regions. This allowed for investigation of regional differences across the state. Dandelion was ranked problematic in the north and central eastern parts of the state, while velvetleaf was ranked high in the northern parts of the state when compared to the southern parts.
Next week, a survey that investigated the use of a burndown in Indiana and application timing using weed size as a criteria.
1996 |
2000 |
2004 |
|
1 |
giant ragweed |
giant ragweed |
giant ragweed |
2 |
Canada thistle |
Canada thistle |
common lambsquarters |
3 |
hemp dogbane |
Joohnsongrass |
Canada thistle |
4 |
common lambsquarters |
common lambsquarters |
common cocklebur |
5 |
horseweed (marestail) |
shattercane |
velvetleaf |
6 |
Johnsongrass |
hemp dogbane |
horsewed (marestail) |
7 |
burcucumber |
burcucumber |
waterhemp |
8 |
shattercane |
velvetleaf |
burcucumber |
9 |
giant foxtail |
common ragweed |
common chickweed |
10 |
fall panicum |
common cocklebur |
dandelion |
![]()
Forage Nitrate Testing and Making Feeding Recommendations Based on the Results – (Kern S. Hendrix, Professor Emeritus, Department of Animal Sciences)
Several areas of Indiana have experienced lack of adequate rainfall and high temperatures in the mid-late summer growing season this year.
The normal process for conversion of nitrate (NO3) into plant proteins can be slowed when plants are subjected to stress such as lack of moisture. As a result, excess nitrate can accumulate. Forages such as corn, sorghum, and sudangrass are most likely to accumulate nitrate followed by oats and other small grain crops, followed by grasses. Legumes are less likely to accumulate nitrate. In all cases, the lower stem of plants is where the greatest nitrate levels are found. Forage feeding method influences the degree of risk from nitrate toxicity. Feeding greenchop forage is the highest risk followed by grazing, followed by hay. Silage feeding is the least risk, as significant amounts of nitrates are lost or converted to other compounds during the ensiling process.
If there is concern about the possibility of elevated nitrate levels in forage crops, cattle producers may wish to have a nitrate analysis done.
Fresh, dry or ensiled samples may be submitted for assay. Submit one to two quarts of chopped forage in unsealed paper or plastic bag(s). Listed below are names and addresses of laboratories that perform nitrate assays on forages. Cost will be in the range of $10.00 to $15.00 per sample. Turnaround time is within a few days in most cases. For shipping, it is recommended to use a carrier that provides next-day delivery service.
Laboratories may report results differently. It is important that results be evaluated on a dry matter rather than as-fed basis. Methods in which nitrate levels are commonly expressed and recommendations for feeding are shown in the table “Cattle Feeding Guidelines for Forages Containing Varying Levels of Nitrate”.
Animal Disease Diagnostic Laboratory
1175 ADDL
Purdue University
West Lafayette, IN 47907-1175
Phone: 765-494-7440
FAX: 765-494-9181
A&L Great Lakes Laboratories
3505 Conestoga Drive
Ft. Wayne, IN 46808-4413
Phone: 260-483-4759
Sure-Tech Laboratories
2435 Kentucky Avenue, Bldg. 9
Indianapolis, IN 46221
Phone: 317-243-1502
FAX: 317-243-1527
Cattle Feeding Guidelines for forages Containing Varying Levels of Nitrate1 |
|||
Nitrate (NO3) |
Nitrate Nitrogen (NO3-N) |
Potassium Nitrate (KNO3) |
Recommendations For Feeding |
Percent of Forage Dry Matter |
|||
0.0 - 0.44 |
0.0 - .10 |
0.0 - 0.73 |
Safe to feed in all situations. |
0.44 - 0.66 |
0.10 - 0.15 |
0.73 - 1.10 |
Safe for non-pregnant animals. Limit to to% of diet dry matter for pregnant animals. |
0.66 - 0.88 |
0.15 - 0.20 |
1.10 - 1.47 |
Limit to 50% of diet dry matter. |
0.88 - 1.54 |
0.20 - 0.35 |
1.47 - 2.57 |
Limit to 35-40% of diet dry matter. Avoid feeding to pregnant animals. |
1.54 - 1.76 |
0.35 - 0.40 |
2.57 - 2.93 |
Limito to 25% of diet dry matter. Avoid feeding to pregnant animals |
over 1.76 |
over 0.40 |
over 2.93 |
NO NOT FEED |
To convert from parts per million (ppm) to percent, move the decimal point four places to the left (i.e., 8800 ppm = 0.88%). 1Source: Sniffen, C.J. and L.E. Chase. 1981. Nitrates in Dairy Rations, Department of Animal Science, Cornell University. |
|||
![]()
![]()