
Pest & Crop Newsletter, Entomology Extension, Purdue University
Sweep Net Time for Potato Leafhopper - (John Obermeyer, Christian Krupke, and Larry Bledsoe)
- Sample newly cut alfalfa fields for leafhoppers.
- If yellowing has already occurred, it is too late to prevent damage to this cutting.
- Management guidelines are given.
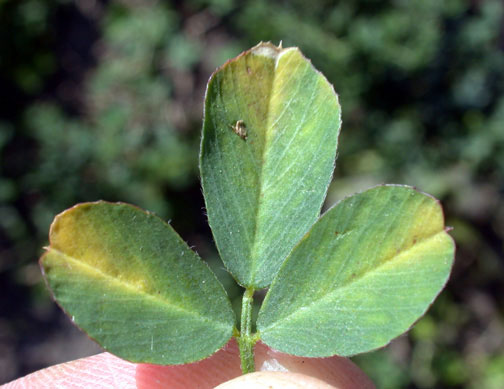
"Hopper burn on alfalfa
Although economic populations of potato leafhoppers have not been observed or reported, populations will be increasing with warmer temperatures. Alfalfa pest managers should begin sampling their alfalfa shortly after cutting.
Potato leafhoppers are small, wedge-shaped, yellowish-green insects that remove plant sap with their piercing-sucking mouthparts. Leafhopper feeding will often cause the characteristic wedge-shaped yellow area at the leaf tip, which is referred to as “hopper burn.” Widespread feeding damage can cause a field to appear yellow throughout. Leafhopper damage reduces yield and forage quality through a loss of protein. If left uncontrolled for several cuttings, potato leafhoppers can also significantly reduce stands.
Management Thresholds for Potato Leafhoppers |
|
Leafhoppers (Adults/Stem Height in Inches) |
Average Number of Nymphs Per Sweep |
under 3 4-6 7-12 greather than 12 |
0.2 0.5 1.0 1.5 |
Timely scouting and applying insecticides when necessary can prevent potato leafhopper damage. Treatment is preventative rather than curative. Thus, to effectively prevent economic losses, treatments must be applied before yellowing occurs. Usually the best results are obtained when treating small alfalfa, so be sure to scout the alfalfa regrowth for leafhoppers after cutting.
The need to treat for leafhoppers can be determined prior to the appearance of damage if fields are surveyed on a regular basis. To assess leafhopper populations and the potential for damage, take at least 5 sets of 20 sweeps with a 15” diameter sweep net in representative areas of a field. Carefully examine the contents of the sweep net, count the number of adults and nymphs, and calculate the number of leafhoppers per sweep. Use the guidelines given below to determine the need for treatment. For recommended insecticides see Extension Publication E-220, Alfalfa Insect Control Recommendations - 2006 which can be viewed at http://www.entm.purdue.edu/Entomology/ext/targets/e-series/e-list.htm.
![]()
Slug Damage Continues, Controls Limited – (John Obermeyer, Christian Krupke, and Larry Bledsoe)
- Slugs are favored by a wet spring with heavy crop residue on the soil surface.
- Crop damage and stand losses are most severe when slugs enter open seed slots.
- Control is usually not feasible by the time damage is realized.
Several calls have been received concerning slugs damaging both corn and soybean fields. Many areas of fields are so severely damaged that replanting is necessary. On corn, slugs feed on the surface tissue of leaves resulting in narrow, irregular, linear tracks or scars of various lengths. Severe feeding can result in split or tattered leaves that resembles hail damage. Soybean damage is not as predominant on the foliage, but rather on the hypocotyl and cotyledons. Given good growing conditions, plants usually outgrow slug damage once the crop is up. Most damage and stand losses by slugs occur when fields are too wet to plant and seed slots are not properly closed. In this situation, slugs can be found feeding on the seedlings within the slot, day or night. Obviously, once the growing point of corn or soybeans is injured, plant recovery is unlikely.
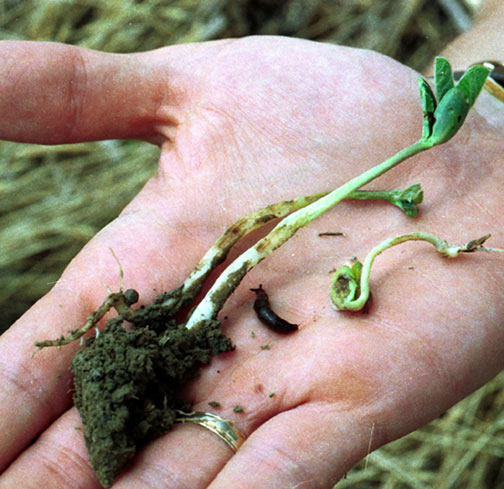
Slug damage to soybean hypocotyls
Chemical control of slugs is difficult, if not impossible. Metaldehyde pelleted baits, Deadline M-Ps, Metarex, Orcal Snail and Slug Bait, and Trail’s End LG are labeled for use, the availability is unknown. The cost for product is about $16-18 per acre. Spreading the pellets evenly over the field or damaged areas is key to control; using a commercial mechanical dispenser is one possibility. Field trials at Ohio State University have shown promising results when the pellets are evenly distributed. With the significant cost and difficulty of application, consider these baits only as a last resort to protect crop stands in high slug populated areas.
Where replanting is necessary from slug damage, one should strongly consider tilling (disc and/or field cultivator) the area first. This should help dry the area and break-up and bury crop residue. Doing so will discourage further slug activity. Granular and liquid insecticides are ineffective against slugs, as they slime over them. Home remedies, such as spraying plants at night with liquid fertilizer (high salt concentration), have proven futile.
![]()
Japanese Beetles Emerging - (John Obermeyer, Christian Krupke, and Larry Bledsoe)
- Slugs are favored by a wet spring with heavy crop residue on the soil surface.
- Crop damage and stand losses are most severe when slugs enter open seed slots.
- Control is usually not feasible by the time damage is realized.
Extreme southern counties of Indiana are beginning to observe Japanese beetles. Within two weeks, most areas in the state should be seeing this notorious pest. The good news is that the grub stage of this species has, or soon will, stop feeding to pupate and later emerge as an adult.
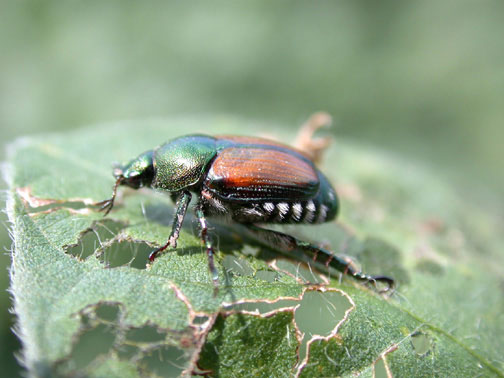
Japanese beetle on soybean
This year’s adults are the result of eggs that were laid by female beetles last summer. After these eggs hatched in 2005, the grubs immediately began to feed on roots and decaying organic matter in the soil. They continued feeding until cold temperatures prompted them to move deeper in the soil profile to overwinter. Early this spring, the surviving grubs returned to near the soil surface to feed. Spring root feeding by the grubs can result in serious damage to early-planted crops, especially corn. Though expected because of the cool, wet conditions this spring, we have heard of very few grub problems.
Japanese beetles will feed on more than 350 different species of plants, but are especially fond of roses, grapes, smartweed, soybeans, corn silks, flowers of all kinds, and overripe fruit. Beetle damage to cultivated crops is often minimal and defoliation (leaf removal) on soybean looks much worse than it is. The beetles often congregate in several areas of a soybean field, feeding on and mating in the upper canopy. The beetles’ iridescent, metallic color catches the attention of those doing “windshield” field inspections. Closer inspections will often reveal that weeds such as smartweed have made fields even more attractive to the beetles. Look for more on this pest in future issues of Pest&Crop.
![]()
Click for Table.
Black Light Catch Report.
![]()
Wheat Head Scab – (Gregory Shaner and Shawn Conley)
- Head blight of wheat is out there, but still not severe.
The weather-based predictive model for wheat head scab (referred to in earlier issues of Pest&Crop, and available at <http://www.wheatscab.psu.edu/>) has consistently predicted a low risk of the disease for Indiana. However, head blight is evident in many areas of the state. This does not necessarily mean the model has failed to do its job. The model predicts risk for a “severe” epidemic, which is defined as a severity of 10% or greater. There are two components to severity of head blight: the percentage of heads in a field that are blighted, and the average amount of blight on those heads. A blighted head may range from a single white spikelet to a totally white head. Severity integrates these two components to estimate the total amount of damage based on visual blight symptoms. A head that is totally blighted will presumably produce little if any sound grain, whereas a head with only a little blight may produce some scabby kernels, but otherwise sound grain.
We are seeing head blight in wheat variety trials around the state, but at low incidence. For example, in the variety trial at SEPAC (Jennings County), incidence ranged from 0.3 to 2%. At the Davis Purdue Ag Center, incidence was even lower. The most severely affected variety had only 0.6% of the heads affected. The greatest incidence of blight we have so far seen is in the trial near campus (Tippecanoe County), where incidence ranges from 4 to 13%. Even at this location, when the amount of blight per head is taken into account, severity on all varieties is still below the 10% threshold. We will evaluate head blight at Davis a second time on Friday, and evaluate head blight at Pinney-Purdue on Thursday.
It’s easy to overestimate the severity of head blight. When healthy heads are still green, blighted heads stand out conspicuously and give the impression that they are much more numerous than they really are. The most accurate way to measure incidence is to count blighted heads in arbitrarily chosen 1- or 2-ft lengths of row in several areas of a field or plot. A reasonable estimate of incidence can be made by visually. In a good stand of wheat there will be 35 to 45 heads per foot of row. Look at short intervals of row, instead of over a broad area, and count the blighted heads. Divide this number by 40 (or whatever seems a reasonable number of heads per foot) to calculate percent incidence.
This year may be somewhat a repetition of 2004. The model, for the 7-day period ending just as wheat began flowering throughout the state in 2004, predicted low risk, because it had been dry. However, once wheat started to flower, it became wetter and more humid. Evidently this allowed the head blight fungus to produce spores on corn stubble, which then infected wheat during early grain filling. So far, it does not appear that severity is as great as it was in many fields in 2004.
Due to relatively cool conditions across Indiana in May and June, the winter wheat grain fill period has been moderately extended. This will likely lead to increased kernel size at harvest. Since scab infested kernels are smaller and lighter than uninfected kernels, growers may be able to remove some of the scabby kernels by simply turning up the air on the combine and blowing them out the back. Since there can be dramatic differences in kernel size between varieties it is critical that growers check combine settings from field to field. When inspecting the ground for loss, scab infested kernels will appear shrunken and shriveled and may have a pinkish hue to hem.
In many of the past 20 years, wheat in Indiana has been damaged by head scab (Fusarium head blight). The primary cause of head scab in the Corn Belt is Fusarium graminearum (aka Gibberella zeae), a fungus that also causes stalk rot and ear rot of corn. Whether a corn crop has a stalk rot problem or not, Gibberella zeae is a common invader of stalks as they mature, so there is always plenty of the fungus around to potentially infect wheat. Weather determines the occurrence of scab. Warm, humid weather during flowering and early grain filling of wheat provides the necessary conditions for production of spores by Gibberella zeae on corn residue and infection of wheat heads by these spores.
Although recent weather has been wet, it has also been cool. Based on several years of head scab epidemiology studies, in which Purdue was a participant, a weather-based risk model was developed to help growers, grain buyers, and processors determine when and where scab will be a problem. The model is available at: http://www.wheatscab.psu.edu/.
From the home page, the user can go the Risk Map Tool. Choose the type of wheat (winter or spring) and then click on the state of interest. Up until 2 days ago (15 June) the risk for Indiana was low. The model looks at weather for the 7 days prior to the day of prediction. Essentially, risk increases the more hours there are in that 7-day period when temperature is between 48 and 85°F and relative humidity is 90% or greater. Prior to the afternoon of 10 May, much of Indiana was dry. When the rains commenced, temperatures dropped and there were few hours above 48°F. The prediction of risk for wheat flowering on 16 May was somewhat greater (medium risk) for a few counties in southeastern Indiana. The 17 May prediction shows more counties at medium risk, across southern Indiana and in the northeast. This increased risk is the result of sustained wet weather coupled with rising temperatures.
The risk assessment tool has two new features this year: the ability to look at risk 1 or 2 days forward and a commentary. For today’s (17 June) model output, the area of medium risk for wheat that flowers tomorrow or Friday diminishes compared to the risk for wheat that flowers today.
In summary, there does not appear to be a high risk of head blight anywhere in our region. There is medium risk for some areas. Under these circumstances, a wheat field where there is corn residue on the soil surface or a field where a highly susceptible variety was planted may develop scab.
![]()
Corn Grain Yield Trends: Eyes of the Beholder – (R.L. (Bob) Nielsen)
Determining state and/or national trends in corn grain yield and predicting future yields is a popular summer pastime of the locals down at the Chat ‘n Chew Café. Yield trends based on long-term historical yields are relevant when yield change is steady over a long period of time. Conversely, changes in yield trend lines can occur when major improvements in genetics or production technology result in significant changes in productivity.
Corn grain yields in Indiana from 1866 to about 1930 changed very slowly, if at all (Fig. 1). The adoption of hybrid seed corn in the 1930’s, followed by nitrogen fertilizers and herbicides in the 1940’s represented “quantum leaps” in corn production technology for the Indiana corn grower. Consequently, the rate of increase in trend yield changed dramatically beginning about 1930 (Fig. 1).
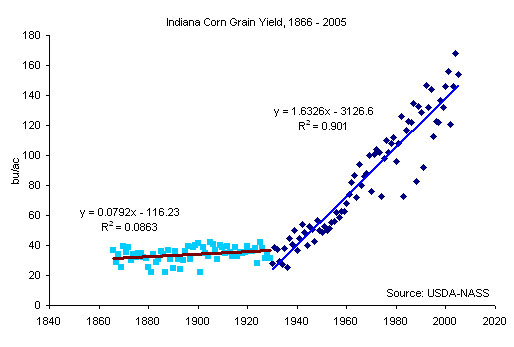
Figure 1. Historical corn grain yields for Indiana from 1866 to 2005 and linear regressions of yield versus production year for two time periods. Source of yield data= USDA-NASS (2006).
The ability to recognize such “quantum leaps” in genetic potential or technology improvement can be difficult in the short term. The long-term effects of genetic or technological improvements are, by definition, not recognized for quite some time. Consequently, the time frame appropriate for determining yield trends is often in the “eyes of the beholder.”
Personally, I believe current yield trends calculated from relatively lengthy historical time-spans are more reliable for predicting near-term future yields than those calculated from relatively short time-spans. Read on for the arguments I use to support that belief.
(a) Supporting Arguments
Using historical corn grain yield data from USDA-NASS (2006), I performed simple linear regressions of yield versus production year for a number of datasets representing differing lengths of time-spans (Fig. 2). For example, calculating the trend line from the past 30 years of data (1976-2005) results in a linear rate of yield gain of ~1.7 bu/ac/yr with an R2 of ~ 0.46. Yield trend lines calculated for time-spans varying from 30 to 70 years exhibit similar rates of yield increase per year (~ 1.7 bu/ac/yr), but ever-decreasing R2 values (i.e., less reliable) as the reference time-span decreases.
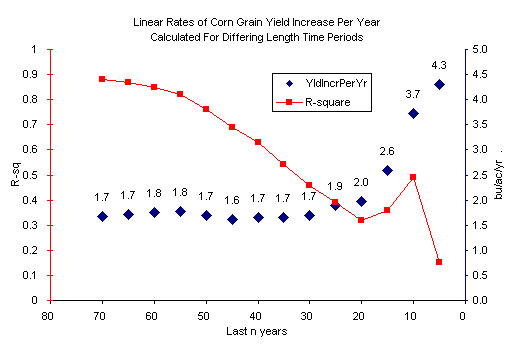
Figure 2. Linear rates (b coefficients) of corn grain yield increase per acre per year calculated by simple linear regression of state average corn grain yield (Indiana) versus production year over differing length time periods. Source of yield data used in the regressions= USDA-NASS (2006).
Trend lines calculated from shorter time-spans (< 30 years) suggest that the rate of annual yield improvement in corn is increasing, but the R2 values associated with these shorter-term regressions are generally quite small (i.e., even less reliable). The latter issue of ever-smaller R2 values makes me naturally less trusting of short-term trend lines.
If the actual rate of yield gain in recent years was significantly greater than that calculated over a much longer time-span (e.g., 3.7 bu/ac/yr calculated from the past 10 years in Fig. 2 versus 1.7 bu/ac/yr calculated from the past 70 years), then I believe one should begin to see ever-larger departures from that 70-year trend line. The data shown in Fig. 3 represent such departures (%) from trend yield in Indiana since 1960 relative to a trend line calculated from state corn yields of the past 75 years (~1.6 bu/ac/yr, R2 = 0.9).
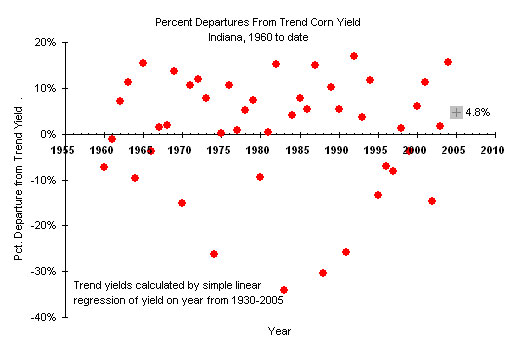
Figure 3. Departures from estimated trend corn yield for Indiana over the past 46 years. Trend yields estimated from simple linear regression of grain yield versus production year for the time period 1930-2005. Source of yield data used in the regressions= USDA-NASS (2006).
There does not appear to be either an increase in the frequency of positive departures from trend in recent years or an increase in the magnitude of the departures that do occur. To me, this suggests that a trend line calculated with 70+ years of yield data accounts nicely for the variability in actual yields throughout that time period, including those in recent years (R2 = 0.90) and that there is likely no significant change in the slope of the trend line in recent years.
Finally, I can illustrate the hazards of calculating trend lines based on short-term datasets with the two trend lines depicted in Fig. 4. The data points shown represent state average corn grain yields over the past 46 years (1960-2005).
The blue trend line was calculated from the entire 46-year dataset and would suggest a linear rate of yield gain of ~1.6 bu/ac/yr with an R2 of 0.7 (not bad, but not as good as that based on 70+ years of data). The red trend line was calculated for a 10-year time-span from 1970 to 1979 and would suggest a linear rate of ~2.5 bu/ac/yr with a smaller R2 of 0.3 (much less reliable than that calculated from 46 years of data). If one then extrapolates the red trend line all the way to 2005, the reliability issue becomes clear because a trend line equal to ~2.5 bu/ac/yr based on 10 years of data would have significantly over-estimated future yields for the overwhelming majority of the subsequent 26 years.
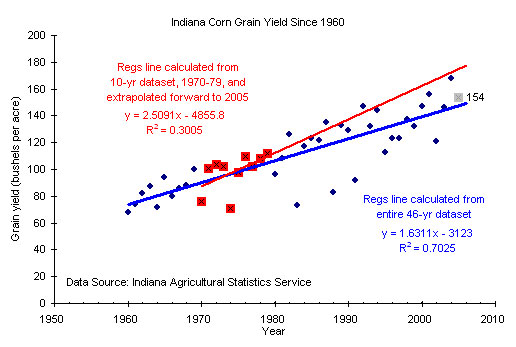
Figure 4. Two trend lines for Indiana corn grain yield over time based on short-term (10 years) versus long-term (46 years) yield data. Short-term trend line was extrapolated to 2005. Source of yield data used in the regressesions= USDA-NASS (2006).
(b) Summary
Admittedly, I picked a 10-year period that supported my argument. But that’s the point, isn’t it? One never knows whether any particular 10-year period is truly predictive of the future. In summary, what I’m trying to say is that what we think we see today as a short-term trend based on the past 10 years may be just as erroneous as that we would have calculated in 1980 from the 10 years prior to that. This opinion will change come the day when another truly “quantum leap” in corn production technology occurs. In the short term, weather likely impacts year-to-year departures from trend yields more significantly than do current genetics or production technologies.
References
USDA-NASS. 2006. Quick Stats - U.S. & All States Data - Crops. USDA-National Agricultural Statistics Service. Online at http://www.nass.usda.gov:8080/QuickStats/Create_Federal_All.jsp [URL verified 6/15/06].
Don’t forget, this and other timely information about corn can be viewed at the Chat ‘n Chew Café on the Web at http://www.kingcorn.org/cafe. For other information about corn, take a look at the Corn Growers’ Guidebook on the Web at http://www.kingcorn.org.
![]()
![]()