
Pest & Crop Newsletter, Entomology Extension, Purdue University
- Soybean Aphid: The Spraying and Learning Continues
- Harvest Restrictions for Soybean Aphid Insecticides
- Road Trip Observations of Soybean Aphid and Soybean Cyst Nematode
- Black Light Trap Catch Report
- Kernel Set Scuttlebutt
- Estimating Corn Grain Yield Prior to Harvest
- Impact of Warm Night Temperatures on Corn Grain Yields
- Assessing Potential for Nitrate Problems in Corn
Soybean Aphid : The Spraying and Learning Continues- (John Obermeyer, Christian Krupke, and Larry Bledsoe)
- Many soybean aphid are now small and white, the reason is unclear.
- White dwarfs are still feeding and damaging plants.
- Other common soybean ahid questions addressed.
Pest managers in northern Indiana counties have been in the thick of the soybean aphid battle for the last several weeks, now central and some southern areas of the state are hitting threshold numbers. As with any pest outbreak, there has been some confusion about thresholds, pesticides, and biology. We are grateful for the many excellent questions that you have been asking, it is obvious you are diligently scouting and trying to stay ahead of the aphid population explosion. Below are our best answers to the most common questions:
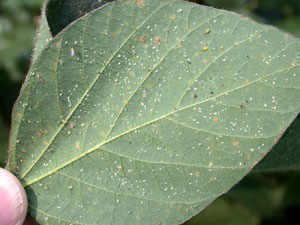
Leaflet covered with soybean aphid white dwarfs.
Little, white aphids: By far the most asked questions have been concerning the very small, white aphids. These ARE soybean aphid. They ARE NOT all “baby” aphids. They ARE NOT diseased aphids. In literature they are referred to as “white dwarfs.” Aphids of many different species do this in response to change. With soybean aphid, this change in morphology may be due to hot temperatures, higher humidity, shorter day-length, nutritional quality, predator populations, etc. In short, we do not know what is causing this. We do know that they are living, feeding, and reproducing aphids. They should be included in the total plant population count when determining treatment. It is true that they likely do not feed as heavily as the “normal” green/yellow aphid. It has been noted that because of their size and color, many are missed when making aphids/plant counts.
R5/R6 growth stage thresholds: Nobody likes to see soybean plants get run over in order to apply insecticides. However, even during seed fill stages of soybean growth, treatments may be justified. The confusion is because the threshold is not as clear-cut up through the R4 growth stage, that being ≥250 aphids/plant. For R5 (seed fill) growth stage, aphid numbers need to be obviously increasing above and beyond the 250 aphids/plant. This implies a growing, not static, aphid population (multiple scouting trips). To justify treating at R6 (full seed) growth stage, in addition to the growing aphid population above 250, the plants would have to be under moisture stress. Please use some common sense in determining treatment for R5/R6 growth stages. Do not treat R7 soybean.
Insecticide efficacy: No foliar insecticide will give residual control beyond two weeks in these environmental conditions (i.e., sun, heat, humidity). One week to ten days is more realistic. Second applications are becoming common, and justified, for many fields in northern Indiana. If a company representative guaranteed 3-4 weeks control of their product, take them up on their offer and hold them to the warranty. Winged aphid suction traps in northern Indiana have captured large numbers, indicating the aphid is still on the move. Predator numbers will be greatly diminished in treated fields and will recover very slowly, if at all. This may allow aphids to resurge more rapidly.
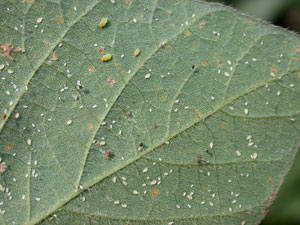
Close-up of soybean aphid white dwarfs.
Aphid predators: Numerous aphid predators are being observed while scouting fields. Unfortunately they are usually in fields that have surpassed treatment threshold. Once aphid levels reach over 100 per plant, predators may not be able to keep ahead of the aphid’s reproductive capability. The exception would be where aphid numbers may be on the decline. This has recently been observed in Minnesota.
Rain: Gentle rains haven’t impacted soybean aphid populations. Though not quantified, hard, driving rains probably knock-off some aphids. No one has reported a significant decrease in aphid populations from rain events. Certainly any moisture is welcomed to help soybean plants to fill seed, but shouldn’t be relied on for aphid control. Epizootics, fungal pathogens that quickly move through a aphid population, are favored by high humidity. Unfortunately, these diseases usually only occur once aphid populations have exceeded treatment levels.
Threshold discrepancy: Please use extension publication “Soybean Aphid,” E-217 www.entm.purdue.edu/entomology/ext/targets/e-series/fieldcro.htm. Do NOT use the Corn & Soybean Field Guide for soybean aphid threshold information. Unfortunately the “pocket guide” has outdated treatment guidelines. This will be corrected for the 2006 edition.
![]()
![]()
Road Trip Observations of Soybean Aphid and Soybean Cyst Nematode – (Bob O’Neil, Jamal Faghihi, Ho Jung Yoo, and Virginia Ferris)
These comments are based on field observations and data taken by Bob, Jamal and Ho Jung during a field trip July 27 and 28. The trip was designed to update the soybean aphid and soybean cyst nematode situation in the northern half of Indiana. Bob and Ho Jung followed up with additional observation on August 2.
Editors Note: The following soybean aphid information, through outdated, provides some insightful information early in the outbreak of northern and north central Indiana counties. JLO
Soybean aphid (SBA): The following scale was used to estimate the infestation level of sampled fields where 1 = 10 SBA/plant; 2 = 11-100; 3 = 101-249; 4 >250 SBA/plant. Every plant we examined had SBA. Sampling for soybean aphid (SBA) suggested that aphids are widely distributed throughout the northern one-half of the state. Together with the counties listed in Table 1, additional sampling on 7/28 showed that the following counties have fields above threshold (SBA > 250/plant): Carroll, Cass, Miami, Wabash, Huntington, Noble, Elkhart, Whitley, Randolph, & Kosciusko. Altogether, approximately 30% of fields sampled were above threshold. On 8/2 we re-visited fields we had sampled 7/28 in Starke, Marshall, and St. Joseph counties. Aphid counts in all but one field had increased, and 1, in Marshall county, had exceeded threshold. In our travels we noted that a number of fields showed evidence that they had been sprayed, and our discussions with growers indicated widespread concern over the impact of the aphid on yield. None of the fields we sampled were “obviously infested”, reinforcing the idea that growers must count aphids on plants to estimate each field’s infestation level. The number of fields below threshold at the same time and approximate locality of economically-infested fields, also suggests that growers must sample fields to determine if a treatment is warranted.
Soybean cyst nematode (SCN): We always knew that the SCN infested fields are more prevalent in western Indiana counties, because we have always received more samples with confirmed SCN presence from these counties. We particularly wanted to get current and first-hand knowledge of the SCN infestations in some of the eastern counties of Indiana. To accomplish this task in a two-day trip, we chose to sample two randomly selected fields from each county. We looked for visual symptoms and also recorded the presence of new SCN females on the soybean roots. The collected soil samples were brought back to our laboratory and processed for presence of SCN in the soil. The compiled data are shown in Table 1. The data showed that for the most part presence or absence of SCN could be confirmed in the field. However, occasionally no cysts were observed on the roots, but later, cysts were found in the soil samples. Once again this emphasizes the importance of soil sampling as the ultimate tool for determining the presence of SCN in the soil. Lack of nutrients in the soil could be the reason for some soybeans showing apparent visual symptoms of SCN in the absence of SCN. Wide-spread symptoms were observed in several adjacent counties with similar soil type. On the other hand, lack of symptoms or of new SCN on the roots in fields where SCN was later confirmed in the soil, could be due to the growing of resistant cultivars in these fields. However, most alarming to us are the fields that showed no symptoms but which have large numbers of SCN present on the roots. This is especially alarming if SCN resistant cultivars are grown in these fields. For the most part we had no knowledge of what types of soybean were planted in these fields. We have always hypothesized that about 40% of fields are infested with SCN in Indiana. This assumption has been based on samples sent to us in the past. It is reassuring that this current and truly random sampling has confirmed this assumption, as 13 out of 30 samples (43.3%) showed presence of SCN.
We again urge you to start monitoring your fields for presence of soybean cyst nematode. If you have not sampled for SCN in the past, or have used resistant soybean seeds for several years, you need to sample for this nematode. As in previous years, Indiana Soybean Board is currently paying the processing fees for Indiana growers, up to 10 samples/grower/year. Soil samples taken from a depth of 4-6 inches can be sent to our laboratory for analysis.
If you have any question about SCN or any other kinds of nematode, you can contact Jamal Faghihi at 765-494-5901 or send an email to jamal@purdue.edu. Soil samples for nematode analysis can be sent to: Nematology laboratory, Purdue University, Department of Entomology, Smith Hall, 901 W. State Street, West Lafayette, IN 47907-2089.
![]()
Click for Table.
Black Light Catch Report
![]()
Asian Soybean Rust Update – (Greg Shaner)
Observations
No Asian soybean rust has been found on soybean, kudzu, or any other host species in Indiana. Sentinel plots are being scouted regularly. Bacterial pustule, brown spot, downy mildew, and bacterial blight have been found in some fields.
Growth Stages
Many fields are now in the seed development growth stages (R5 to R6). Early in the season, plants in many fields seemed shorter than normal, but where rains have fallen, plants are of normal height (36 to 42 in.) and canopies are thick.
Management
There is no reason at this time to spray a fungicide on soybean for rust control. As the season progresses with no rust anywhere near Indiana, the probability that rust will arrive in time to cause damage decreases. If rust does arrive later in August, then a fungicide treatment may be required to protect yield, but treatment should be deferred until we know rust is present in the state, or very near, in order to receive the full benefit of treatment.
Forecast Outlook
Temperatures of the past several days have been higher than the optimum for rust. Although nights are warm, very high relative humidity allows dew to form. Winds from the south could bring spores into Indiana, but known rust outbreaks are still far away so if spores did reach us, densities would be very low. Rust is spreading north and west in the South, but very slowly. The northernmost findings of rust are in the central latitudes of Georgia and Alabama.
Scouting Recommendations
Because we cannot rule out the possibility that some spores of the soybean rust fungus have reached Indiana, fields should be scouted diligently and frequently. If southerly winds brought in any spores during June or July, pustules developed from secondary infection should be visible now.
Scouting Techniques
The goal of scouting is to detect rust at a very low incidence (fewer than 5% of plants with any visible infection), when effective control with a fungicide is still possible. At least 150 leaves should be carefully examined. If initial spore loads are light, there may be only a few infections per acre. When these infections mature and produce spore-bearing pustules, which takes about 7-9 days, most of those spores will land near where they were produced. Thus, initial disease development will be focal. That is, there will be a few “hot spots” in a field where rust is severe, with little or no rust outside these hot spots. These hot spots, or foci, may be only 1 yard in diameter. As a focus develops and more spores are produced, infection in the field will become more general. However, the goal of scouting is detect rust before it becomes general. To maximize the chances of finding a focus, it is better to look at many areas in a field, but only a few plants in each area, rather than to look at a lot of plants in only a few areas. If there are areas in a field where leaves tend to be wet longer (low areas, areas shaded in the morning by woods, etc.), scouting should concentrate on these. Examine the underside of leaves because this is where pustules preferentially develop. Look in the lower to mid canopy for rust, on the third or fourth leaf below the top fully developed leaf. The Purdue Plant and Pest Diagnostic Laboratory web site has images and tips for recognizing soybean rust and distinguishing it from other foliar diseases. See www.ppdl.purdue.edu/ppdl/pubs/soybean_rust_symptoms_web.pdf.
![]()


Kernel Set Scuttlebutt - (Bob Nielsen)
“Scuttlebutt”: The cask of drinking water on ships was called a scuttlebutt and since sailors exchanged gossip when they gathered at the scuttlebutt for a drink of water, scuttlebutt became U.S. Navy slang for gossip or rumors. A butt was a wooden cask, which held water or other liquids; to scuttle is to drill a hole, as for tapping a cask.
Nautical Terms and Phrases, NAVAL HISTORICAL CENTER, Washington DC 20374-5060.
Online at www.ussbrainedd630.com/terms.htm [URL verified 8/8/05].
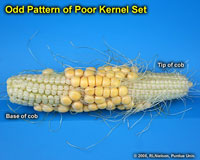
The scuttlebutt heard in many coffee shops in Indiana these days is that folks are walking corn fields and finding a gamut of kernel set success ranging from excellent to pathetic. Growers’ interest in this topic obviously lies with the fact that the number of kernels per ear is a rather important component of total grain yield per acre for corn.
Poor kernel set, meaning unacceptably low kernel numbers, is a bad omen for fields that otherwise appear to be in good shape. Good or poor kernel set is determined from pollination through the early stages of kernel development; typically 2 to 3 weeks post-pollination.
Problems with kernel set stem from ineffective pollination, kernel abortion, or both. Distinguishing between these two symptoms is easy. Determining the exact cause of the problem is often difficult.
Potential Yield Loss
The potential loss in grain yield caused by lower kernel numbers per ear can be estimated using the formula of the so-called Yield Component Method first described by the Univ. of Illinois many years ago (Univ. of Illinois, 2005). For example, the loss of only 1 kernel per row for a hybrid with 16-row ears and a stand count of 30,000 ears per acre would equal a potential yield loss of approximately 5 bushels per acre (1 [kernel] x 16 [rows] x 30 [thousand ears per acre] divided by 90 [thousand kernels per bushel]).
Ineffective Pollination
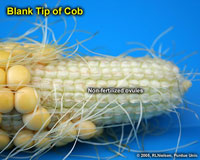
Poor kernel set may be caused by ineffective pollination and the subsequent failure to fertilize ovules on the cob. Ineffective pollination is characterized by an absence of noticeable kernel development. In other words, all you see is cob tissue. Pollination problems may be due to several stress factors this year, sometimes working together to influence kernel set.
Severe drought stress, aggravated by excessive heat, can delay silk emergence to the extent that pollen shed is complete or nearly complete by the time the silks finally emerge from the husk. Without a pollen source, ovule fertilization cannot occur.
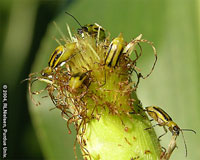
Persistent severe silk clipping by insects such as the corn rootworm beetle or Japanese beetle throughout the active pollen shed period can also limit the success of pollination. The simultaneous effects of severe drought stress on silk emergence can easily amplify the consequences of severe silk clipping.
Severe drought stress coupled with excessive heat and low humidity can sometimes desiccate emerged silks to the point that they are no longer receptive to pollen grain germination. I suspect this is low on the list of possible stressors for Indiana most years (because of our typically high humidity levels), but may have played a role in some fields this year. Similarly, I doubt that pollen viability was an issue for Indiana cornfields because temperatures in the low 90’s are usually not great enough to kill pollen.
Consecutive days of persistent rainfall or showers that keep tassels wet for many hours of a day can delay or interfere with anther exsertion and pollen shed. Remember the remnants of Hurricane Dennis that visited many parts of Indiana earlier last month? I admit to not having a lot of evidence to support the following conjecture, but I suspect that some of the simply weird patterns of poor kernel set evident in some fields that were trying to pollinate during that week may have been related to those many days of showery humid weather (coupled with the excessive cloudiness and its effect on photosynthesis).
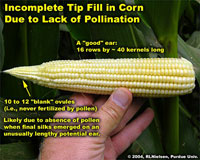
Exceptionally long potential ears resulting from good weather during ear size determination (not an issue for some Indiana fields this year) sometimes fail to pollinate the final kernels near the tip of the cob. Remember, butt silks emerge first and tip silks emerge last. With oversized ears, sometimes those tip silks emerge after all the pollen has been shed. See the “Word to the Wise” below.
Kernel Abortion
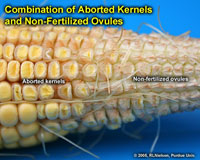
Poor kernel set can also be a reflection of kernel abortion following successful fertilization of the ovules on the cob. In contrast to ineffective pollination, initial kernel development obviously precedes kernel abortion, so the symptoms are usually shriveled remnants of kernels that may be whitish- or yellowish-translucent.
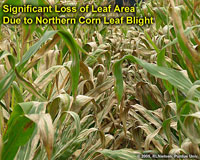
Kernel abortion results from severe stresses that greatly reduce the overall photosynthetic output of the plant very early in the post-pollination grain-filling period. Obvious photosynthetic stressors include severe drought & heat stress, consecutive days of excessively cloudy weather and significant loss of photosynthetically active leaf area (e.g., hail damage, leaf diseases, insect damage, nutrient deficiency).
Warm nights during pollination and early grain fill may indirectly affect survival of developing kernels. Research suggests that the increased rate of kernel development due to warmer temperatures lowers the available amount of photosynthate per unit of thermal time; which then becomes a stressor to kernel development particularly at the tip of the ear, leading to kernel abortion (Cantarero et. al., 1999).
Final Word to the Wise
A plethora (meaning a whole lot) of blank cob tips can quickly ruin the joy of walking a cornfield in the middle of August. Before getting too bent out of shape over the missing kernels, remember to count the number of harvestable kernels on those ears. I’ve been amazed at the number of fields I’ve walked the past week whose ears exhibit 1 to 2 inches of blank tips, yet still contain 16 rows by 30 to 35 harvestable kernels per row. Those are perfectly acceptable ear sizes in a year where dry weather has been a concern.
Related References
Cantarero, M.G., A.G. Cirilo, and F.H. Andrade. 1999. Night temperature at silking affects kernel set in maize. Crop Sci 39:703-710.
Nielsen, R.L. (Bob). 2004a. Estimating Corn Grain Yield Prior to Harvest. Corny News Network, Purdue Univ. Online at www.kingcorn.org/news/articles.04/YieldEst-0718.html.[URL verified 8/8/05].
Nielsen, R.L. (Bob). 2004b. Grain Fill Stages in Corn. Corny News Network, Purdue Univ. Online at www.kingcorn.org/news/articles.04/GrainFill-0705.html. [URL verified 8/8/05].
Nielsen, R.L. (Bob). 2004c. Yield Loss Potential During Grain Fill. Corny News Network, Purdue Univ. Online at www.kingcorn.org/news/articles.04/GrainFillStress-0705.html. [URL verified 8/8/05].
Nielsen, R.L. (Bob). 2005b. Silk Emergence. Corny News Network, Purdue Univ. Available online at www.kingcorn.org/news/articles.05/Silks-0704.html. [URL verified 7/4/05].
Nielsen, R.L. (Bob). 2005c. Tassel Emergence & Pollen Shed. Corny News Network, Purdue Univ. Available online at www.kingcorn.org/news/articles.05/Tassels-0704.html.[URL verified 7/4/05].
Univ. of Illinois. 2005. Estimating Corn Yields. (An Online Calculator). Illinois Agronomy Handbook. Online at www.ag.uiuc.edu/iah/index.php?ch=ch2/est_corn_yield.html. [URL verified 8/8/05].![]()
Estimating Corn Grain Yield Prior to Harvest - (Bob Nielsen)
Fancy colored yield maps are fine for verifying grain yields at the end of the harvest season, but bragging rights for the highest corn yields are established earlier than that down at the Main Street Cafe, on the corner of 5th and Earl. Corn in IndianaSome patrons of the cafe begin “eyeballing” their yields as soon as their crops reach “roasting ear” stage. Some of the guys there are pretty good (or just plain lucky) at estimating yields prior to harvest, while the estimates by others are not even close to being within the proverbial ballpark. Interestingly, they all use the same procedure referred to as the Yield Component Method.
Other pre-harvest yield prediction methods exist (Lauer, 2002; Thomison, 2005), but the Yield Component Method is probably the most popular because it can be used well ahead of harvest; as early as the so-called “roasting ear” or milk (R3) stage of kernel development. Under “normal” conditions, the kernel milk stage occurs about 18 to 22 days after pollination is complete (Nielsen, 2004a). Estimates made earlier in the kernel development period risk being overly optimistic if subsequent severe stresses cause unforeseen kernel abortion (Nielsen, 2004b).
The Yield Component Method was originally described by the University of Illinois many years ago (Univ. of Illinois, 2005) and is based on the premise that one can estimate grain yield from estimates of the yield components that constitute grain yield. These yield components include number of ears per acre, number of kernel rows per ear, number of kernels per row, and weight per kernel. The first three yield components (ear number, kernel rows, kernels/row) are easily measured in the field.
Final weight per kernel obviously cannot be measured until the grain is mature (kernel black layer) and, realistically, at harvest moisture. Consequently, an average value for kernel weight, expressed as 90,000 kernels per 56 lb bushel, is used as a proverbial “fudge factor” in the yield estimation equation.
Crop uniformity greatly influences the accuracy of any yield estimation technique. The less uniform the field, the greater the number of samples that should be taken to estimate yield for the field. There is a fine line between fairly sampling disparate areas of the field and sampling randomly within a field so as not to unfairly bias the yield estimates up or down.
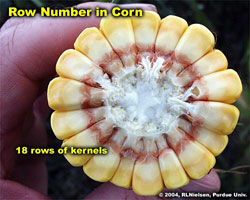
Example of 18-row ear.
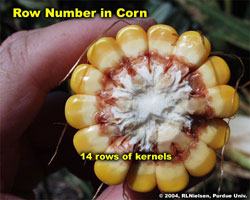
Example of 14-row ear.
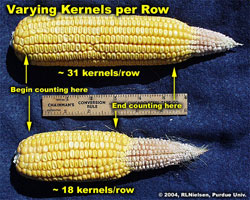
Ears with varying kernal numbers per row.
1. At each estimation site, measure off a length of row equal to 1/1000th acre. For 30-inch (2.5 feet) rows, this equals 17.4 feet.
TIP: For other row spacings, divide 43,560 by the row spacing (in feet) and then divide that result by 1000 (e.g., [43,560/2.5]/1000 = 17.4 ft).
2. Count and record the number of ears on the plants in the 1/1000th acre of row that you deem to be harvestable.
TIP: Do not count dropped ears or those on severely lodged plants unless you are confident that the combine header will be able to retrieve them.
3. For every fifth ear in the sample row, record the number of complete kernel rows per ear and average number of kernels per row. Then multiply each ear’s row number by its number of kernels per row to calculate the total number of kernels for each ear.
TIPS: Do not sample nubbins or obviously odd ears, unless they fairly represent the sample area. If row number changes from butt to tip (e.g., pinched ears due to stress), estimate an average row number for the ear. Don’t count the extreme butt or tip kernels, but rather begin and end where you perceive there are complete “rings” of kernels around the cob. Do not count aborted kernels. If kernel numbers are uneven among the rows of an ear, estimate an average value for kernel number per row.
4. Calculate the average number of kernels per ear by summing the values for all the sampled ears and dividing by the number of ears.
EXAMPLE: For five sample ears with 480, 500, 450, 600, and 525 kernels per ear, the average number of kernels per ear would be (480 + 500 + 450 + 600 + 525) divided by 5 = 511.
5. Estimate the yield for each site by multiplying the ear number by the average number of kernels per ear, then dividing that result by 90. The value of ‘90’ represents the average number of kernels (90,000) in a bushel of corn.
TIP: Use a lower value (e.g., 80) if grain fill conditions have been excellent (larger kernels, fewer per bushel) or a larger value (e.g., 100) if grain fill conditions have been stressful (smaller kernels, more per bushel).
Example
Let’s say you counted 30 harvestable ears at the first sampling site. Let’s also assume that the average number of kernels per ear, based on sampling every 5th ear in the sampling row, was 511. The estimated yield for that site would (30 x 511) divided by 90, which equals 170 bu./ac.
Repeat the procedure throughout field as many times as you deem to be representative. Calculate the average yield for all the sites to estimate the yield for the field.
Remember that this method for estimating pre-harvest grain yield in corn indeed provides only an estimate. Since kernel size and weight will vary depending on hybrid and environment, this yield estimator should only be used to determine “ballpark” grain yields. Yield will be overestimated in a year with poor grain fill conditions (e.g., low kernel size and weight from a drought year) and underestimated in a year with excellent grain fill conditions (e.g., larger kernel size and weight from non-stress grain fill periods).
You can try to improve the yield estimation for unusual grain fill conditions by adjusting the estimation formula . For example, if you believe that kernel weight will be lower due to stress during grain fill, you may elect to replace the value of “90” in the equation with “100” to reflect the potential for smaller and lighter kernels (i.e., more kernels per 56 lb. bushel). Conversely, in a good crop year, you may elect to replace the value of “90” in the equation with “80” to reflect the potential for larger and heavier kernels (i.e., fewer kernels per 56 lb. bushel).
Recognize that the Yield Component Method for estimating corn grain yield is probably only accurate within plus or minus 30 bushels of the actual yield. Obviously, the more samples you measure within a field, the more accurately you will “capture” the variability of yield throughout the field. Use the yield estimates obtained by this method for general planning purposes only.
Related References
Lauer, Joe. 2002. Methods for Calculating Corn Yield. Agronomy Advice, Univ. of Wisconsin-Madison. Online at http://corn.agronomy.wisc.edu/AAdvice/2002/A033.pdf. [URL verified 8/9/05].
Nielsen, R.L. (Bob). 2004a. Grain Fill Stages in Corn. Corny News Network, Purdue Univ. Online at www.kingcorn.org/news/articles.04/GrainFill-0705.html. [URL verified 8/9/05].
Nielsen, R.L. (Bob). 2004b. Yield Loss Potential During Grain Fill. Corny News Network, Purdue Univ. Online at www.kingcorn.org/news/articles.04/GrainFillStress-0705.html. [URL verified 8/9/05].
Nielsen, R.L. (Bob). 2005. Kernel Set Scuttlebutt. Corny News Network, Purdue Univ. Online at www.kingcorn.org/news/articles.05/KernelSet-0809.html. [URL verified 8/9/05].
Thomison, Peter. 2005. Estimating Yield Losses in Drought Damaged Corn Fields. C.O.R.N. Newsletter, Ohio State Univ. Online at http://corn.osu.edu/story.php?setissueID=96&storyID=571 [URL verified 8/9/05].
Univ. of Illinois. 2005. Estimating Corn Yields. (An Online Calculator). Illinois Agronomy Handbook. Online at www.ag.uiuc.edu/iah/index.php?ch=ch2/est_corn_yield.html. [URL verified 8/9/05].
For other Corny News Network articles, browse through the CNN Archives at www.kingcorn.org/news/archive.html. For other information about corn, take a look at the Corn Growers’ Guidebook at www.kingcorn.org.
![]()
Impact of Warm Night Temperatures on Corn Grain Yields – (Peter Thomison, Ohio State University)
When we experience a hot, dry growing season like that of 2005, we often focus our attention on the appearance of stressed plants (leaf rolling, leaf firing, poor canopy closure), and relate stress symptoms or injury to lower yield potential. However warm night temperatures, which are often associated with drought, also adversely affect yield potential. High night temperatures (in the 70s or 80s) result in wasteful respiration and a lower amount of dry matter accumulation in plants. With high night temperatures more of the sugars produced by photosynthesis during the day are lost; less is available to fill developing kernels grain, thereby lowering potential grain yield. Past research indicates that corn grown at night temperatures in the mid 60s outyields corn grown at temperatures in the mid 80s. Corn yields are often higher with irrigation in western states, which have low humidity and limited rainfall. While these areas are characterized by hot sunny days, night temperatures are often cooler than in the Eastern Corn Belt. Low night temperatures account in part for our record high corn yields in 2004. During most of the 2004 growing season, temperatures were below normal. From late June through most of August, a period of time that included most of the grain fill period, weekly temperatures were cooler than normal - as much as 4 to 7 degrees below normal in August. Cool night temperatures in 2004 reduced respiration losses during grain fill. The absence of moisture stress was especially important during grain filling. In parts of the Ohio where rainfall was below average during grain fill in July and August, cooler than average temperatures minimized moisture stress. The high corn yields of 2003 were also associated with cooler than normal night temperatures during the grain fill period.
Impact of drought on grain composition
Drier and warmer than normal conditions during late vegetative development and grain fill also influence grain composition. When drought stress conditions severely depress corn yields, protein deposited early in the kernels is less diluted by starch deposited later during grain fill; consequently grain protein concentration increases. Conversely, optimum soil moisture, whether from rain or irrigation, promotes filling of kernels with starch and reduces protein content.
![]()
Assessing Potential For Nitrate Problems in Corn – (Peter Thomison, Ohio State University)
Hot dry weather across Ohio has raised questions concerning the potential for toxic levels of nitrates in corn harvested for silage. Nitrates absorbed from the soil by plant roots are normally incorporated into plant tissue as amino acids, proteins and other nitrogenous compounds. Thus, the concentration of nitrate in the plant is usually low. The primary site for converting nitrates to these products is in growing green leaves. Under unfavorable growing conditions, especially drought, this conversion process is retarded, causing nitrate to accumulate in the stalks, stems and other conductive tissue. The highest concentration of nitrates is in the lower part of the stalk or stem. For example, the bulk of the nitrate in a drought-stricken corn plant can be found in the bottom third of the stalk. If moisture conditions improve, the conversion process accelerates and within a few days nitrate levels in the plant returns too normal.
The highest levels of nitrate accumulate when drought occurs during a period of heavy nitrate uptake by the corn plant. A drought during or immediately after pollination is often associated with the highest accumulations of nitrates. Extended drought prior to pollination is not necessarily a prelude to high accumulations of nitrate. The resumption of normal plant growth from a heavy rainfall will reduce nitrate accumulation in corn plants, and harvest should be delayed for at least 1 to 2 weeks after the rainfall. Not all drought conditions cause high nitrate levels in plant. If the supply of soil nitrates is in the dry soil surface, plant roots will not absorb nitrates. Some soil moisture is necessary for absorption and accumulation of the nitrates.
If growers want to salvage part of their drought damaged corn crop as silage, it’s best to delay harvesting to maximize grain filling, if ears have formed. Even though leaves may be dying, the stalk and ear often have enough extra water for good fill. Kernels will continue to fill and the increases in dry matter will more than compensate for leaf loss unless plants are actually dying or dead. Moreover if nitrate levels are high or questionable, they will decrease as plant get older and nitrates are converted to proteins in the ear.
For information on testing and feeding corn with varying nitrate-nitrogen levels, check out the following:
Drought-Stressed Corn For Silage - Bill Weiss available on-line at http://corn.osu.edu/archive/2002/jul/02-24.html#linka.
Nitrates in Dairy Rations - Maurice Eastridge and Bill Weiss, Ohio State University Fact Sheet AS-0003-99 available on-line at http://ohioline.ag.ohio-state.edu/as-fact/0003.html.
![]()