

Phosphorus (P) and potassium (K) fertilizer prices have increased dramatically in recent months. If you cannot afford all the fertilizer P and K you think you need or there is not enough fertilizer to be had, you might want to prioritize their use on your farm. The key to prioritizing P and K use is to have recent soil test information for your fields.
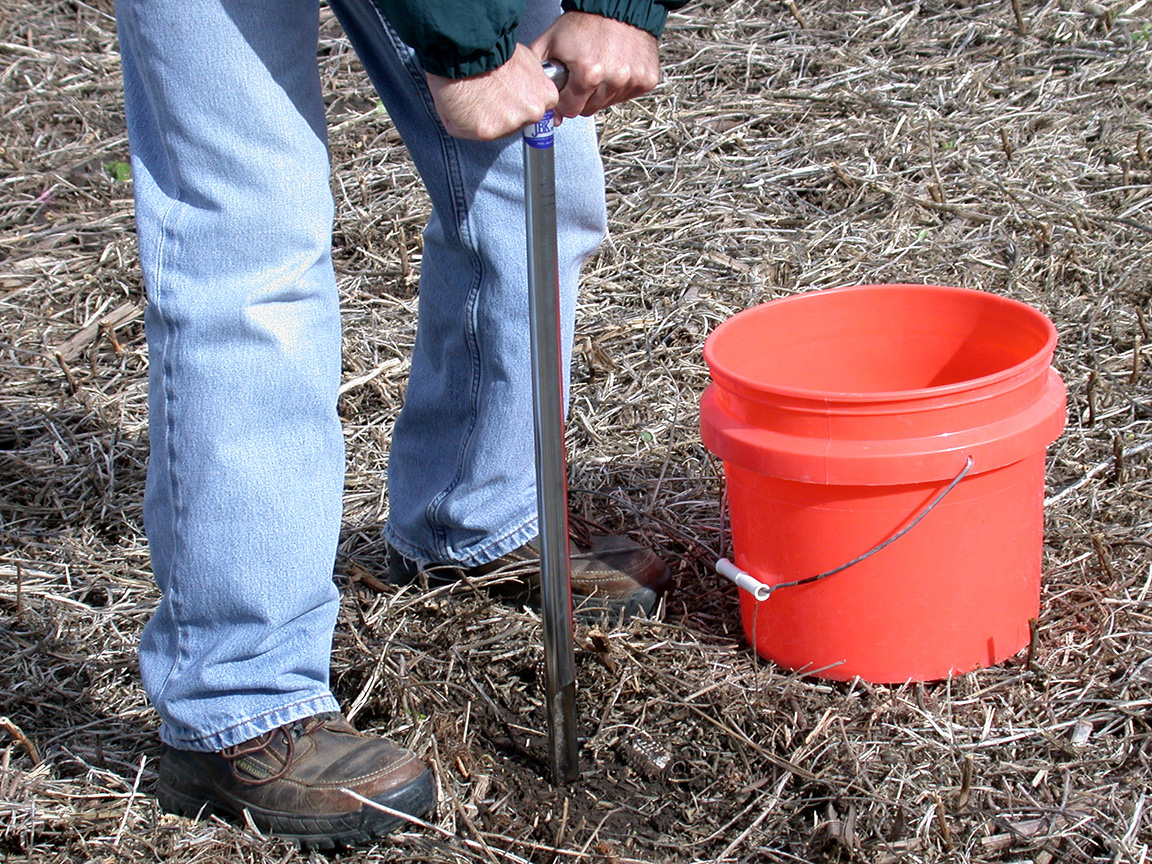
Now is a great time to find out what P&K is out there! (Photo Credit: John Obermeyer)
Top Priority: If soil test levels are below the critical level (Figure 1, Table 1) then crop yield response to added P and/or K might occur. These low testing fields or areas in a field should be given the highest priority for fertilization. The further the soil test is below the critical level the more likely yield will increase with application of that nutrient and that yield increase will likely be larger. The fertilizer application rates recommended for soil tests below the critical level are designed to maximize crop response, replace crop removal, and add extra P2O5 and K2O to increase soil test levels to the critical level over a four-year period (Table 2). Recent research with K fertilization of corn and soybean1 suggests the current rates recommended are about right for maximizing crop response at very low soil test K levels, so be careful if you decide to apply less than recommended rates on soils testing low in K.
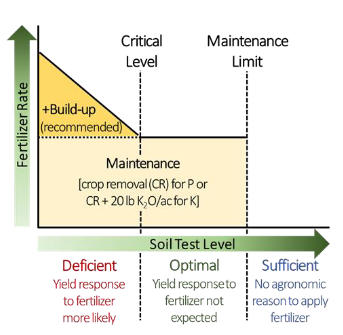
Figure 1. Fertilizer recommendations for P and K based on soil test levels and likelihood of response to applied fertilizer.
Unfortunately, we don’t have any recent research on optimizing P rates on soils testing very low in P. However, older research found applying some of the P in a starter band and the remainder broadcast was better than all broadcast or all banded. If you need to compare the price of P in MAP, DAP, and 10-34-0 use this on-line tool: https://ag.purdue.edu/digital-ag-resources/phosphorus-cost-comparison-tool/.
Secondary Priority: Our traditional recommendation has been to maintain soil test levels of P and K between their respective critical levels and the maintenance limits (Table 1). Within this maintenance range, we normally recommend replacing crop P2O5 and crop K2O removal (Table 3) plus 20 pounds of K2O per acre to maintain soil test at about the same level.
However, understand that within this maintenance range of soil test levels, a yield response to this year’s fertilizer is not expected. Consequently, this provides the flexibility to not apply fertilizer without risk of incurring yield losses when fertilizer prices are high, fertilizer is scarce, commodity prices are low, and/or if weather prevents application.
| Table 1. Soil test critical level and maintenance limit for phosphorus and potassium fertilization of corn and soybean for different soil test methods and cation exchange capacity (CEC). |
|||
|---|---|---|---|
| Critical level | Maintenance limit | ||
| Soil test method (CEC) | Nutrient | Parts per million (pounds per acre) | |
| Bray-P1 | Phosphorus (P) | 15 (30) | 30 (60) |
| Ammonium acetate (5 meq/100g) | Potassium (K) | 88 (176) | 118 (235) |
| Ammonium acetate (15 meq/100g) | Potassium (K) | 115 (230) | 145 (290) |
| Mehlich-3 | Phosphorus (P) | 20 (40) | 40 (80) |
| Mehlich-3 (<5 meq/100g) | Potassium (K) | 100 (200) | 130 (260) |
| Mehlich-3 (>5 meq/100g) | Potassium (K) | 120 (240) | 170 (340) |
| Table 2. Phosphorus and potassium recommendations for corn and soybean by different soil test methods and cation exchange capacity at selected soil test levels below the critical level and specific grain yields. Bray and ammonium acetate recommendations shown below are based on original Tri-State Fertilizer Recommendations2, but updated to utilize current estimates of crop removal (Table 3). Mehlich-3 recommendations are from the 2020 updated Tri-State Fertilizer Recommendations3. | ||||
|---|---|---|---|---|
| Corn, 200 bu/ac | Soybean, 50 bu/ac | |||
| Soil test method (cation exchange cap.) |
Soil test level (ppm (lbs/ac) |
Nutrient | Nutrient recommended, lbs/ac | |
| Bray-P1 | 10 (20) | P2O5 | 95 | 65 |
| Ammonium acetate K (5 meq/100g) | 65 (130) | K2O | 90 | 105 |
| Ammonium acetate K (15 meq/100g) | 90 (180) | K2O | 80 | 95 |
| Mehlich-3 P | 15 (30) | P2O5 | 95 | 65 |
| Mehlick-3 K (5 meq/100g) | 75 (150) | K2O | 90 | 110 |
| Mehlick-3 K (5 meq/100g) | 100 (200) | K2O | 95 | 115 |
| Table 3. Corn and soybean removal of P2O5 and K2O in grain | ||
|---|---|---|
| Grain nutrient removal | ||
| Crop | lb P2O5/bushel | lb K2O/bushel1 |
| Corn | 0.35 | 0.20 |
| Soybean | 0.80 | 1.15 |
| 1Maintenance recommedations for K add 20 lb K2O/acre to the estimate of K2O removed in the grain. | ||
Lowest Priority: If soil test P and K are above the maintenance limits (Table 1) there is no agronomic need to apply P and K and no need to replace crop nutrient removal in the short term. Soil test levels change very slowly over time. We estimate soil test P and K will only decrease about 1 part per million (2 pounds per acre) for every 10 to 20 pounds of K2O or P2O5 removed from the soil. Nutrient removal levels in Table 2 can be used to estimate the decrease in soil test levels that will occur in the absence of fertilizer application. It will take several years before soil test levels fall below the critical level if initial soil test levels begin above the maintenance limit. Regular soil sampling will also help monitor the changes in soil tests.
References:
1Helms, Alex, “Effect of Potassium Fertilizer in a No-Till Corn and Soybean Rotation with very low Soil Test Potassium” (2021). Creative Components. 854. https://lib.dr.iastate.edu/creativecomponents/854
2See pages 49, 51 in: Culman, S., A. Fulford, J. Camberato, and K. Steinke. Tri-State Fertilizer Recommendations for Corn, Soybean, Wheat, and Alfalfa. (2020) Bulletin 974. https://ag.purdue.edu/agry/soilfertility/Documents/Tri-State%20Fertilizer%20Recommendations.pdf
3See pages 36, 38 in above publication.
