

I am excited this season to be able to share three new tools from the Crop Protection Network. I strongly recommend you bookmark these on your favorite electronic device(s).
- Crop Disease Forecasting https://cropprotectionnetwork.org/crop-disease-forecasting
- Fungicide Efficacy Tool https://cropprotectionnetwork.org/fungicide-efficacy-tool
- Corn Fungicide ROI Calculator https://cropprotectionnetwork.org/fungicide-roi-calculator
These tools are from a culmination of a long-standing collaboration of university extension specialists as part of multiple working groups such as the Corn Disease Working Group (CDWG), The North Central Regional Committee on Soybean diseases (NCERA-137), The North Central Regional Committee on Management of Small Grain Diseases (NCERA-184), and The Alfalfa Pest Management Working Group. Many of these groups have developed annual uniform testing protocols which are then implemented across the country in various states.
Both the Fungicide Efficacy Tool and Corn ROI calculator are based on unbiased, research-based data collected from university uniform trials. Usually, we test between five to 10 fungicide products per year, per trial. Products are selected based on availability and market share, and typically represent products available to and used by a majority of farmers. Focus is also placed on newer products where efficacy data might be lacking across the corn, soybean, and wheat production belts of the United States. This includes data from here in Indiana. Our research program has contributed data since 2018 from trials that we have run at the Purdue Agricultural Centers (PACs) and Purdue Agronomy Center for Research and Education (ACRE). We have also contributed disease data for the tar spot, gray leaf spot, and frogeye models in the Crop Risk Tool. None of our work is possible without support from multiple funding sources, as support will vary state to state. Here in Indiana, we have had support from Indiana Corn and Marketing Council, Indiana Soybean Alliance, the National Predictive Modeling Tool Initiative, National Corn Growers Association, North Central Soybean Research Program, United Soybean Board, and National Wheat and Barley Scab Initiative for many research projects over the last seven field seasons.
Crop Risk Tool https://cropprotectionnetwork.org/crop-disease-forecasting
The Crop Risk Tool is providing weather-based forecasting and risk assessments for various crop diseases, helping farmers, crop advisors, and agricultural researchers to make data-driven decisions.
Disease models available for field crops:
- Corn: tar spot and gray leaf spot
- Soybean: white mold and frogeye leaf spot
In addition, there are models for dry beans, potatoes, tomatoes, carrots, beets and onions.
In the tool you have the ability to upload or select field sites of interest. These sites will be remembered upon returning to the website from the device they were entered. I actually downloaded the CSV and have all my Purdue sites available on both my computer and cell phone. See below in Figure 1 where I have pulled the weather data from the past month. The tool will also allow you to go back in time and look at the last year (be patient if you have a number of sites, as it may take the model a short time to acquire all site-specific weather data to run.
A few things to keep in mind when running these disease risks:
- The model assumes the disease and/or spores are present in the field (fields with a history).
- The crop is currently at a growth stage that the disease is of concern, so for corn that would be V10 to R3, soybean for white mold it would be growth stages R1-R3 (flowering) AND when the rows are nearly closed, and for frogeye leaf spot when in the growth stages R1-R5.
This is a great new tool to explore. It can also be a tool for researchers as it is an easy interface that will allow you to view and download hourly weather data for any point in the continental United States. The current models will compute daily values, moving averages, growing degree days, and selected plant disease risk values (more information is available on the website).
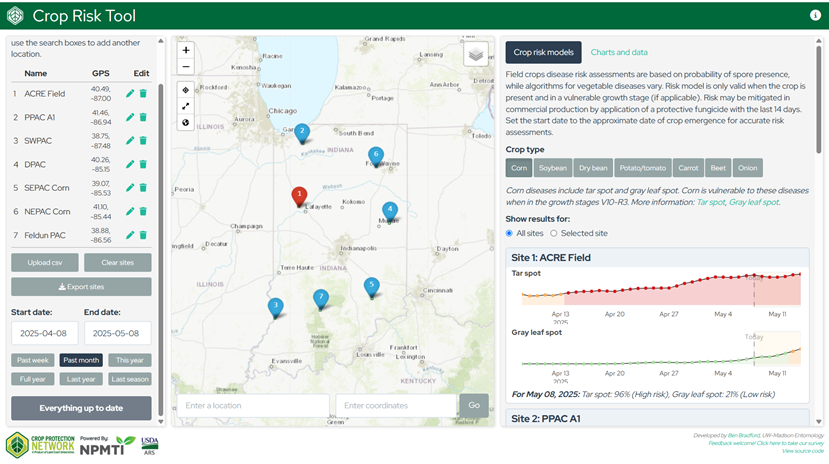
Figure 1. An example of the Crop Risk Tool and the Purdue farms we are monitoring across Indiana. It includes an example of the risk of the past month for tar spot and gray leaf spot should the crop be at growth stages V10-R3 (accessed May 8, 2025).
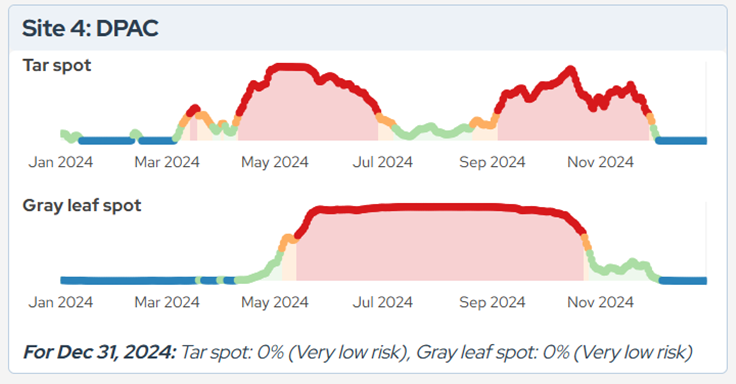
Figure 2. A historic review of last year’s risk for tar spot and gray leaf spot at the Davis Purdue Ag Center, Farmland IN. This area in Indiana did see some significant issues with tar spot in 2024.
Fungicide Efficacy Tool https://cropprotectionnetwork.org/fungicide-efficacy-tool
The fungicide efficacy tool will allow you to quickly filter the fungicide efficacy table data created by the Crop Protection Network for the various crops, specific disease targets and/or products of interest.
See an example of corn foliar, tar spot and FRAC 3 search in Figure 3.
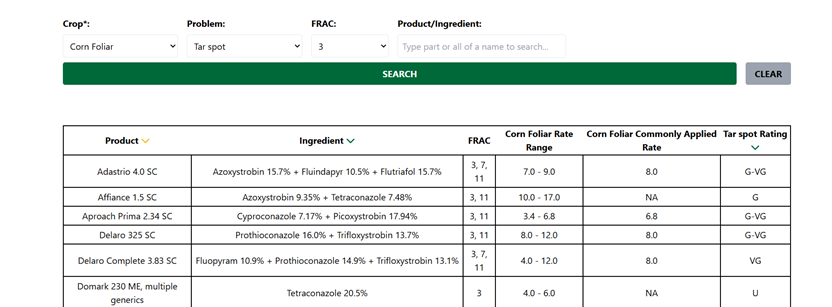
Figure 3. A search of the Fungicide Efficacy Tool for products available for tar spot on corn that contain a FRAC 3 active ingredient.
Corn Fungicide ROI Calculator https://cropprotectionnetwork.org/fungicide-roi-calculator
The Corn Fungicide ROI Calculator is a new tool that can help farmers make a decision about applying a fungicide for foliar disease management in corn. The calculator will help calculate the potential return on investment (ROI) for corn fungicide application across a variety of user-defined factors, which is based on university research data. I am showing an example of where I selected high disease severity, an expected yield of 220 bu/A and expected commodity price of $5/bu, using the already populated treatment costs per acre (Figure 4). The calculator then generates treatment cost for the various products, expected Net Benefit/A, and a breakeven probability. If you look at my selection for a field under high disease pressure the six products have a cost range of $19.38 to $37.11/A, an expected net benefit/Acre from $7.06 to $18.96 with a breakeven probability of 53.2% to 62.8%.
The treatment costs can be adjusted if a farmer knows that they can purchase them at a different cost per product, so you are able to get a more targeted result for your individual farm.
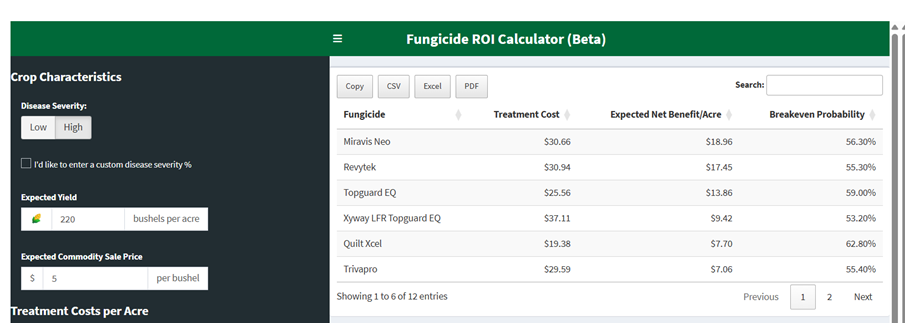
Figure 4. An example of fungicide ROI calculated for a field with high disease severity, expected yield of 220 bu/A at a commodity price of $5 per bushel using the pre-populated treatment cost.
The Crop Protection Network (CPN) website, https://cropprotectionnetwork.org/, has many additional resources from a multi-state and international collaboration of university and provincial extension specialists, and public and private professionals who provide unbiased, research-based information to farmers and agricultural personnel. The goal of CPN is to communicate relevant information that will help professionals identify and manage field crop diseases or other issues related to crop production.
Citations.
Crop Protection Network. 2024. Corn Fungicide Return On Investment Calculator. Corn Disease Working Group. Https://cropprotectionnetwork.org/fungicide-roi-calculator. Doi.org/10.31274/cpn-20240724-0.
