

Field research trials are an important part of understanding how specific agronomic practices can improve farm productivity. Universities such as Purdue use both research station and on-farm research trials across the state to help drive our recommendations and provide management information for Indiana farmers. However, some of our research practices and conclusions may differ from various private-sector research trials and potentially what you may see on your own farm. For example, questions may arrive as to “why did they set up the research trial that way?”, “what are those letters next to the yield values they are presenting?”, and “why does it seem the university never sees any yield responses from various products?” Therefore, it is important to understand how we approach field research trials, the steps we take to determine our conclusions, and how understanding these approaches can help you better understand and test practices more accurately on your own farm.
The first question I often ask people when discussing research is 1) do you have a yield monitor in your combine? and 2) when traveling across the field during harvest, do those yield values stay the same? The answer I receive 100% of the time is no (if yes, you may need to consider a new monitor), and this is largely due to the variability throughout the field caused by soil type differences, elevation differences, etc. Therefore, when setting up field research trials we often designate a treatment (e.g., new product) and compare that to a non-treated control (e.g., business as usual). And, one of the most important questions we ask after harvest is 1) was the yield difference observed truly caused by the product we applied? or 2) was the yield difference only due to the treated areas being in a more productive part of the field. For example, in Figure 1, if I split a field in half and apply my treatment on one half of the field and don’t apply my treatment on the other half of the field, I may find a yield difference of 15 bushels per acre and think to myself “I should apply this product on all of my acres”. However, when you look closer, it is easy to see that the treated area of the field encompassed a larger portion of one soil type, whereas the non-treated area encompassed a larger portion of another soil type. Therefore, it is difficult to differentiate if the yield response was due to the product applied, or was it just due to the treated area being in a more productive area of the field?
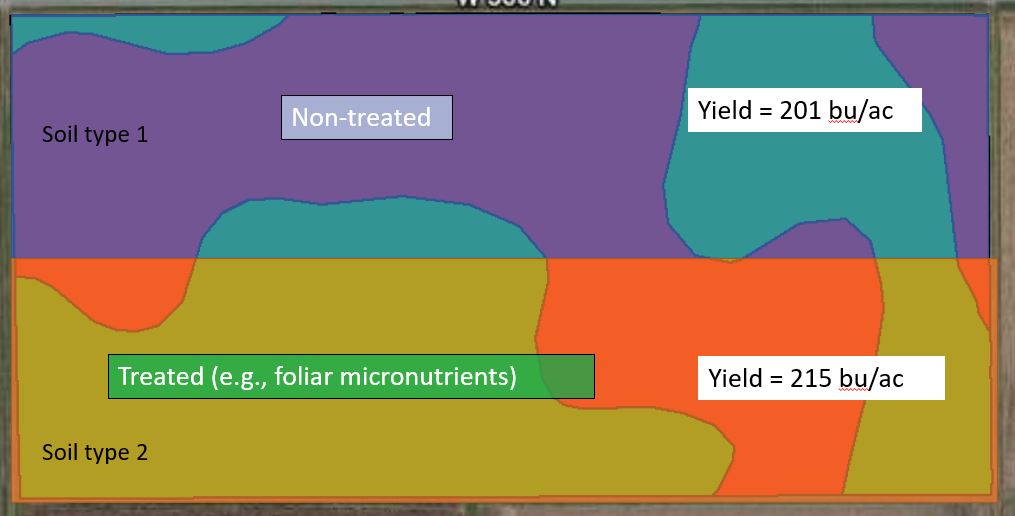
Figure 1. Example of a split-field comparison between a non-treated control and a designated treatment.
In our university research trials, we approach testing a treatment within a field using randomization, replication (repetition of an experiment in similar conditions), and statistics (Figure 2 and Table 1). For example, if you compare Figure 1 and Figure 2, Figure 2 highlights how we typically set up one of our research trials using replication and randomization of the treated and non-treated passes to account for field differences. Each of these practices help us improve the reliability of our conclusions, account for random error (e.g., field variability), and determine the true causes of yield differences observed. Furthermore, it is also important for us to perform these research trials across multiple locations and multiple years to determine how treatment responses may differ in different fields and different environments. We also use statistical models to help determine our conclusions (Table 1). Using statistics helps us determine if the differences we detect are due to random error, or due to the treatment we tested. For example, if you have ever seen university data presented, you have probably seen data presented similar to Table 1. At first glance, after we randomized and replicated our treatments (Figure 2), the treated areas seem to have increased corn yield by 4 bushels per acre (Table 1). However, our conclusions were no yield differences were observed. Therefore, through the research steps we implemented, it was determined that the yield difference was due to random error (e.g., field variability) and not due to the product or management practice tested. The letters next to the yield values help us highlight where statistical (yield differences due to treatments) differences were observed.
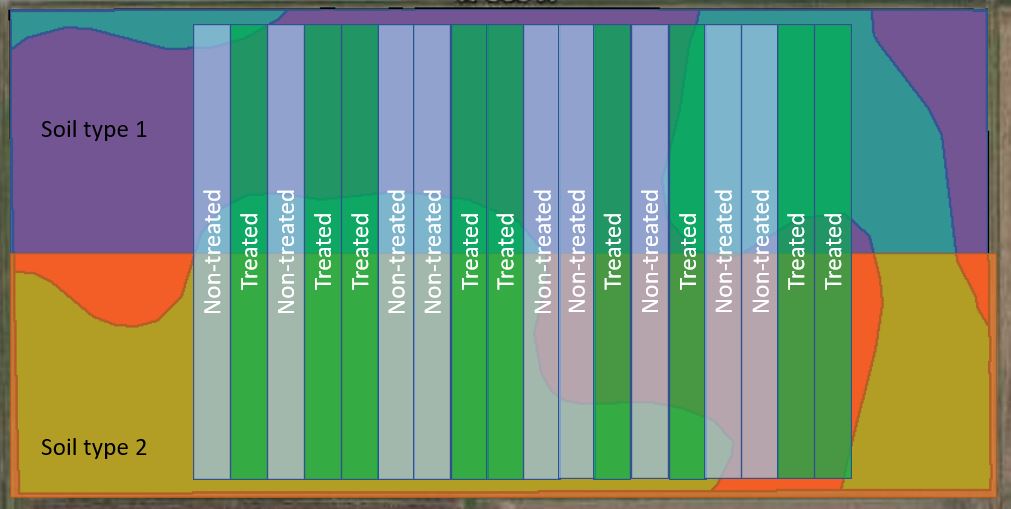
Figure 2. Example of a replicated and randomized field research trial comparison between a non-treated control and a designated treatment.
| Treatment | Yield (bu/ac) |
|---|---|
| Non-treated | 204 a* |
| Treated | 208 a |
| *Average yield values which contain the same corresponding letters are not statistically different (P>0.1) from each other. | |
In conclusion, when testing a new product or practice on your own farm, it is important to think about how to design and set up a trial to accurately test the new product or practice. Just because a yield difference is observed, doesn’t always mean the new product or practice you tested is the reason for this difference. At Purdue, it is our goal to accurately assess new products and practices to determine whether or not these are truly the reason behind observed yield differences. In addition, as you sit in on various meetings, presentations, and examine research results, ask yourself 1) how did they design and set up this research trial? did they use randomization, replication, and statistics, and if not, is the yield differences being discussed truly due to the product applied? and how many different environments and years was this product tested? Understanding and asking these questions can help determine the best products and management practices to implement and improve your operation.
If you are interested in working with Purdue University to perform on-farm research at your own farm to help improve our recommendations, improve your operation, and improve your understanding of the data collected, please reach out to Dan Quinn (djquinn@purdue.edu).
