

Seed corn represents the single most expensive variable input cost for Indiana corn growers (Langemeier et al., 2019) and so choosing the most economical seeding rate is important for maximizing that dollar return to seed at harvest time. Choosing the most economical seeding rate involves balancing the cost of the seed corn and the price you expect to receive for the harvested grain when you sell it. Just as importantly, the most economical seeding rate depends on the yield response of corn to final PLANT POPULATION.
Jim Camberato (jcambera@purdue.edu) and I conducted nearly 100 field scale trials around Indiana from 2008 through 2019 to document the yield response of corn to PLANT POPULATION. The complete summary of that research is available online (Nielsen et al., 2019).
Figure 1 below comes from that summary and illustrates the average yield response of corn to final PLANT POPULATION for 83 trials that represent a range of growing conditions that we characterize as “normal” for Indiana. In particular, those 83 trials were not subject to severe drought conditions. Mathematically, maximum corn yield occurred at a final PLANT POPULATION of about 32,000 PLANTS per acre.
Note how “shallow” or nearly “flat” the yield response curve is for those 83 trials. That “flatness” reflects how tolerant today’s hybrids are to higher populations, much more so than hybrids were 30 years ago. However, also note how tolerant today’s hybrids are to lower populations. The tolerance to both low and high populations results in the shallow response curve.
The upshot of such a shallow yield response curve is that “squeezing” one more bushel from a field by increasing seeding rate, when the POPULATION is near the optimum to start with, requires more seed than you can afford. In fact, our data suggest that potential yield at final PLANT POPULATIONS ranging from about 28,000 to 35,000 PLANTS per acre at harvest varies by only +/- 1 bushel per acre!
The dollars and cents upshot of the shallow yield response curve is that the ECONOMICAL OPTIMUM PLANT POPULATION for corn throughout most of Indiana is amazingly low. Table 1, also from our complete online summary, provides estimates of economic PLANT POPULATIONS for a range of seed corn costs and market grain prices.
The astute reader will have noticed my use of the capitalized term “PLANT POPULATION”. The reason for that is corn responds the actual plant population in the field, not directly to the seeding rate because percent stand success is rarely 100%. In our own field trials, we know that average percent stand is 95%. For other folks, that number may be 90% or 98% or 85%.
Assuming you know your typical percent stand from past field scouting, then you can calculate the seeding rate that targets a desired economic optimum plant population by simply dividing the target PLANT POPULATION by the percent stand. For example, if you are aiming for a final stand of 30,000 PLANTS per acre and your average percent stand success is 95%, then the seeding rate to achieve that target would be 30,000 divided by 0.95, which would equal a seeding rate of about 31,600 SEEDS per acre.
The final comment I would make is that optimum PLANT POPULATION for drought prone fields is obviously lower than for fields with adequate soil moisture. Our data suggests that the optimum population for droughty fields is 5 to 10,000 fewer PLANTS.
Reference List
Langemeier, Michael R., Craig L. Dobbins, Bob Nielsen, Tony J. Vyn, Shaun Casteel, and Bill Johnson. November 2019. 2020 Purdue Crop Cost & Return Guide. Purdue Extension Publ. ID-166-W. https://ag.purdue.edu/commercialag/home/wp-content/uploads/2019/10/id166_2020-november-2019-projections.pdf [URL accessed Mar 2020].
Nielsen, RL (Bob), Jim Camberato, and Jason Lee. 2019. Yield Response of Corn to Plant Population in Indiana. Applied Crop Production Research Update, Purdue Univ. Dept. of Agronomy. http://www.kingcorn.org/news/timeless/CornPopulations.pdf [URL accessed Mar 2020].
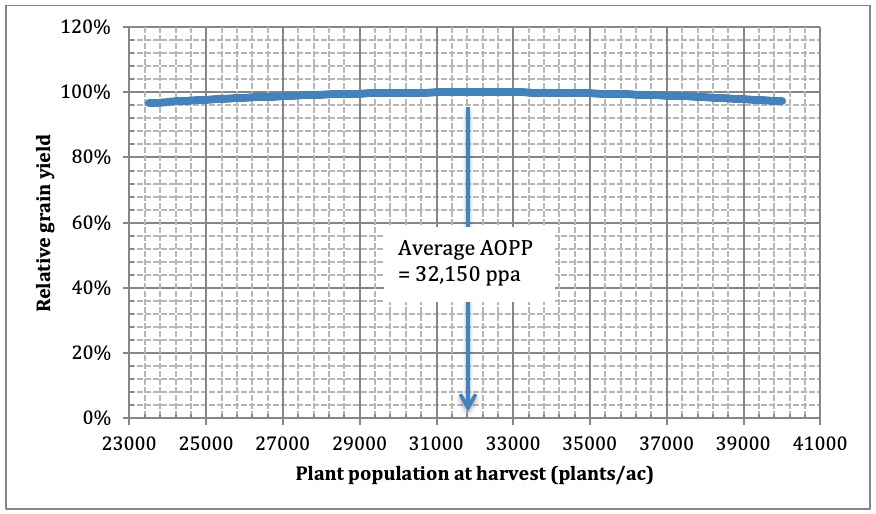
Fig. 1. Average grain yield response of corn (relative yield, 0 to 100%) to plant populations at harvest (plants per acre), based on the aggregated results of 83 field scale trials conducted across Indiana from 2008 to 2018 that represented a normal range of growing conditions (minimal to modest stress). The agronomic optimum population (AOPP) for this group of trials was 32,150 plants per acre at harvest with an average yield of 195 bushels per acre.
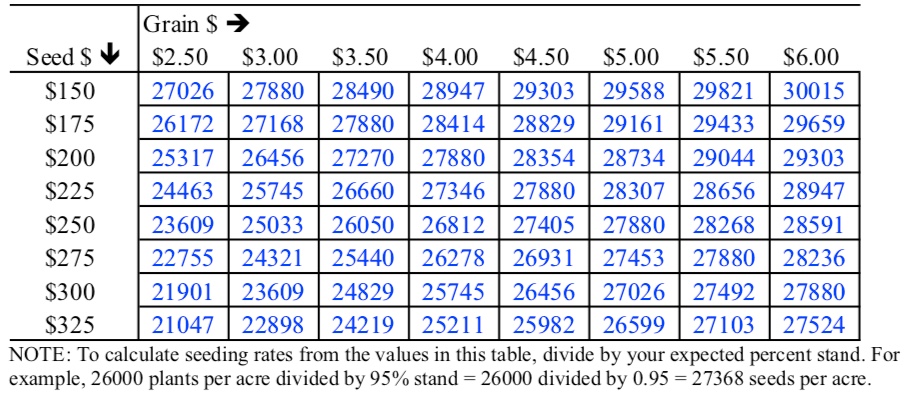
Table 1. Plant populations that maximize marginal return to seed (i.e., economic optimum plant populations) for combinations of market grain price per bushel and seed cost per 80,000 seed unit, based on average yield response to population in 83 Indiana trials conducted from 2008-2018 that represented a normal range of growing conditions (not severe stress conditions).
