

- Corn grain yields in the U.S. have steadily increased since the late 1930’s.
- Only two major shifts in U.S. corn yield trends have occurred since statistics were first published in 1866.
- Year-to-year departures from trend yield are influenced primarily by year-to-year variability in growing conditions.
Historical trends of grain yield improvement offer us a glimpse of yields yet to come, although, like the stock markets, past performance is no guarantee of the future. The historical yield data for corn in the U.S. illustrate the positive impact of improved crop genetics and improved crop/soil management practices.
American farmers grew open-pollinated corn varieties until the rapid adoption of hybrid corn began in the late 1930’s. From 1866, the first year USDA began to publish corn yield estimates, through about 1936, yields of open-pollinated corn varieties in the U.S. were fairly stagnant and only averaged about 26 bu/ac (1.6 MT/ha) throughout that 70-year period (Fig. 1).
It is amazing that there was no appreciable change in productivity over that 70-year time period, even though farmers’ seed-saving practices represented a form of plant breeding that one would have expected to result in small increases in yield over 70 years. Kutka (2011) suggests that the absence of significant yield improvement in these open-pollinated varieties was not so much a result of ineffective plant breeding by farmers as it was the inability to produce, or maintain, high quality seed for the next year’s planting and farmers’ generally low adoption of agronomically sound crop and soil management practices.
Rapid adoption of double-cross hybrid corn by American farmers began in the late 1930’s, in the waning years of the Dust Bowl and Great Depression. Within a very few years, the national yield statistics indicated that a genuine “miracle” of corn grain yield improvement had occurred. The annual rate of yield improvement, which heretofore had been about zero, increased to about 0.8 bushels per acre per year from about 1937 through about 1955 (Fig. 1). This dramatic improvement in yield potential must have truly seemed like a miracle to American farmers.
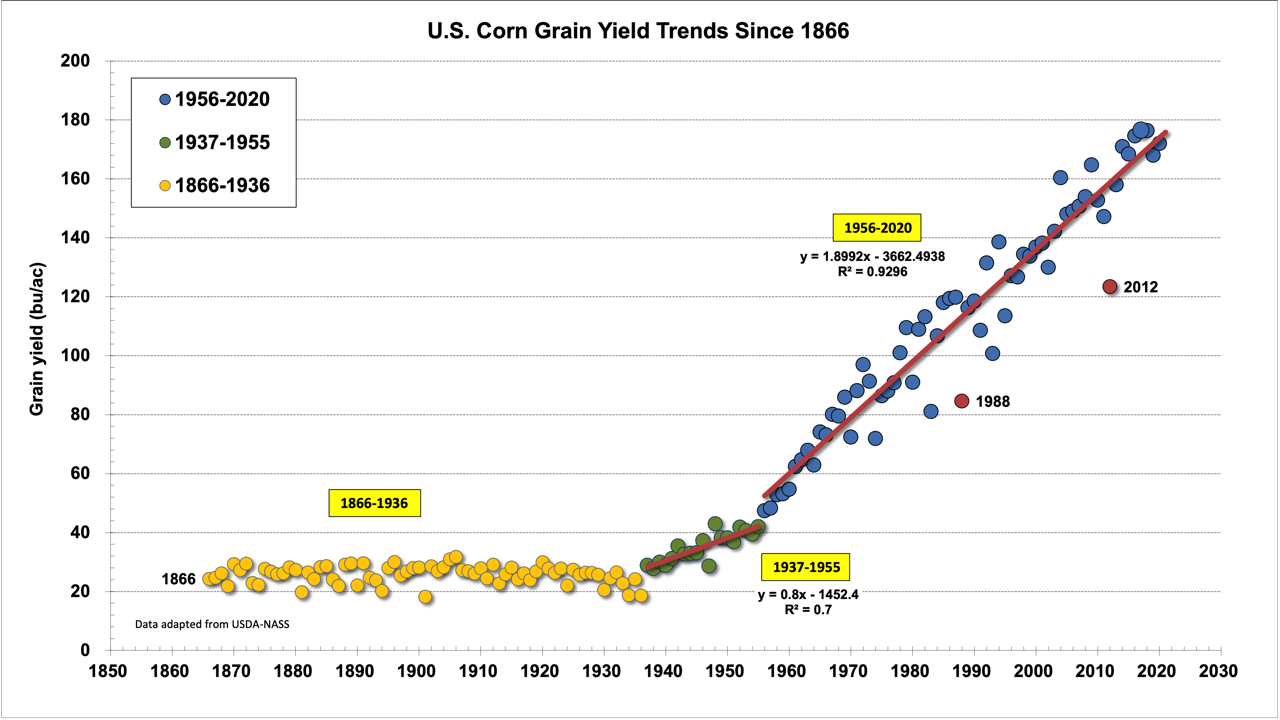
Fig. 1. Annual U.S. Corn Grain Yields and Historical Trends Since 1866.
Data derived from annual USDA-NASS Crop Production Reports.
The second “miracle” of corn grain yield improvement began in the mid-1950’s (Fig. 1) in response to continued improvements in genetic yield potential and stress tolerance plus increased adoption of N fertilizer, chemical pesticides, agricultural mechanization, and overall improved soil and crop management practices. The annual rate of corn yield improvement more than doubled to about 1.9 bushels per acre per year and has continued at that steady rate ever since, sustained primarily by continued improvements in genetics and crop production technologies (Fig. 1).
Some speculate that a third “miracle” of corn grain yield improvement began in the mid-1990’s with the advent and rapid adoption of transgenic hybrid traits (insect resistance, herbicide resistance). In fact, a number of seed industry ‘experts’ confidently promised that average US corn grain yield would approach 300 bushels per acre by 2030 due to these advances in biotechnology (Schill, 2007). However, the USDA-NASS yield data show little to no evidence that yield trend over the past 25 years has deviated from the long-term 1.9 bushels per acre per year (Fig. 1). Indeed, these data simply reflect the fact that currently available transgenic hybrid traits do not literally increase genetic yield potential above and beyond “normal” genetic improvements in corn hybrids. Rather, these traits simply protect the inherent yield potential of modern hybrids while potentially reducing farmers’ reliance on chemical pesticides. A true third “miracle” of corn yield improvement remains somewhere “beyond the horizon”.
Trend Line Trivia: Historical trend lines offer a useful way to visualize changes over time. The historical trend yield lines shown in Fig. 1 are technically linear regression lines and represent the best “fit” method for describing the changes in U.S. corn yields over time. The equation associated with the trend line that begins in the 1950s can be used to predict U.S. corn yield for the current cropping year under “normal” growing conditions. Year-to-year departures (changes) from the trend line are caused primarily by year-to-year variability in growing conditions. However, significant changes in the trend line itself (i.e., the slope of the line) are usually caused by significant changes in the adoption of farming technologies (e.g, hybrids, pest control, soil management, mechanization, precision ag. technologies). Irwin and Hubbs (2020) offer an interesting read on how these trend lines are affected by what year you choose to begin the estimation. In particular, one must be cautious when using short time periods because of the greater effect that unusual individual years (e.g., drought of 2012) can have on that estimation. My personal preference is to use the time period beginning with 1956, which accounts for 93% of the variability in corn grain yields between then and now (Fig. 1).
Reliance on corn yield trend lines to estimate future corn grain yields is inherently not precise. Annual corn yields fluctuate above and below their respective historical trend lines (Fig. 2), primarily in response to variability in growing conditions year to year (e.g., weather and pests). The “Great Drought” of 2012 certainly resulted in dramatic and historic reductions in corn grain yield relative to trend yield (-22%), but the greatest negative departure from trend yield actually occurred more than 100 years earlier during the “Great Drought” of 1901 (-30%). Conversely, the greatest single positive departure from trend yield occurred in 1906 when the corn crop that year yielded 23% higher than the expected trend yield. The magnitude and range of annual departures from trend yield since the mid-1950’s reinforce the evidence from Fig. 1 that the adoption of transgenic hybrid traits beginning in the mid-1990’s has not resulted in yields unusually higher than the long-term yield trend.
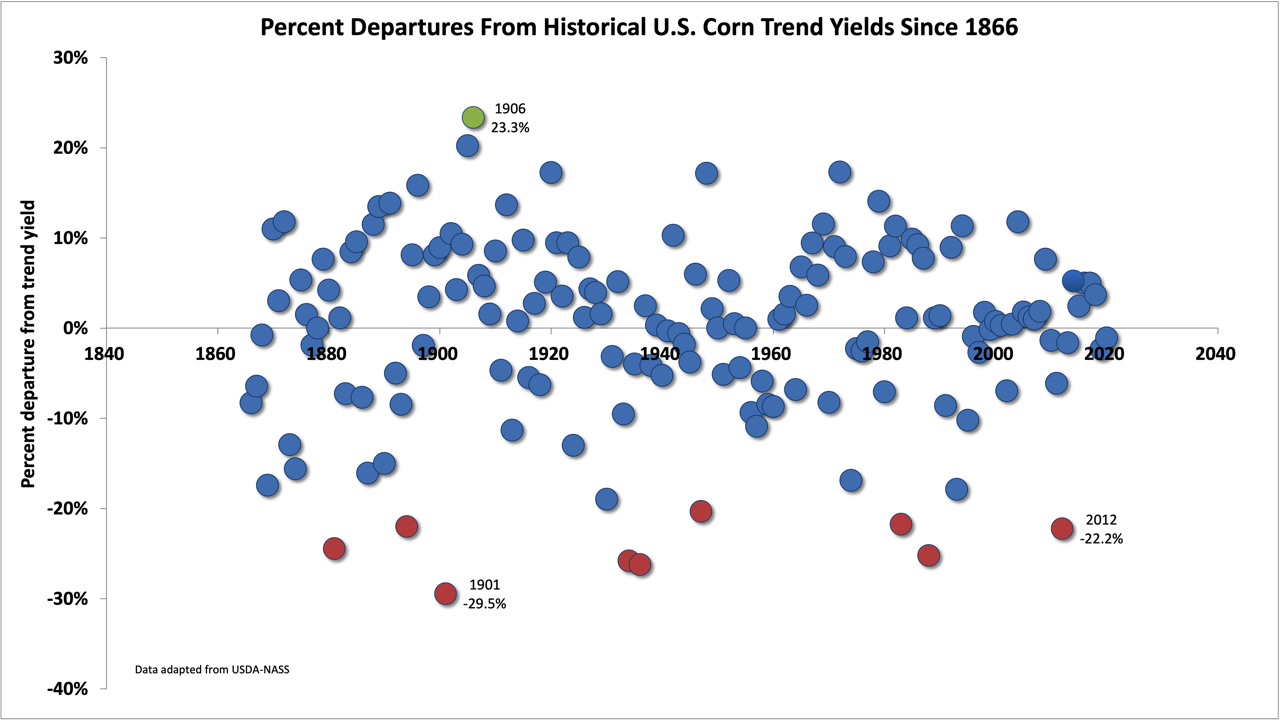
Fig. 2. Annual percent departures from estimated corn trend yields in the U.S. since 1866.
Data derived from annual USDA-NASS Crop Production Reports with respect to historical trend lines depicted in Fig. 1.
Bottom Line
The GOOD NEWS is that corn grain yields in the U.S. have steadily increased since the 1950’s at almost 2 bushels per acre per year. The SOBERING NEWS is that, in order to support the ever-burgeoning world population in the years to come, a third “miracle” that dramatically shifts the annual rate of corn yield improvement will be required.
Related Reading
Irwin, Scott and Darrel Good. 2012. The Historic Pattern of U.S Corn Yields, Any Implications for 2012? farmdoc daily (2):21, Department of Agricultural and Consumer Economics, University of Illinois at Urbana-Champaign. https://farmdocdaily.illinois.edu/2012/02/the-historic-pattern-of-us-cor-1.html [accessed Aug 2021].
Irwin, Scott and Todd Hubbs. 2020. How Sensitive Are Trend Yield Projections for U.S. Corn to the Starting Year of the Estimation Period? farmdoc daily (10): 107, Department of Agricultural and Consumer Economics, University of Illinois at Urbana-Champaign. https://farmdocdaily.illinois.edu/2020/06/how-sensitive-are-trend-yield-projections-for-us-corn-to-the-starting-year-of-the-estimation-period.html [accessed Aug 2021].
Kucharik, Christopher and Navin Ramankutty. 2005. Trends and Variability in U.S. Corn Yields Over the Twentieth Century. Earth Interactions (American Meteorological Society) 9:1-9. https://doi.org/10.1175/EI098.1 [accessed Aug 2021].
Kutka, Frank. 2011. Open-Pollinated vs. Hybrid Maize Cultivars. Sustainability 2011, 3, 1531-1554; doi:10.3390/su3091531. https://www.mdpi.com/2071-1050/3/9/1531/pdf [accessed Aug 2021].
Schill, Susanne Retka. 2007. ‘300-Bushel Corn is Coming’ Ethanol Producer Magazine. BBI International. http://www.ethanolproducer.com/articles/3330/300-bushel-corn-is-coming/ [accessed Aug 2021].
Schnitkey, Gary. 2019. The Geography of High Corn Yields. farmdoc daily (9):2, Department of Agricultural and Consumer Economics, University of Illinois at Urbana-Champaign. https://farmdocdaily.illinois.edu/2019/01/the-geography-of-high-corn-yields.html [accessed Aug 2021].
Schnitkey, G., C. Zulauf, K. Swanson and N. Paulson. 2021. Recent State Soybean and Corn Yields in Illinois. farmdoc daily (11):68, Department of Agricultural and Consumer Economics, University of Illinois at Urbana-Champaign. https://farmdocdaily.illinois.edu/2021/04/recent-state-soybean-and-corn-yields-in-illinois.html [accessed Aug 2021].
USDA-NASS. 2021. Quick Stats. United States Dept. of Agr – Nat’l Ag. Statistics Service, Washington, D.C. URL: https://quickstats.nass.usda.gov [accessed Aug 2021].
Ward, Robert De C. 1901. Some Economic Aspects of the Heat and Drought of July, 1901, in the United States. Bull. Amer. Geog. Soc. 33(4):338-347. DOI: 10.2307/198424. https://www.jstor.org/stable/pdf/198424.pdf [accessed Aug 2021].
