

Growth and development of corn are strongly dependent on temperature. Corn develops faster when temperatures are warmer and more slowly when temperatures are cooler. For example, a string of warmer than normal days in late spring will encourage faster leaf development than normal. Another example is that a cooler than normal grain filling period will delay the calendar date of grain maturity. The phrases “string of warmer than normal days” and “cooler than normal grain filling period” can be converted mathematically into measures of thermal time by calculating the daily accumulations of heat using temperature data. Commonly used terms for thermal time are Growing Degree Days (GDDs), Growing Degree Units (GDUs), or heat units (HUs).
Different methods exist for calculating heat units depending on a) the crop or biological organism of interest and b) the whim or personal preference of the researcher. The GDD estimation method most commonly used throughout the U.S. for determining heat unit accumulation relative to corn phenology was first evaluated by Gilmore & Rogers (1958) and termed “Effective Degrees”. Barger (1969) later proposed that the same method, which he termed “Modified Growing Degree Days”, be adopted as the standard heat unit formula by the National Oceanic and Atmospheric Administration.
This Modified GDD method calculates daily accumulation of GDD as the average daily temperature (oF) minus 50. The “modification” refers to the limits imposed on the daily maximum and minimum temperatures allowed in the calculation. Daily maximums greater than 86oF are set equal to 86 in the calculation of the daily average temperature. Similarly, daily minimums less than 50oF are set equal to 50 in the calculation.
Example 1:
If the daily maximum temperature was 80oF and the minimum was 55oF, the GDD accumulation for the day would be ((80 + 55) / 2) – 50 or 17.5 GDDs.
Example 2 (Illustrating the limit on daily maximums):
If the daily maximum temperature was 90oF and the minimum was 72oF, the GDD accumulation for the day would be ((86 + 72) / 2) – 50 or 29 GDDs.
Example 3 (Illustrating the limit on daily minimums):
If the daily maximum temperature was 68oF and the minimum was 41oF, the GDD accumulation for the day would be ((68 + 50) / 2) – 50 or 9 GDDs.
In late April to early May, normal daily GDD accumulations for central Indiana are about 10 GDDs. By late July, the normal daily accumulation rises to about 23 GDDs. For a typical corn growing season in central Indiana, say from late April to late September, the total seasonal accumulation of GDDs is about 2800 GDDs.
NOTE: Calculation of GDD for corn is not limited to the use of air temperatures. From planting until roughly V6, germination and development of young seedlings respond more directly to soil temperature than air temperature. Soil temperature does not precisely mirror air temperature. Consequently, it is appropriate during that time frame to calculate GDD using soil temperatures. Ideally, one would use soil temperature recorded in the upper two inches of soil because that depth corresponds best to seed placement and initial growing point position. Realistically, however, most available online sources of soil temperature data are based on standard NWS-NOAA 4-inch soil depth measurements. That’s okay, though, because corn development still correlates well with soil GDD based on 4-inch temperatures.
There are a number of sources of daily temperature data, both air and soil. There are increasingly more commercial sources of weather and climate data available to everyday consumers. One source of weather and climate data for those with Indiana interests is the Indiana State Climate Office, located on the campus of Purdue University. A range of types of data are available for a number of locations around the state (https://ag.purdue.edu/indiana-state-climate/data).
Specifically for corn, the Useful to Usable (U2U) multi-state research and Extension project, originally funded by USDA, developed a useful GDD decision support tool (HPRCC, 2020) that estimates county-level GDD accumulations (based only on air temperatures) and corn development dates for the states of North Dakota, South Dakota, Nebraska, Kansas, Minnesota, Iowa, Missouri, Wisconsin, Illinois, Michigan, Indiana, Ohio, Kentucky, and Tennessee. The GDD Tool uses current and historical GDD data plus user selected start dates, relative hybrid maturity ratings, and freeze temperature threshold values. The GDD and corn development predictions are displayed graphically and in tabular form, plus the GDD accumulation estimates can be downloaded in a Comma Separated Value (.csv) format for you to work with in your own spreadsheet program.
Figure 1 shows a screen capture from the GDD Tool in which I selected “Tippecanoe Co., IN”, a start date (aka planting date) of Apr 20, a relative hybrid maturity rating of 111 “days”, and a freeze temperature threshold of 28oF. The tool automatically adds estimated GDD values from planting to silking and black layer based on the “corn maturity days” you enter, but each is customizable if you know the GDD values specific to your hybrid. The tool displays estimates of actual cumulative GDD from planting to today’s date, then estimates of cumulative GDD for the remainder of the season. Estimates of silking and black layer dates are displayed, as well as the early and late ranges of those estimates. When you are viewing the actual graph on the Web site, estimates of GDD accumulations at specific dates “pop up” when you hover your computer mouse over parts of the line graph.
- For more information on how to use GDD to make hybrid maturity decisions, see my accompanying article (Nielsen, 2019b)
- For information on how to predict corn leaf stage development using GDD, see my accompanying article (Nielsen, 2019c).
Related References
Barger, G.L. 1969. Total Growing Degree Days. Weekly Weather & Crop Bulletin 56:18. U.S. Dept. of Commerce and USDA, Washington, D.C.
Brown, D.M. and A. Bootsma. 1993. Crop Heat Units for Corn and Other Warm Season Crops in Ontario. Ontario Ministry of Ag., Food, and Rural Affairs Factsheet #93-119.
Gilmore, E.C. and J.S. Rogers. 1958. Heat units as a method of measuring maturity in corn. Agron. J. 50:611-615.
HPRCC. 2020. U2U Decision Support Tools – Corn GDD. High Plains Regional Climate Center, Univ. Nebraska, Lincoln, NE. https://hprcc.unl.edu/gdd.php [URL accessed Apr 2020].
Nielsen, RL (Bob). 2019a. Determining Corn Leaf Stages. Corny News Network, Purdue Univ. http://www.kingcorn.org/news/timeless/VStageMethods.html. [URL accessed Apr 2020].
Nielsen, RL (Bob). 2019b. Hybrid Maturity Decisions for for Delayed Planting. Corny News Network, Purdue Univ. http://www.kingcorn.org/news/timeless/HybridMaturityDelayedPlant.html. [URL accessed Apr 2020].
Nielsen, RL (Bob). 2019c. Use Thermal Time to Predict Leaf Stage Development in Corn. Corny News Network, Purdue Univ. http://www.kingcorn.org/news/timeless/VStagePrediction.html. [URL accessed Apr 2020].
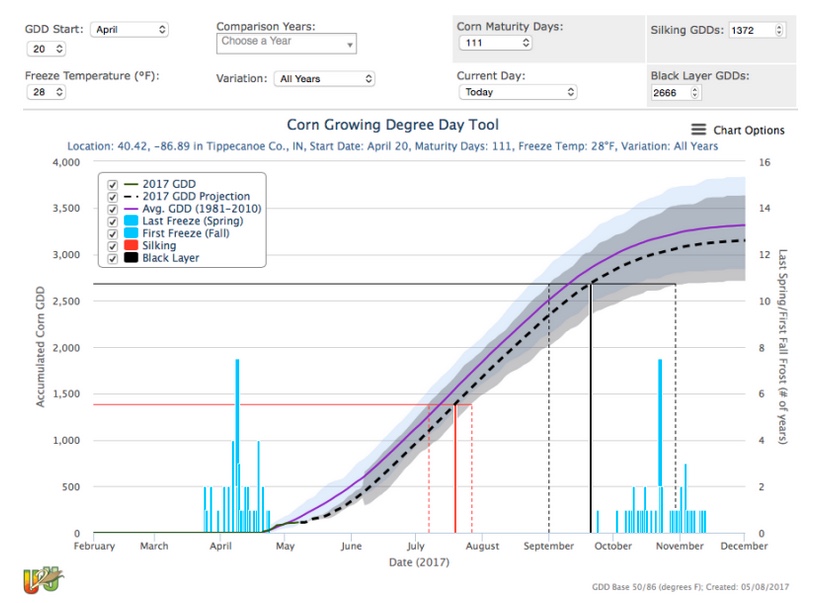
Fig. 1. Screen capture of U2U GDD Tool graphical display of historical and estimated future GDD accumulations and predicted corn development stages for a 111-day hybrid planted Apr 20 in Tippecanoe County, IN.
