

- Historical yield trends offer a glimpse into the future.
- Yield trend lines are simple to calculate.
- Be aware that trend lines based on short-term data can be misleading.
Historical trends in grain yield are of interest to a wide range of folks involved with row crop agriculture, from farmers to global grain marketing specialists. Personally, I have always been mesmerized by the historical changes in national corn grain yield that USDA first began to publish in 1866 (Nielsen, 2023).
Changes in grain yield over time tend to be linear in nature, with the occasional change in the slope or rate of linear increase in response to changes in genetics or other agricultural technologies. Consequently, “trend lines” tend to be calculated using simple linear regression methodologies with widely available spreadsheet software like Microsoft Excel.
For example, the linear trend for corn grain yield improvement in the U.S. since 1956 has been 1.9 bu/ac/yr (Fig. 1). That trend line calculation accounts for 93% of the historical year-to-year variability in grain yields. In other words, that trend line is a very good “fit” to the data.
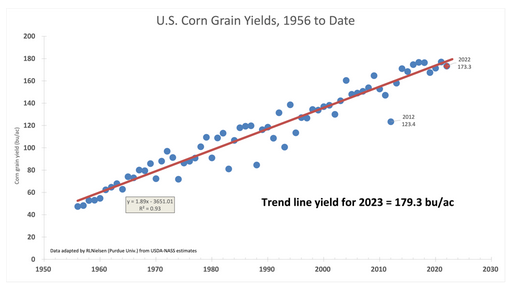
Fig. 1. U.S. Corn Grain Yields, 1956 to 2022.
As with any use of statistics, there are certain precautions one should take to minimize the risk of drawing incorrect conclusions. One such precaution relative to grain yield trends is understanding the impact of the length of the time period used in estimating the yield trend line. Irwin and Hubbs (2020) addressed this issue from a somewhat different perspective. I want to illustrate the need for precautions using a few simple examples.
The year I graduated from high school was the end of a 10-year run of impressive improvements in national corn grain yields, with the exception of the 1970 southern corn leaf blight epidemic. The linear yield trend calculated for that 10-year time period was a pretty good “fit” to the data (R2 = 0.72) and indicated that grain yield had increased at a rate of 2.9 bu/ac/yr (Fig. 2). There were undoubtedly agricultural “experts” at the time who confidently proclaimed that the third “miracle” of corn yield improvement had occurred and that by the year 2023 the average U.S. national corn grain yield would be close to 237 bu/ac. (See my earlier article that references the previous historical “miracles” of corn yield improvement.)
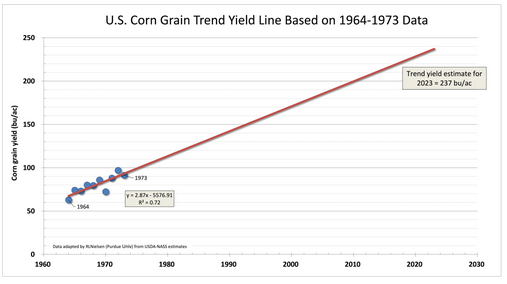
Fig. 2. U.S. Corn Grain Yield Trend Line. Based on 1964-1973 Yield Data.
Similarly, the advent of hybrid corn with transgenic traits (so-called GMO or biotech hybrids) in the mid-1990s was loudly hailed as the precursor of the third “miracle” of corn yield improvement (e.g., Schill, 2007). Such proclamations were based, in part, on simple trust in the power of biotechnology. Others pointed to the 10-year trend line beginning in 1996 that seemingly showed the historical trend in corn yield improvement (beginning in the mid-1950s) of 1.9 bu/ac/yr had “miraculously” increased to 2.7 bu/ac/yr (Fig. 3). That apparent increase in the linear rate of corn yield improvement predicted an average national corn grain yield of 200 bu/ac by 2023.
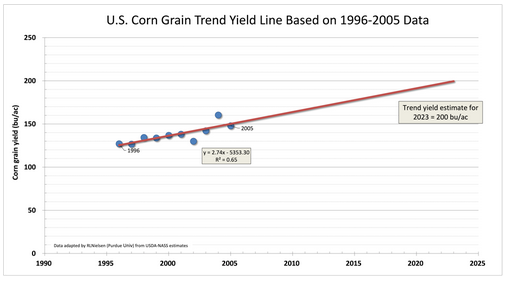
Fig. 3. U.S. Corn Grain Yield Trend Line. Based on 1996-2005 Yield Data.
Well, of course, neither short-term estimate of the trend in corn yield improvement has proven correct. The yield trend calculated from the past 67 years (since the beginning of the second “miracle” of corn yield improvement) still describes the rate of corn yield improvement very well (R2 = 0.93). Interestingly, if one considers the 27-year period since the advent of hybrids with transgenic traits in the mid-1990s, the yield trend based on those data is also 1.9 bu/ac/yr (Fig. 4). I interpret that as being further evidence that the transgenic traits currently available to corn growers in the U.S. have not had any measurable effect on the annual rate of corn yield improvement.
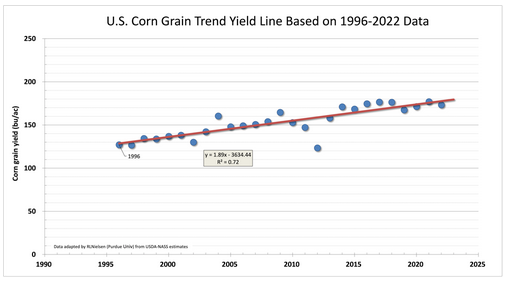
Fig. 4. U.S. Corn Grain Yield Trend Line. Based on 1996-2022 Yield Data.
Thus, the third “miracle” of corn yield improvement continues to be “just over the horizon”. That’s my opinion and you are entitled to it.
References and related reading
Nielsen, RL (Bob). 2023. “Historical Corn Grain Yields in the U.S.” Corny News Network, Agronomy Dept, Purdue Univ. https://www.agry.purdue.edu/ext/corn/news/timeless/YieldTrends.html [URL accessed Feb 2023].
Irwin, Scott and Todd Hubbs. 2020. “How Sensitive Are Trend Yield Projections for U.S. Corn to the Starting Year of the Estimation Period?”” farmdoc daily (10): 107, Department of Agricultural and Consumer Economics, University of Illinois at Urbana-Champaign. https://farmdocdaily.illinois.edu/2020/06/how-sensitive-are-trend-yield-projections-for-us-corn-to-the-starting-year-of-the-estimation-period.html [accessed Feb 2023].
Schill, Susanne Retka. 2007. “300-Bushel Corn is Coming.” Ethanol Producer Magazine. BBI International. http://www.ethanolproducer.com/articles/3330/300-bushel-corn-is-coming/ [accessed Feb 2023].
