

While we often focus on the importance of yield monitor calibration relative to logging accurate yield estimates during grain harvest, there are other yield monitor settings that can inadvertently influence yield estimates. One of these is the option in certain displays to automatically adjust harvest header or swath width based on the harvested “coverage map” and the estimated current geo-position of the combine in the field. Header or swath width, of course, is used by the yield monitor to estimate the harvested area and the calculation of yield per acre for individual data points. Not surprisingly, accurate header widths are important to ensure accurate yield estimates by the yield monitor.
When set to automatically adjust header width, the yield monitor will automatically decrease the logged header width if it perceives that one or more rows of the combine head are overlapping a previously harvested area. When the estimated geo-position of the combine is accurate (e.g., when the GPS signal source is RTK), this automatic header width adjustment is great when harvesting point rows or field edges in corn or when harvesting soybeans in general. However, when the estimated geo-position of the combine is not accurate, the yield monitor may erroneously change header widths in the middle of the field where, in fact, the combine is NOT overlapping a harvested area. This is most likely to occur when the combine is using DGPS signals from WAAS or similar signal sources whose positional accuracies range from 5 to 15 feet horizontally.
The consequence on yield estimates from inadvertent and erroneous changes in the logged header widths can be quite significant. Figure 1 illustrates a small section of a field where the yield monitor erroneously decreased the header width value from the full 20 feet (eight 30-inch rows of corn) to 17.5 feet (seven 30-inch rows) for a short distance.
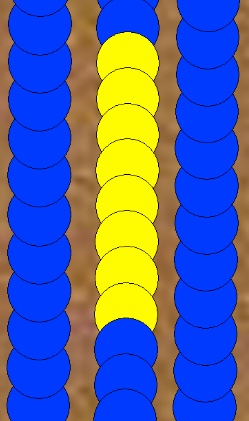
Fig. 1. Closeup view of yield data points depicting full (20ft) header widths (blue) and incorrect partial 17.5ft header widths (yellow).
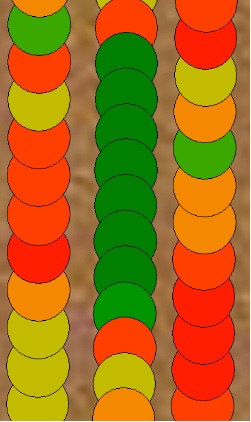
Fig. 2. Closeup view of same yield data points as Fig 1, depicting estimated yields. Average yield for the 17.5ft header width points was 263 bu/ac while the average yield for the surrounding normal 20ft header widths was 223 bu/ac.
The incorrect reduction in header width for those data points caused the yield monitor to overestimate yield per acre for the affected data points because the estimated harvested area for those points was erroneously smaller. Figure 2 illustrates the estimated yields for the same individual data points shown in Fig. 1. The average estimated yield for the 8 data points with incorrect header width values was 263 bu/ac. The average estimated yield for the surrounding data points with the correct 20ft header width values was 223 bu/ac. The data points were logged every second at an average speed of 5.7 mph and so are approximately 8 feet apart, meaning that there is approximately 64 feet of incorrect header width values and, subsequently, incorrect yield data.
Clearly, the impact of such random and incorrect automatic header width changes on yield estimates can be significant depending on the percentage of the field affected. Recognize that such yield estimate errors are far larger than those resulting from simpler calibration issues and, thus, deserve your attention if your goal is to end up with an accurate yield map.
So, how can you tell whether your yield data is afflicted with Wandering Swath Width Syndrome (WSWS)?
- If you use auto-steer on your combine, I suppose you could keep your eyes glued to the display monitor and watch the header width values as you harvest the field :-).
- Some, but not all, mapping software programs allow you to map the logged data by their header / swath width values. That allows you to visualize the header width changes throughout the field as illustrated in Fig. 1.
- Unfortunately, this diagnostic occurs after the “cows have broken through the fence” and only points you in the right direction for future harvesting.
So, what can be done to prevent or minimize the occurrence of WSWS?
- Equip your combine with more precise DGPS signal sources, such as RTK, so that the combine’s estimated geo-position is more precise (within inches) and, thus, the estimated harvest coverage map will be more precise.
- Turn off the automatic header width setting in the yield monitor display and manually change header widths when harvesting point rows or other partial header widths.
So, what can be done once the problem has occurred and you are stuck with a bunch of yield files containing incorrect header widths and consequently incorrect yield estimates?
- Some yield data processing software allows you to “re-process” yield data during or after it has been imported by the software. Often there will be an option to force the use of a single header / swath width when processing the data. Selecting this would override the logged header / swath widths in the data file and result in correct yield estimates.
- However, be aware that this processing option means that yield estimates will not be accurate for point rows or anywhere else in the field where the number of rows harvested actually did decrease.
- If the software you use to process yield files does not allow you to force a single manual header / swath width during the yield processing step, then you are basically stuck with the yield estimation errors.
- Unless…. you are savvy enough to save / export the yield data to a “shape” file, and then…
- Edit the “shape” file to add a new “yield” variable and recalculate yields yourself using the logged values for grain flow, logging interval, grain moisture, distance traveled, and your single value for header / swath width (see formula in Luck & Fulton, 2014).
- Such editing of a yield data file is doable with open-source GIS programs like QGIS, but not with many of the other “off-the-shelf” mapping programs.
Related reading
Luck, Joe and John Fulton. 2014. Best Management Practices for Collecting Accurate Yield Data and Avoiding Errors During Harvest. Univ. of Nebraska Extension publication EC2004. https://extensionpublications.unl.edu/assets/pdf/ec2004.pdf [URL accessed Oct 2020].
Nielsen, R.L. (Bob) Nielsen. 2020a. Identify and Eliminate “Gremlins” From Yield Monitor Data. Corny News Network, Purdue Extension. http://www.kingcorn.org/news/timeless/CleaningYieldData.html [URL accessed Oct 2020].
Nielsen, R.L. (Bob). 2020b. Wandering Hybrid Syndrome: Yield Monitor Errors. Corny News Network, Purdue Extension. http://www.kingcorn.org/news/timeless/AutoHybridErrors.html [URL accessed Oct 2020].
Nielsen, R.L. (Bob). 2020c. Yield Monitor Calibration: Garbage In, Garbage Out. Corny News Network, Purdue Extension. http://www.kingcorn.org/news/timeless/YldMonCalibr.html [URL accessed Oct 2020].
