

Questions about tar spot management were already beginning to surface as corn planting nears completion across Indiana. With today’s confirmation of the first positive tar spot sample from Randolph County (Figure 1), I expect those conversations to become even more frequent in the coming weeks.
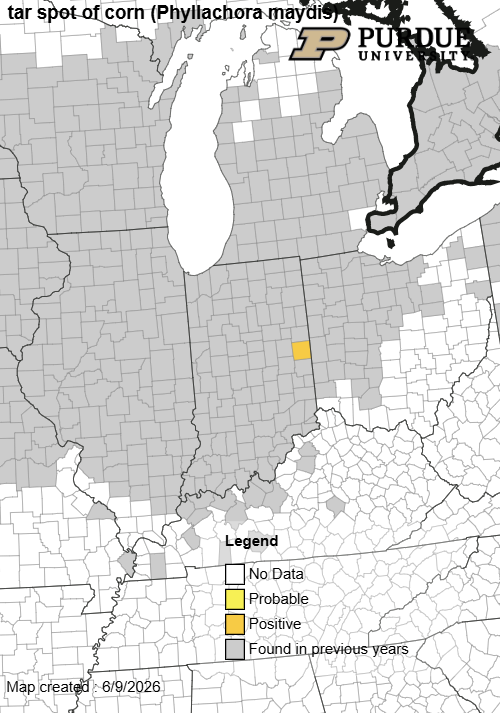
Figure 1. Tar spot map updated June 9, 2026. Confirmed active tar spot in lower canopy of V6 corn planted mid-April in Randolph County, Indiana.
Drawing from eight seasons of tar spot observations, research, and field experience, here are my to 10 tips and several decision-support tools to help effectively monitor risk and make informed disease management decisions
My Top 10 Tips to Stay Ahead of Tar Spot:
- Every season is different. Tar spot development is driven by the disease triangle—susceptible host, pathogen presence, and favorable environmental conditions. Weather patterns through June are especially important and often determine when disease becomes established in the lower canopy.
- Scout early and scout often. Begin monitoring fields when corn reaches V7–V8, focusing on the lower canopy for the first tar spot stromata (Figure 2). To distinguish tar spot from insect frass (false tar spot), try rubbing the spot and inspect the underside of the leaf for a corresponding lesion directly beneath the upper-canopy spot (Figure 3). Early detection is critical. Once disease severity reaches 5% or greater in the upper canopy, fungicides are unlikely to effectively slow disease progression (Figure 4). Follow disease monitoring maps to track first detections in your area.
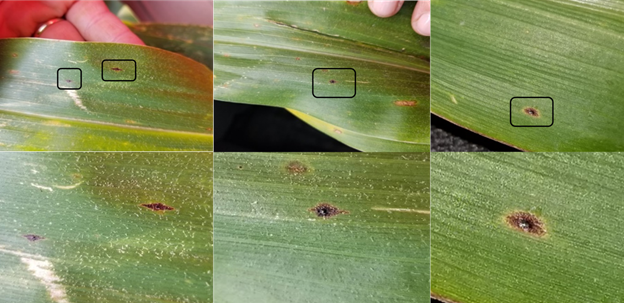
Figure 2. Examples of small tar spot stromata (black raised bumps) on corn leaves in black boxes and a closer view of them in each of the lower photos .(Photo Credit: Darcy Telenko, Purdue University)
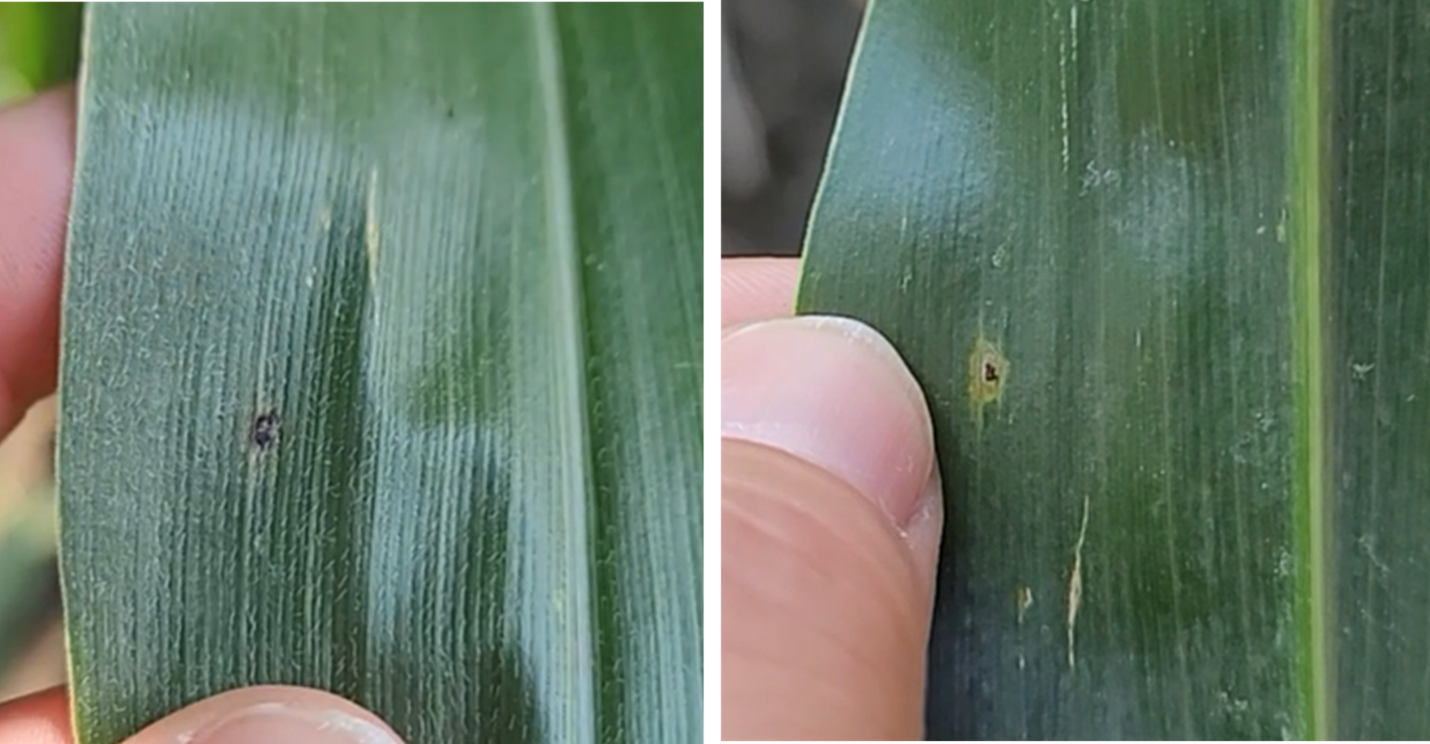
Figure 3. An example of a tar spot lesion with the stromata (fungal structure) forming on both the adaxial (upper) and abaxial (lower) leaf surface. (Photo Credit: Darcy Telenko, Purdue University)
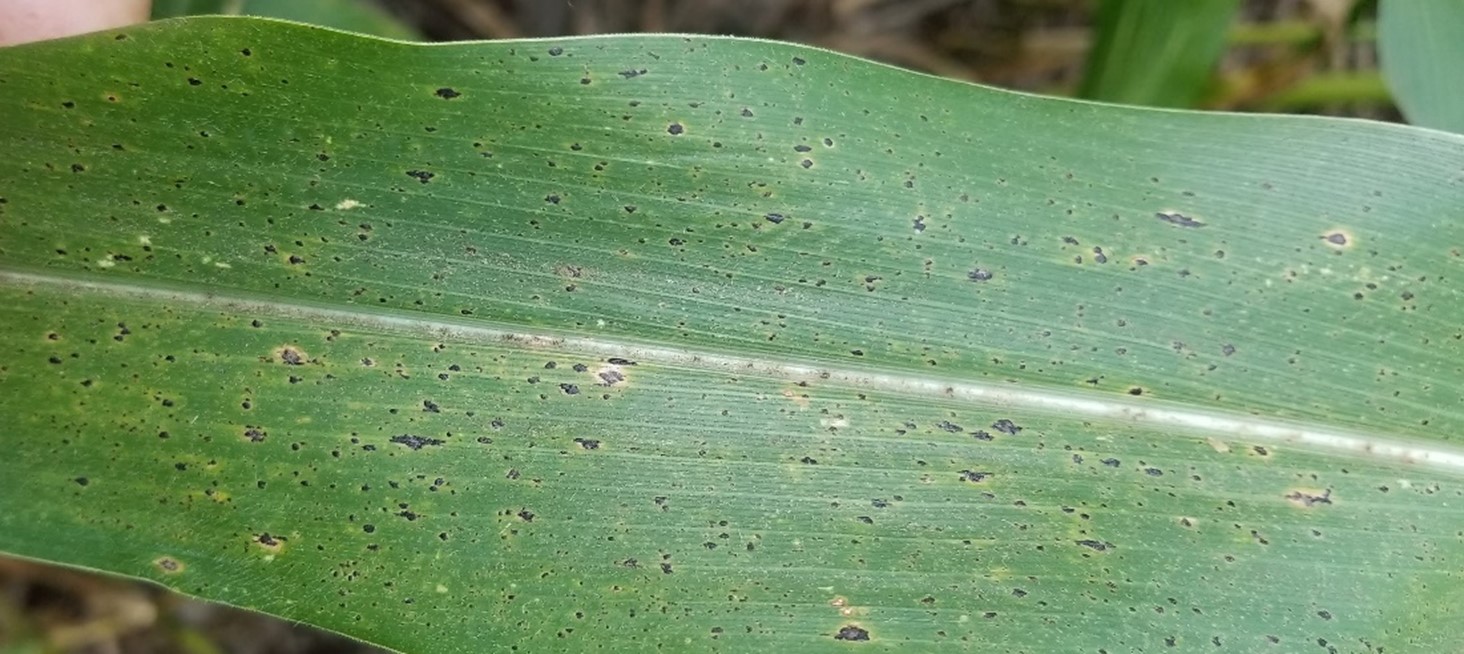
Figure 4. leaf with more than 5% tar spot stromata severity. (Photo source Darcy Telenko, Purdue University)
- Host resistance provides an important advantage. Selecting hybrids with moderate resistance can significantly reduce disease development and slow epidemic progression within the canopy, improving overall disease management.
- Fungicides remain an effective tool, but they have limitations. Tar spot can challenge fungicide residual activity and canopy coverage, particularly during prolonged periods of disease pressure. Consult the latest fungicide efficacy ratings or fungicide efficacy tools when selecting products.
- Application timing is critical. Fungicide applications can be made too early or too late. Based on Indiana research, the optimal window for a single fungicide application is generally between tasseling (VT) and milk (R3) stages to maximize disease suppression and yield protection.
- Consider return on investment (ROI). Evaluate the economics of one versus two fungicide applications. An application triggered early in the season may require a second treatment to maintain protection through grain fill and ensure adequate late-season coverage.
- Expect some disease at season’s end. Even well-managed fields will likely have some tar spot present by maturity. Complete disease elimination is not a realistic expectation, particularly given limitations in fungicide residual activity and canopy penetration.
- Practice fungicide stewardship. Use fungicides judiciously and strategically when disease risk and crop growth stage indicate the greatest potential for disease management and yield preservation. Responsible use helps preserve fungicide efficacy for the future.
- Leverage available decision-support tools. Utilize disease monitoring maps, forecasting tools, fungicide efficacy resources, and local Extension updates to guide scouting efforts and management decisions throughout the season.
- Continue asking questions and sharing observations. Grower experiences, field observations, and emerging challenges help identify knowledge gaps and drive future research priorities, improving tar spot management recommendations for everyone.
Tar Spot Monitoring Tools to Support Informed Disease Management Decisions in Corn
- Tar spot map: https://cropprotectionnetwork.org/maps/tar-spot-of-corn this page also has a handy table on our recommendations when to spray when tar spot is detected.
- Tar spotter and forecasting tools: https://cropprotectionnetwork.org/crop-disease-forecasting This is a great new tool to see if environmental conditions have been favorable for tar spot.
- Fungicide efficacy tables on Crop Protection Network https://cropprotectionnetwork.org/publications/fungicide-efficacy-for-control-of-corn-diseases There’s also a new tool to help sort products https://cropprotectionnetwork.org/fungicide-efficacy-tool
- The Crop Protection Network has many articles, publications, maps, tools, and more to help with decisions related to protecting field crops https://cropprotectionnetwork.org/
- The Indiana Field Crop Pathology website will have in-season updates https://indianafieldcroppathology.com/
In addition, for Indiana growers – with support from check off funding through the Indiana Corn Marketing Council – I will cover any corn disease samples submitted to our Purdue Plant Pest Diagnostic Lab (PPDL) to help us track both tar spot and other diseases this season https://ag.purdue.edu/department/btny/ppdl/
Please feel free to contact me with any of your Indiana field crop disease questions dtelenko@purdue.edu
Logos for Indiana Soybean Alliance and Indiana Corn Marketing Council
