
- Effects of Flooding or Ponding on Young Corn
- Thoughts on Late Planting of Soybean
- Assessing Available Nitrogen from Fall- and Spring- Applied Nitrogen Applications
Cutworms Chewing Through Technology – (Christian Krupke and John Obermeyer)
• Cutworms are abundant, especially where weeds were plentiful before planting.
• As predicted, seed insecticides and/or Bt corn are NOT controlling severe infestations.
Numerous reports have been received of emerging corn being damaged by cutworms. As mentioned in previous Pest&Crop issues (#4, 5, 6, 8 <http://extension.entm.purdue.edu/pestcrop/2011/index.html>), the seed-applied insecticides and/or Bt traited corn will only provide suppression of cutworms. With the severe damage some fields are reportedly receiving, it is obvious that producers were negligent in scouting fields after emergence to determine the need for rescue foliar insecticides.
Black cutworm is not the only species of cutworm present and damaging fields. Many reports of claybacked cutworm have been received as well. This species overwinters as a partially grown larva, so it is larger when the corn is emerging, compared with black cutworms, which begin their annual Indiana cycle as eggs in the spring. What’s important is that larger larvae, ≥ 0.5 inch, are not controlled by Bt proteins expressed in Herculex and SmartStax. Producers are unhappily finding out that black cutworm is the only species labeled for control with these traited-seeds, and rescue treatments are on their tab. As we’ve learned in the past and hearing again this spring, the seed-applied insecticides (e.g., Cruiser, Poncho) provide only suppression of cutworms. They likely do a fine job of suppressing light to moderate infestations, but severe infestations are NOT controlled, even by the higher rate.
Control may be needed if 3-5% of the seedlings have obvious foliar feeding and/or plant cutting and live larvae can be found while digging around damaged plants. Higher label rates of insecticides should be considered if the soil surface is crusty and most cutworm activity is below ground. For a listing of foliar insecticides for rescue control, refer to “Corn Insect Control Recommendations – 2011,” which can be viewed by clicking <http://extension.entm.purdue.edu/publications/E-219.pdf>.
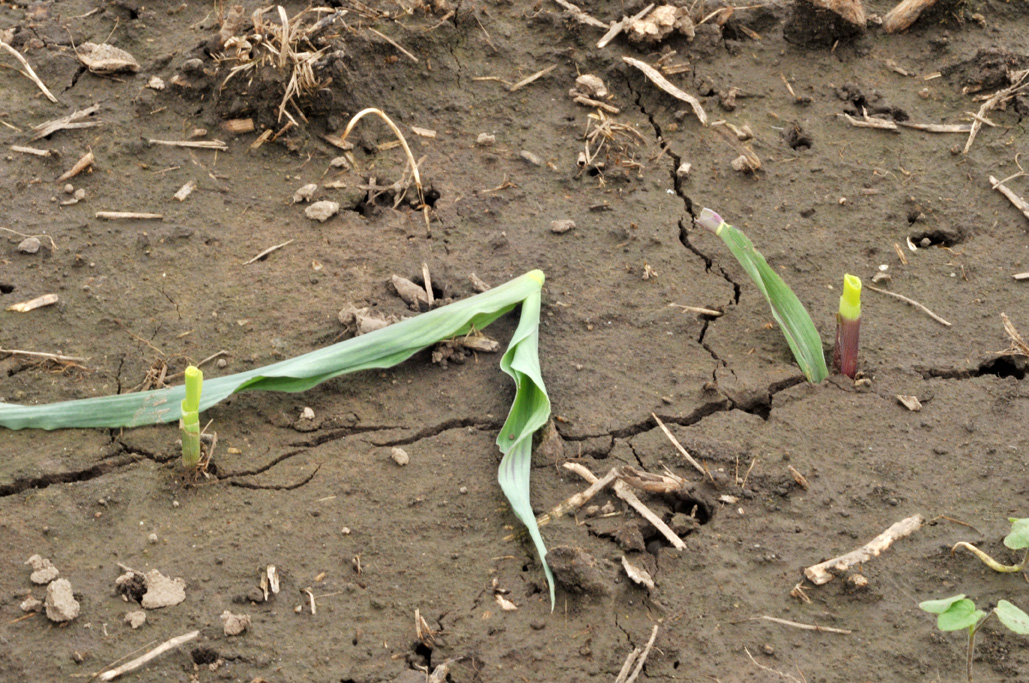
Cut plants and pulled under leaves by BCW larvae
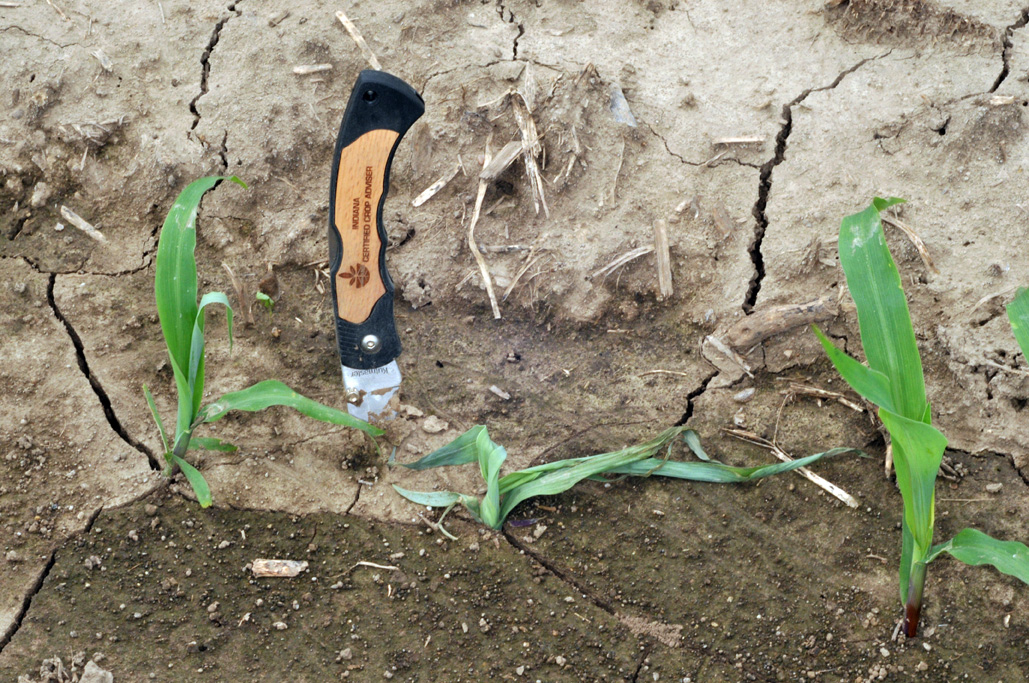
Two wilting plants from underground BCW feeding

BCW larva next to cut plant
![]()
Click here to see the Black Light Trap Catch Report
![]()
Cover Crops and the Corn and Soybean Herbicide Rotation Restrictions – (Bill Johnson and Glenn Nice)
There has been an increased interest in the use of cover crops. The benefits of using cover crops are well reported. The Midwest Cover Crops Council lists them as reducing soil erosion and increase nutrient recycling on farmlands [Midwest Cover Crop Council]. They also state that some of the other benefits are improving soil quality, fertility management, landscape diversification, and wildlife habitat. However, there are some challenges to growing a cover crop in fields where corn and soybean are grown.
One of the challenges of cover crops that if they don’t winter kill and they have to be chemically or mechanically controlled in the spring before planting corn or soybean. In some cases they are controlled well enough with a typical burndown herbicide program that would be used to control a winter annual weeds. Occasionally due to cool wet environmental conditions, late application timing, or contamination of seed the burndown does not get completely control the cover crop in the spring.
One question that has been brought up in recent cover crop situations is replant timing when cover crops are planted after the use of residual herbicides used in corn or soybean. There are several plant species being promoted for the use of cover crops. Some of the plants include annual ryegrass, wheat, buckwheat, clovers, radish, cowpea and vetch. Information regarding effects or corn and soybean herbicides on these species is somewhat lacking. Herbicide label rotation restrictions often require substantial waiting periods before the cover crop can be planted. These waiting periods are to assure that residual effects from the herbicide do not impact the following crop negatively. In many cases rotational work has been done to attain these waiting period durations. However, in some cases plants used as cover crops fall under the ‘other’ or ‘not listed’ category requiring the maximum duration before planting. This is often not based on actual work to ascertain this information, but because the work has not been done and it is always better to be safe than sorry and the labels are written to protect the user from damaging the cover crop.
In recent communications with the Office of the Indiana State Chemist the question was brought up. The interpretation of the label is, if the cover crop is not harvested, used as feed for livestock or sold in anyway and that the cover crop is terminated in the appropriate manner, that the rotation restriction does not apply. However, because the company selling the herbicide does not recommend or approve a rotation other than the ones listed on the label, the company selling the herbicide is not liable for any injury or germination problems seen in the cover crop.
Purdue is presently working on a study that will look at some cover crop species response to some of the common corn and soybean herbicides. Look for a future article with that data.
The table on the next page lists several herbicides used in corn and soybean and their rotation restrictions to a few of the plants used as cover crops. Remember, failure to follow labels can lead to possible injury of desired plants.
| Examples of rotation restrictions of several corn and soybean herbicides and a few of the plants used as cover crops in months. See footnote for cover crops. | |||||||||
| Herbicide Crop | 1 | 2 | 3 | 4 | 5 | 6 | 7 | 8 | Comments |
| atrazine | NY | NY | NY | NY | NY | NY | NY | NY | If not applied after June 10, do not plant the following year. Taken from the Aatrex label. Injury may occur. |
| Authority First - Soybean sulfentrazone + cloransulam | 12 | 4 | 30 | 30 | 30 | 12 | 12 | 30 | Crops not lised are 30 months. |
| Autority MTZ - Soybean sulfentrazone + metribuzin | 18 | 4 | 18 | 18 | 18 | 18 | 18 | 18 | Crops not lised are 18 months. |
| Balance Flexx - Corn isoxiflutole | 12 | 4 | 30 | 30 | 30 | 12 | 12 | 30 | Crops not lised are 30 months. |
| Capreno - Corn thiencarbazone + tembotrione | 18 | 4 | 18 | 18 | 18 | 18 | 18 | 18 | Spring oats can be planted 10 months after application. Rotation restrictions of 18 months require 30 inches of precipation. |
| Callisto - Corn mesotrione | 18 | 4 | 18 | 18 | 18 | 18 | 18 | 18 | Crops not listed are 18 months. Grasses grown for seed can be planted immediately, but annual ryegrass is not directly addressed. |
| Canopy DF - Soybean chlorimuron + metribuzin | 18 | 4 | 18 | 18 | 18 | 18 | 18 | 18 | Barley can be planted 4 months after application. Crops not listed are 30 months. |
| Canopy EX - Soybean chlorimuron + tribenuron | 30 | 3 | 12 | 30 | 30 | 3 | 9 | 30 | Crops not listed are 30 months. |
| Dual II Magnum - Corn Soybean S-metolachlor | 4.5 | 4.5 | 9 | N/A | N/A | 4.5 | N/A | Spr | Clover may be seeded in 9 months. To avoid injury to clover, do not apply more than 1.9 lb. ai/A (2 pts./A). Do not make any post applications. |
| FirstRate - Soybean cloransulam | 18 | 4 | 18 | 18 | 18 | 9 | 9 | 18 | Barley can be planted in 12 months. Crops not listed are 18 months. |
| Flexstar - Soybean formesafen | 18 | 4 | 18 | 18 | 18 | 4 | 10 | 18 | Cereal rye can be planted in 4 months |
| Prefix - Soyben S-metolachlor + formesafen | 4.5 | 4.5 | 18 | 18 | 18 | 4.5 | 18 | 18 | Crops not listed are 18 months. |
| Valor XLT - Corn flumioxazin + chlorimuron | 4 | 4 | 18 | 40 | 30 | 30 | 30 | 30 | Crops not listed are 30 months. |
| 1 = Annual ryegrass; 2 = Wheat; 3 = Clover; 4 = Vetch; 5 = Radish; 6 = Oats; 7 = Cowpea; 8 = Buckwheat; NY = Next Year; Spr = Spring | |||||||||
![]()
Early Fungicide Applications in Corn – (Kiersten Wise)
Early fungicide applications are a new trend in field corn production, and are reported to increase yield even in the absence of significant disease or a disease threat. The timing of an early fungicide spray coincides with post-emergence herbicide applications, making them easier and possibly cheaper to apply than later fungicide applications that target the tasseling (VT) growth stage. However, there is not an extensive amount of replicated research that shows a consistent yield benefit from early fungicide applications to corn.
In 2010, we established several trials at the Agronomy Center for Research and Education (ACRE), and the Throckmorton Purdue Agricultural Center (TPAC) in Tippecanoe County, IN. We compared the yield benefits of early, late, and double applications of fungicides to non-treated controls (Figure 1). In these trials, we did not see an economic benefit from an early fungicide application.
It is important to remember that a V4-V6 application of fungicide to corn will not protect the ear leaf or above from disease that develops around tasseling. Producers may be concerned about foliar diseases like anthracnose leaf blight (caused by the fungus Colletotrichum graminicola), which can be present in young corn. Typically, symptoms of this disease are confined to lower leaves throughout the growing season, and do not typically require management. Producers who have fields of flooded or ponded corn may also be concerned about the disease crazy top, which is caused by the fungus Sclerophthora macrospora. This disease can deform tassels and leaf tissue (Figure 2), but symptoms may not be noticeable until later in the season. Although this disease can cause striking symptoms, it rarely causes significant yield losses, and foliar fungicides are not labeled for control of this disease. Producers thinking about applying foliar fungicides at early growth stages of corn to improve the health of stressed or damaged corn should consider that past research indicates that the most consistent yield advantage from a fungicide application occurs when fungicides are applied in response to a high risk of disease development at VT-R1. Hybrid susceptibility, previous crop, and weather conditions prior to tasseling strongly influence disease development, and these factors should be considered before deciding to apply a fungicide.

Figure 1. Figure 1. 2010 response of early fungicide applications in corn in Tippecanoe County, IN. Values were averaged across all fungicides tested at each application timing in each of three experiments conducted at this location. Disease severity in the untreated control did exceed 1% on the ear leaf (at R4) in any experiment. LSD (0.05) = NS
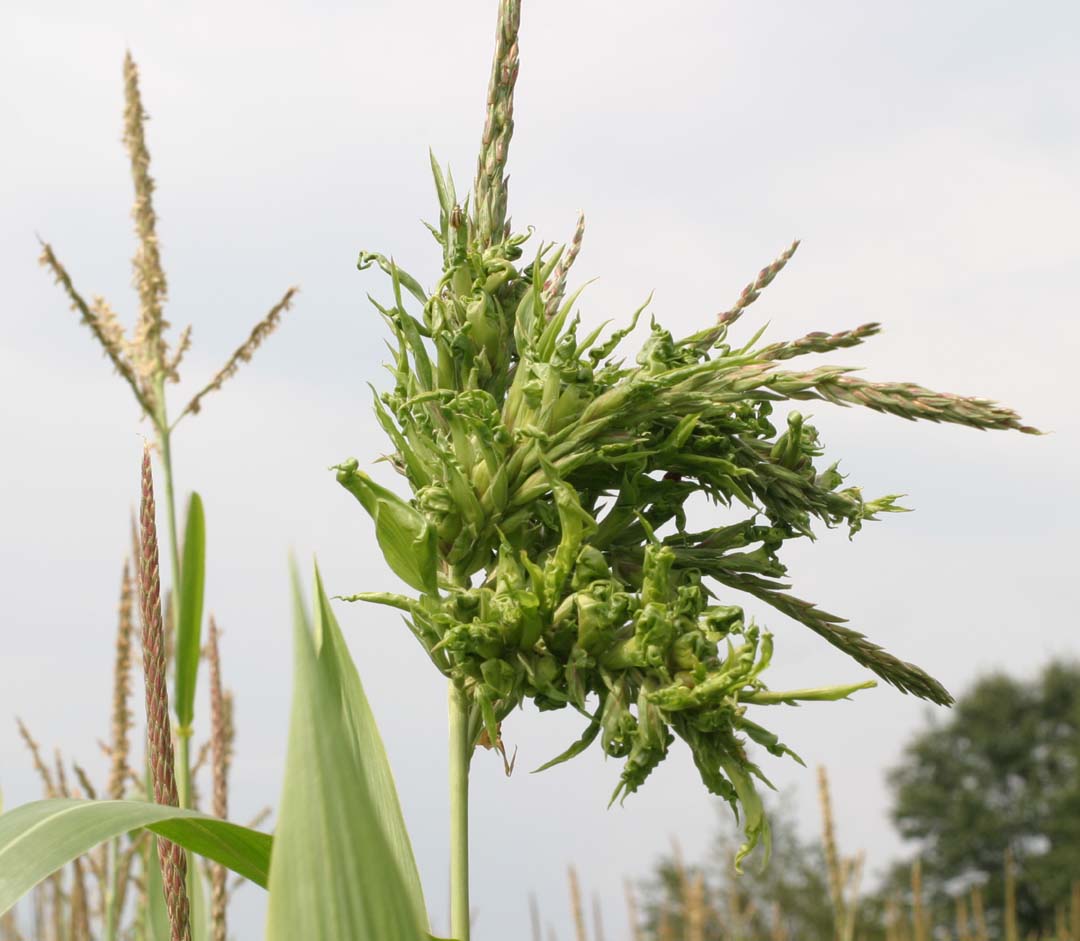
Figure 2. Deformed, proliferating tassels are a common symptom of crazy top in corn. The disease is rarely yield-limiting. (Picture courtesy G. Shaner)
![]()
Are Late-Planted Soybeans at Risk for Soybean Rust? (Kiersten Wise)
The 2011 planting season has not gone smoothly for many Indiana producers, with only 25% of the intended soybean acreage in the ground as of Friday (USDA NASS). This puts the Indiana soybean crop about 2-3 weeks behind the average development schedule, and there are questions about if this years soybean crop is at greater risk for soybean rust due to the late planting. June planted soybeans will be at a younger growth stage and possibly at risk for yield loss from soybean rust should spores of the fungus that causes soybean rust (Phakopsora pachyrhizi) reach Indiana in August or September. However, the likelihood that disease will establish and cause yield loss in Indiana in 2011 depends on many factors, including weather patterns and the level of disease that develops throughout the year in the southern U.S.
Soybean rust has been slow to develop in the U.S. in 2011 due to drought conditions in most southern states (Figure 1). This means that there is currently a low amount of diseased kudzu that can serve as source of spores for soybean infection and the northward movement of the disease. Weather conditions will dictate how quickly the disease progresses in southern states, and sentinel plots are established in these areas to monitor the movement of the disease. Indiana also has soybean plots that can be observed for soybean rust should the disease move north at a critical point in the growing season. Since soybean rust was first discovered in the U.S. in 2004, Indiana and much of the Midwest have been spared from soybean rust outbreaks that could result in yield loss due to the late northward movement and development of the disease. However, producers that are concerned about soybean rust have several options to stay informed of the risk of soybean rust in Indiana:
1. Soybean rust development can be tracked using the ipmPIPE web site
<http://www.sbrusa.net>
2. Indiana soybean producers can subscribe to the Indiana soybean disease update list serve, at
<https://lists.purdue.edu/mailman/listinfo/indiana-soybean-update>
3. Purdue University will continue to maintain a toll-free soybean disease hotline, which is updated weekly beginning in late June. The phone number is 866-458-RUST (7878).
4. Updated commentary on the risk of soybean rust and other soybean diseases will be released in the Pest and Crop newsletter as the season develops.
Figure 1. Current status of soybean rust in North America. (ipmPIPE website; <http://www.sbrusa.net>
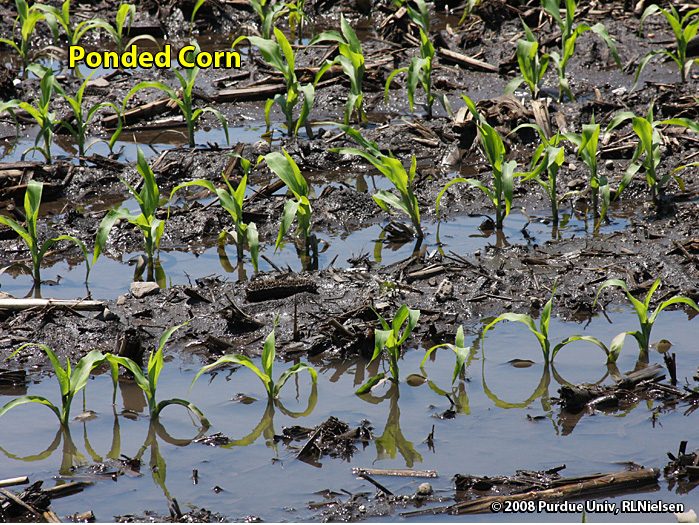
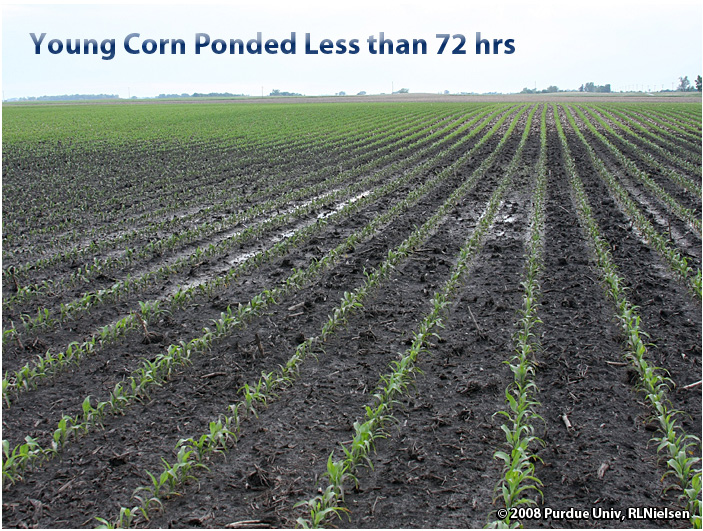
) Effects of Flooding or Ponding on Young Corn – (Bob Nielsen)
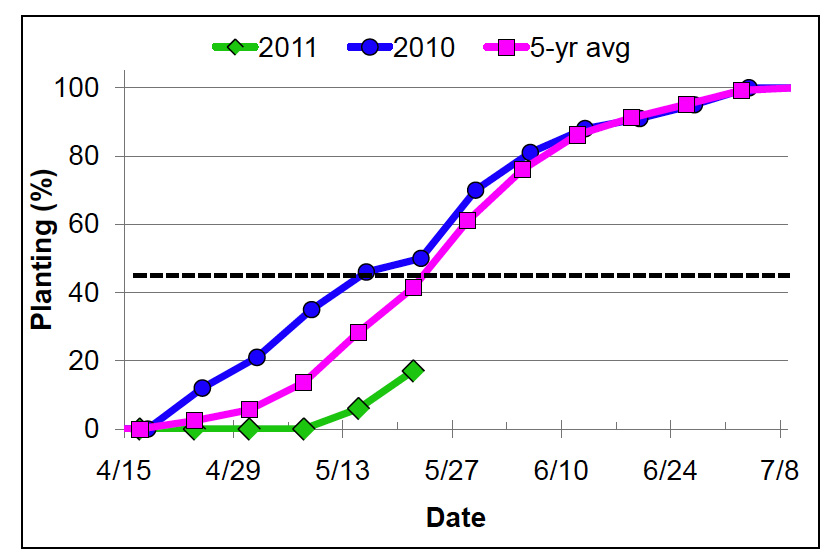
Recent intense rainfall events (technically referred to as “toad stranglers” or “goose drownders”) have caused flooding of low-lying corn fields or ponding in poorly drained swales within fields. Other areas within fields, while not technically flooded or ponded, may remain saturated for lengthy periods of time. What are the prospects for recently submerged corn fields? The sarcastic answer is that flooded crops will survive until they die. What I mean to say is that no one can tell you with certainty the day after the storm whether a ponded area of a corn field will survive or whether there will be long-term yield consequences until enough time has gone by such that you can assess the actual recovery of the damaged plants. We can, however, talk about the factors that increase or decrease the risks of severe damage or death to flooded soils. *Plants that are only partially submerged may continue to photosynthesize, albeit at limited rates. *Most agronomists believe that young corn can survive up to about 4 days of outright ponding if temperatures are relatively cool (mid-60’s F or cooler); fewer days if temperatures are warm (mid-70’s°F or warmer). *Soil oxygen is depleted within about 48 hours of soil saturation. Without oxygen, the plants cannot perform critical life sustaining functions; e.g. nutrient and water uptake is impaired and root growth is inhibited. *Ironically, such situations would benefit from another rainfall event to wash the mud deposits from the leaves. *This is partly because young plants are more easily submerged than older taller plants and partly because the corn plant’s growing point remains below ground until about V6. The health of the growing point can be assessed initially by splitting stalks and visually examining the lower portion of the stem (Nielsen, 2008a). Within 3 to 5 days after water drains from the ponded area, look for the appearance of fresh leaves from the whorls of the plants. *Significant loss of soil N will cause nitrogen deficiencies and possible additional yield loss. *On the other hand, if the corn dies in the ponded areas it probably does not matter how much nitrogen you’ve lost. *Poorly drained areas of fields are most at risk for the development of these diseases and so will also be risky for potential replant operations. *The fungus that causes crazy top depends on saturated soil conditions to infect corn seedlings. Ponded corn Ponded corn Young corn ponded less than 72 hours Related References Butzen, Steve. Flooding Impact on Crops. Pioneer Hi-Bred Int’l. [On-line]. Available at <http://www.pioneer.com/home/site/us/template.CONTENT/agronomy/crop-management/adverse-weather-disease/flood-damage/guid.DE1A9B1D-CAC0-4A04-B9CC-E0820B29080A> [URL accessed May 2011]. Elmore, Roger and Lori Abendroth. 2008. Flooded Corn and Saturated Soils. Integrated Crop Management Newsletter, Iowa State Univ Extension. [On-line]. Available at <http://www.extension.iastate.edu/CropNews/2008/0530RogerElmoreLori+Abendroth.htm> [URL accessed May 2011]. Farnham, Dale. 1999. Corn survival in wet conditions. Iowa State Univ. Integrated Crop Management Newsletter. [On-line] Available at <http://www.ent.iastate.edu/ipm/icm/1999/5-24-1999/wetcorn.html> [URL accessed May 2011]. Hager, Aaron. 2011. Replanting Corn: How to Control Plants from the Initial Planting. the Bulletin, Univ. of Illinois Extension. [On-line]. Available at <http://bulletin.ipm.illinois.edu/article.php?id=1480> [URL accessed May 2011]. Nielsen, RL (Bob). 2008a. Growing Points of Interest. Corny News Network, Purdue Univ. [On-Line]. Available at <http://www.kingcorn.org/news/timeless/GrowingPoints.html> [URL accessed May 2011]. Nielsen, RL (Bob). 2008b. Tips for Staging Corn with Severe Leaf Damage. Corny News Network, Purdue Univ. [On-Line]. Available at <http://www.kingcorn.org/news/timeless/VStagingTips.html> [URL accessed May 2011]. Nielsen, RL (Bob). 2008c. Use Thermal Time to Predict Leaf Stage Development in Corn. Corny News Network, Purdue Univ. [On-Line]. Available at <http://www.kingcorn.org/news/timeless/VStagePrediction.html> [URL accessed May 2011]. Nielsen, RL (Bob). 2010. Determining Corn Leaf Stages. Corny News Network, Purdue Univ. [On-Line]. Available at <http://www.kingcorn.org/news/timeless/VStageMethods.html> [URL accessed May 2011]. Owen, Mike. 2008a. Replant Options in Corn Fields. Integrated Crop Management Newsletter, Iowa State Univ Extension. [On-line]. Available at <http://www.extension.iastate.edu/CropNews/2008/0531MikeOwen2.htm> [URL accessed May 2011]. Owen, Mike. 2008b. Replanting Corn – How Do You Get Rid of the Existing Stand? Integrated Crop Management Newsletter, Iowa State Univ Extension. [On-line]. Available at <http://www.extension.iastate.edu/CropNews/2008/0531MikeOwen.htm> [URL accessed May 2011]. Pataky, J. K., and K. M. Snetselaar. 2006. Common smut of corn. The Plant Health Instructor. DOI:10.1094/PHI-I-2006-0927-01 [On-line] Available at <http://www.apsnet.org/edcenter/intropp/lessons/fungi/Basidiomycetes/Pages/CornSmut.aspx> [URL accessed May 2011]. Sweets, Laura. 2008. Seed Decay and Seedling Blights of Corn. Integrated Pest & Crop Management Newsletter, Univ of Missouri Extension. [On-line]. Available at <http://ppp.missouri.edu/newsletters/ipcm/archives/fullissue/v18n9.pdf> [URL accessed May 2011]. Sweets, Laura. 2011. Crazy Top of Corn. Integrated Pest & Crop Management Newsletter, Univ of Missouri Extension. [On-line]. Available at <http://ppp.missouri.edu/newsletters/ipcm/archives/fullissue/v21n9.pdf> [URL accessed May 2011]. Thomison, Peter. 2010. Injury to Corn from Ponding and Saturated Soils. C.O.R.N. Newsletter, Ohio State Extension. [On-line]. Available at <http://corn.osu.edu/newsletters/2010/2010-11/injury-to-corn-from-ponding-and-saturated-soils/?searchterm=ponding> [URL accessed May 2011]. This planting season is going down in the record books as one of the wettest and one of the slowest for Indiana and the eastern corn belt. As of May 22nd, only 17% of the intended soybean acres were planted across Indiana with the majority in the northwestern and west-central areas (USDA-NASS, 2011). We are approximately two weeks behind the five-year average and nearly four weeks behind last years furious pace (Figure 1). Soybean planting progress near this calendar day was 25% in 2009, 38% in 2008, and 19% in 2002. The current planting progress is mirroring 2009 growing season up to this point (Figure 2).
Figure 1. Indiana soybean planting progress in 2011 (USDA-NASS, 2011) Figure 2. Late soybean plantings in Indiana from 1997 to 2010 (USDA-NASS, 2011)
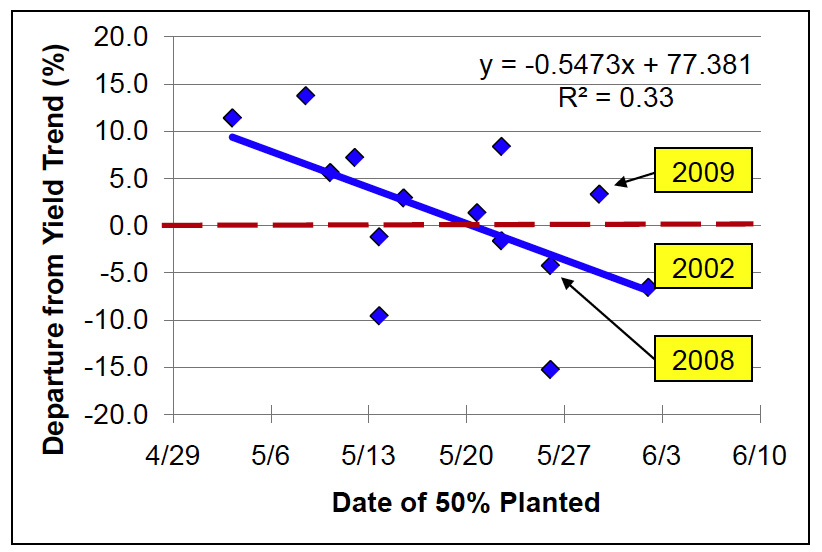
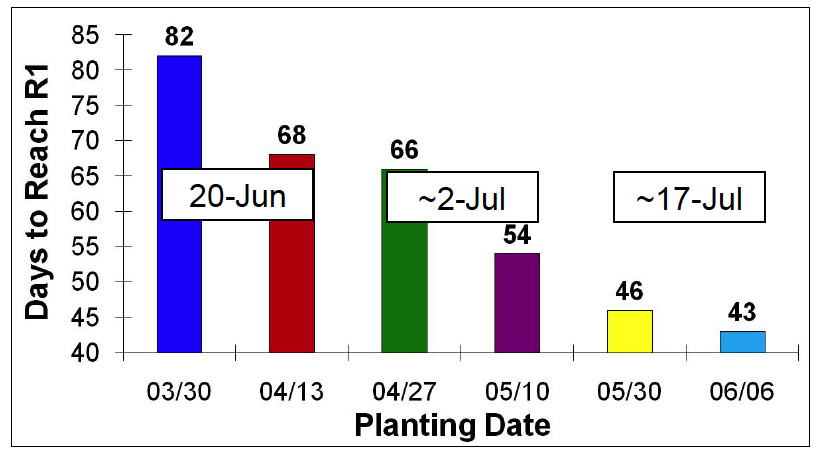
Late Planting Effects. I certainly preach the importance of timely plantings to maximize yields, which is normally within the first three weeks of May for Indiana. Two benefits of these plantings include greater node development prior to flowering and quicker canopy to capture sunlight and shade out weeds. The yield potential can be reduced as planting is delayed, but it is not a guarantee that yields will be lower. Delayed planting probably contributed to the low state yields in 2002 (41.5 bu/acre) and in 2008 (45.0 bu/acre), which were nearly 7% and 4% BELOW the annual yield trend. However Indiana averaged 49.0 bu/acre in 2009, which was 3% ABOVE the annual yield trend. Favorable seed fill period in 2009 allowed many soybeans to increase seed size to compensate for fewer nodes and thus, yield well. Approximately 33% of soybean yield departures were related to the date at which half of the soybean acres were planted in Indiana (Figure 3) which is slightly higher than is noted for corn (Nielsen, 2011). Soybeans trip their reproductive trigger (flowering) as the day length shortens, which occurs much quicker with delayed plantings (Figure 4) and partially explains the greater effect to soybean over corn.
Figure 3. Departure from soybean yield trend based on 50% planting dates in Indiana (USDA-NASS, 2011) Figure 4. Number of days from planting to reach R1 (First Bloom) in West Lafayette Tips When Planting Soybeans Late. We need set the stage for the best possible return on late plantings of soybean. Planting in the first weeks of June require 10 to 20% increase in seeding rates to facilitate quicker row closure and higher pod height with fewer days to flowering. Increased seeding rates will also be needed in those fields that have heavy corn residue and weed biomass (see Casteel, 2011 for my seeding rate discussion). Late-planted soybeans should also be planted in narrow rows to hasten the time to row closure. Wide rows (30-in) take nearly 25 days longer and 40 days longer to canopy compared to 15-in and 7.5-in rows, respectively. This delay will certainly decrease the yield potential as canopy closure would occur well after reproductive initiation. Full-season varieties for your respective regions should be planted until June 15 for the northern quarter, June 20 for the central half, and June 25 for the southern quarter of Indiana. Varieties should be dropped a half maturity group after these dates and planted for another two weeks before we consider other alternatives.
References:
Casteel, S.N. 2011. Fine-tune soybean seeding rates during chilly and wet spring. [On-line]. Available at
<http://www.agry.purdue.edu/ext/soybean/Arrivals/2011_0421SOYSeedRate.pdf>
Nielsen, R.L. 2011. Corn planting date is important, but
[On-line]. Available at USDA-NASS. 2011. Crop Progress and Condition. USDA, National Agricultural Statistics Service. [On-line]. Available at <http://usda.mannlib.cornell.edu/MannUsda/viewDocumentInfo.do?documentID=1048>
Assessing Available Nitrogen from Fall- and Spring-Applied Nitrogen Applications - (Jim Camberato, Bob Nielsen, and Brad Joern)
Excessive rainfall and flooding in early to late spring can result in the loss of some fall- and spring-applied nitrogen (N) . Both of these N forms are subject to leaching through the soil into tile drains or groundwater. In addition, the nitrate form of N can converted to several gaseous forms and lost to the atmosphere from deep within the soil by a bacterial process called denitrification. Unfortunately, no matter what form of N was added to the soil it will eventually become nitrate. Calendar time since N application and spring temperatures influence the extent to which both fall- and spring-applied N convert to the nitrate form. Many factors affect how much N is lost from soil, therefore it is difficult to accurately estimate the amount of N loss that may have occurred by any point in time. One of the viable options to estimate the amount of remaining soil N is to consider soil sampling and analysis for the nitrate and ammonium forms of N. Figure 1. Recommended soil sampling pattern in relation to two corn rows when N fertilizer has been banded with the row. Always sample perpendicular to the direction fertilizer was applied. (Source of image: Brouder and Mengel, 2003). NO3-N = Nitrate nitrogen 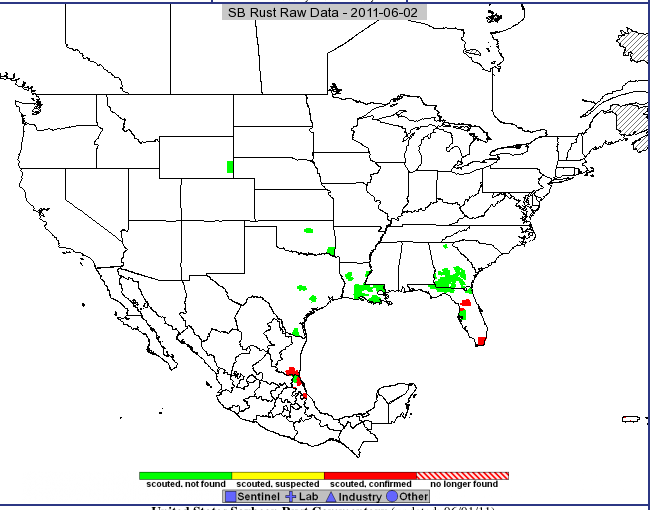
![]()
*Be prepared with a rotary hoe to break up the crust and aid emergence.
• The greater the deposition of mud or old crop residues on plants as the water subsides, the greater the stress on the plants due to reduced photosynthesis.
*The common smut fungal organism is ubiquitous in soils and can infect young corn plants through tissue damaged by floodwaters. There is limited hybrid resistance to either of these two diseases and predicting damage is difficult until later in the growing season.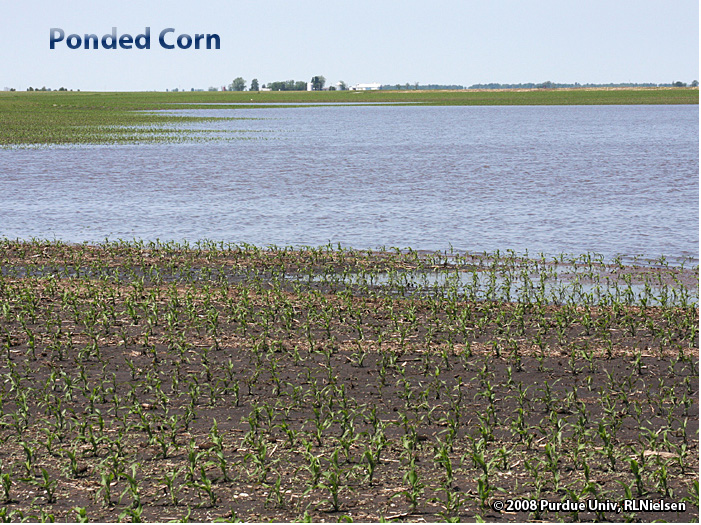
![]()
Thoughts on Late Planting of Soybean (Shaun N. Casteel)

![]()
Soil sampling strategies
Collect soil cores for soil N analyses to a depth of at least 1 foot. Where earlier-applied fertilizer N was broadcast rather than banded, collect 20 to 30 soil cores per sample. Where earlier-applied fertilizer N was banded (e.g., anhydrous ammonia), collect 15 to 20 soil cores using the sampling scheme illustrated in Figure 1. Consider collecting a separate deeper soil sample from between 1- and 2-foot deep for a more complete assessment of plant available N, especially in sandy soils where leaching through the soil profile is the predominant form of N loss.
TIP: One sample should represent no more than 10 acres.
Sample handling
Dry or refrigerate the soil samples as soon as possible to stop the soil microbes from altering the N levels. Spread the soil thinly on plastic to air dry and hasten drying with a fan if possible. If you choose to use an oven to dry the soil, keep the temperature below 250°F. Alternatively refrigerate the samples and keep them cold through shipping to the laboratory. A list of certified soil testing laboratories is available at <http://www.ag.purdue.edu/agry/extension/Pages/soil-testing-labs.aspx>. Most should offer soil N test analysis services, but contact them first to confirm.
Soil-test laboratory analyses
Ammonium N (NH4-N) is just as available to plants as is nitrate N (NO3-N), but typically little accumulates in the soil because it is readily converted to nitrate under most conditions. However, if N fertilizer was recently applied, there may well yet be some ammonium N available in the soil for plant use.
TIP: When you submit the soil samples to the soil-testing laboratory, request analyses for exchangeable ammonium as well as for nitrate, particularly if anhydrous ammonia was applied relatively recently or a nitrification inhibitor was used with the N fertilizer.
Significant levels of soil ammonium are most likely if anhydrous ammonia was the N source, a nitrification inhibitor such as nitrapyrin or dicyandiamide (DCD) was used, and/or soil pH was low ( below 5.5 ). In these situations, low levels of soil nitrate may indicate little conversion of ammonium to nitrate, rather than simply loss of nitrate.

If soil test values for ammonium and nitrate are reported as ppm or mg/L nitrogen (NH4-N or NO3-N), then pounds per acre of available N are calculated by multiplying the test results by 4 when the sample depth was 1 foot. For other sample depths, divide the sample depth (in inches) by 3 and then multiply by the test results.
Example: Soil NO3-N in a 1-foot sample was 30 ppm.
Conversion from ppm to pounds per acre is (12 inches / 3) x 30 ppm = 120 pounds per acre.
If soil test values are reported directly as NH4 or NO3, then these values must be converted to an ‘N’ basis first. The calculations are: NH4-N = NH4 / 1.2 and NO3-N = NO3 / 4.5.
Example: Soil NO3 was reported to be 90 ppm.
Conversion from NO3 to NO3-N is 90 ppm NO3 / 4.5 = 20 ppm NO3-N.
Interpreting soil nitrate and ammonium levels
In our opinion, soil nitrate and ammonium levels can be used to guide additional N applications to fields subjected to saturation and flooding. However, there are admittedly no hard and fast research-based recommendations for this particular situation.
The primary tool for soil N sampling in the Eastern Corn Belt has been the pre-sidedress soil nitrate test (PSNT) which is most applicable as an indicator of N availability in soils where manure had been applied or a legume such as clover or alfalfa had been plowed down (Brouder & Mengel, 2003). For these field situations, the level of soil nitrate found is considered an index of N availability, i.e., an indicator of how much N is currently available AND how much N may become available from the manure or organic matter. When used in this context, soil NO3-N levels greater than 25 ppm are thought to be adequate for optimum corn yield without the addition of more fertilizer N. During the research that developed this soil test, sampling deeper than 1 foot or analyzing for exchangeable NH4-N did not increase the predictive ability of the PSNT enough to warrant the extra effort.
However, when the intent is to assess the loss of N due to rainfall, we suggest that deeper sampling plus analysis for NH4-N content can provide useful information to help growers decide whether additional fertilizer N is merited. It is important to recognize that in this context, measurements of soil nitrate and ammonium following fertilizer N applications indicate current N availability only, because there is no manure- or legume-derived N to be released later in the season. Considering this fact, the commonly accepted 25 ppm NO3-N critical level for manure- or legume-N fertilized soils may be too low for soils that have only received fertilizer N.
Leaching of soil nitrate is expected with ponding, flooding, or soil saturation, but not all of the nitrate will have been moved below the root zone. A shortcoming of the 1-foot sampling depth is that it does not always reflect plant available N deeper in the profile, particularly when abnormal leaching occurs. This is why we suggest also sampling from the 1- to 2-foot depth for assessment of soil N availability, particularly in sandy soils.
In our on-going N rate trials conducted throughout the state, the “normal” background levels of soil N in the upper 1 foot of mineral soils typically range from 5 to 10 ppm NO3-N and 4 to 8 ppm NH4-N for corn grown in rotation with soybean or corn without manure- or legume-derived N. Typically the deeper 1- to 2-foot soil samples would have slightly lower N levels.
Making a decision
We suggest that the 25 ppm NO3-N critical level for manure- or legume-N fertilized soils may be too low for soils that have only received fertilizer N and where N loss conditions have been severe. Where enough rainfall has occurred to cause substantial N loss, we suggest this level of rain has depleted the lower soil profile as well as the upper foot of soil.
The accompanying table contains estimates of expected soil NO3-N levels with different fertilizer rates assuming “normal” background levels of nitrate and ammonium at the time of fertilization and a “normal” amount of movement below the one foot sampling depth (approximately 1/3 of the fertilizer N is moved below the 1-foot sampling depth but retained within the root zone with normal rainfall). If the corn is healthy and the growing season typical from here on out, we would suggest applying no more than 10 pounds of N for every 2 ppm reduction in soil sample N below the expected levels listed in the table.
Table 1. Expected levels of nitrate and nitrate plus ammonium in the upper 1 foot of soil for different rates of applied N fertilizer. Note: Use the NO3-N column if this is the only form of N measured in your soil sample. Add NO3-N and NH4-N levels together if both forms of N are measured in the soil sample and use the last column to assess N supply.
Fertilizer N applied prior to rains
Nitrogen Analysis
Expected N levels, ppm or mg/L N
NO3-N
NO3-N + NH4-N
lb/acre
*
**
130
30
36
140
31
37
150
33
39
160
35
41
170
36
42
180
38
44
190
40
46
200
41
47
210
43
49
220
45
51
NH4-N= Ammonium nitrogen
*Assumes background level of ammonium at 67 ppm and "normal" levels of soil N below
the 1-foot sampling depth.
**Assumes "normal" levels of soil N below the 1-foot sampling depth.
Recognize that as a healthy crop moves through the rapid growth phase prior to pollination, soil N levels will naturally decrease in response to rapid N uptake by the plants. However, by the time a healthy crop reaches the V9 leaf stage (about 30 inches tall), only 19 lbs/ac N (equivalent to 5 ppm soil NO3-N in a 1-foot deep sample) have typically been taken up the plants (Mengel, 1995). However, by the time a healthy crop reaches shoulder-high (~ V15 or 60 inches tall), approximately 116 lbs/ac N (equivalent to 29 ppm soil NO3-N in a 1-foot deep sample) have been taken up by the plants.
The following examples give you an idea of how the tabular information may be used to make this decision.
Example calculation when only NO3-N is determined:
Fertilizer N was applied at 160 pounds of N per acre in early April as 28% UAN in southern Indiana. Only soil NO3-N analysis was requested because it was assumed that most of the urea- and ammonium-N had been converted to nitrate since temperatures were warm prior to the April and May rains. The expected NO3-N level from the table below for a 160-lb N application is 35 ppm. Laboratory results indicated only 20 ppm NO3-N. The suggested N application rate would be: ((35 ppm – 20 ppm) / 2) x 10 = (15 ppm / 2) x 10 = 7.5 x 10 = 75 pounds per acre.
Example calculation when both NO3-N and NH4-N are determined:
Anhydrous ammonia with nitrapyrin was applied at 160 pounds of N per acre in late April in northern Indiana. Since the N application was relatively recent and a nitrification inhibitor was used , both NO3-N and NH4-N analysis of soil samples were requested. The expected NO3-N plus NH4-N levels listed in the table for a 160-lb N application is 41 ppm. Laboratory results indicated 15 ppm NO3-N and 20 ppm NH4-N for a total measured N level of 35 ppm. The suggested N application rate would be: ((41 ppm – 35 ppm) / 2) x 10 = (6 ppm / 2) x 10 = 3 x 10 = 30 pounds per acre.
Sidedress N application rates
If no fertilizer-N has been applied this season or soil N measurements suggest little N remains from fall- and spring-applied N, consider using our recent research findings to determine the proper application rate. Results from field trials conducted since 2006 throughout the state with efficient methods and timings of N fertilizer application suggest that the average N rate needed to maximize yield [Agronomic Optimum N Rate (AONR)] for corn following soybean (corn/soy) varies by region or soil type. The estimated AONR for fine textured soils in westcentral and northwest Indiana is 173 lbs N / ac. The AONR for fine textured soils in northeast, eastcentral, and central Indiana is approximately 221 lbs N / ac. The AONR for the remainder of the state (NC, SW, SC, and SE) is approximately 183 lbs N / ac. For more details on these recommendations see our current publication Nitrogen Management Guidelines for Indiana at: <http://www.agry.purdue.edu/ext/corn/news/timeless/NitrogenMgmt.pdf>.
At the five Purdue locations where we conducted paired trials of corn/soy and corn following corn (corn/corn) in 2007-2010, the average AONR for corn/corn was 44 lbs greater than for corn/soy while average corn/corn yields were 18 bu/ac less than the corn/soy yields. Based on $0.50-$0.70/lb N and $7.00/bu corn, the average Economic Optimum N Rate (EONR) for corn following soybean was approximately 164, 203, and 172 lbs N / ac for WC+NW, NE+EC+C, and the remainder of the state, respectively. The EONR values for other combinations of N cost and grain price are listed in the Nitrogen Management Guidelines for Indiana or in the on-line N calculator for Indiana at this web site: <http://extension.agron.iastate.edu/soilfertility/nrate.aspx>.
Related References
Blackmer, A.M., D. Pottker, M.E. Cerrato, and J. Webb. 1989. Correlations between soil nitrate concentrations in late spring and corn yields in Iowa. J. Prod. Agric. 2:103-109.
Brouder, Sylvie and David Mengel. 2003. The Presidedress Soil Nitrate Test for Improving N Management in Corn (AY-314-W). Purdue Extension. [On-line]. Available at <http://www.agry.purdue.edu/ext/pubs/AY-314-W.pdf>. [URL accessed May 2011].
Camberato, Jim, RL (Bob) Nielsen, Eric Miller, and Brad Joern. 2011. Nitrogen Management Guidelines for Indiana. Applied Crop Research Update, Purdue Univ. Agronomy Dept. <http://www.agry.purdue.edu/ext/corn/news/timeless/NitrogenMgmt.pdf>. [URL accessed May 2011].
Certified Soil Testing Laboratories. 2010. Purdue Agronomy Extension [On-line]. Available at <http://www.ag.purdue.edu/agry/extension/Pages/soil-testing-labs.aspx>. [URL accessed May 2011 ].
Corn Nitrogen Rate Calculator. 2011. A regional N rate calculator hosted on a Web server at Iowa State Univ. <http://extension.agron.iastate.edu/soilfertility/nrate.aspx> [URL accessed May 2011].
Ferrer, Francesc, J.M. Villar, C.O. Stockle, P. Villar, and M. Aran. 2003. Use of a pre-sidedress soil nitrate test (PSNT) to determine nitrogen fertilizer requirements for irrigated corn. Agronomie 23:561-570.
Mengel, David. 1995. Roots, Growth, and Nutrient Uptake. Purdue Agronomy Extension Paper AGRY-95-08. [On-line]. Available at <http://www.agry.purdue.edu/ext/pubs/AGRY-95-08.pdf>. [URL accessed May 2011 ].
![]()
![]()