Pest & Crop
Newsletter
Purdue Cooperative Extension Service
Purdue Cooperative Extension Service
Issue 26, September 29, 2017 • USDA-NIFA Extension IPM Grant
Among the top 10 most discussed (and cussed) topics at the Chat 'n Chew Cafe during corn harvest season is the grain test weight being reported from corn fields in the neighborhood. Test weight is measured in the U.S. in terms of pounds of grain per volumetric bushel. In practice, test weight measurements are based on the weight of grain that fills a quart container (32 qts to a bushel) that meets the specifications of the USDA-FGIS (GIPSA) for official inspection (Fig. 1). Certain electronic moisture meters, like the Dickey-John GAC, estimate test weight based on a smaller-volume cup. These test weight estimates are reasonably accurate but are not accepted for official grain trading purposes.
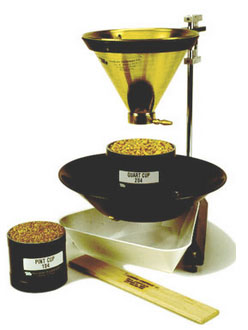
Fig. 1. A standard filling hopper and stand for the accurate filling of quart or pint cups for grain test weight determination. (Image: http://www.seedburo.com).
The official minimum allowable test weight in the U.S. for No. 1 yellow corn is 56 lbs/bu and for No. 2 yellow corn is 54 lbs/bu (USDA-GIPSA, 1996). Corn grain in the U.S. is marketed on the basis of a 56-lb "bushel" regardless of test weight. Even though grain moisture is not part of the U.S. standards for corn, grain buyers pay on the basis of "dry" bushels (15 to 15.5% grain moisture content) or discount the market price to account for the drying expenses they expect to incur handling wetter corn grain.
Growers worry about low test weight because local grain buyers often discount the market price offered for low test weight grain. In addition, growers are naturally disappointed when they deliver a 1000 bushel (volumetric bushels, that is) semi-load of grain that averages 52-lb test weight because they only get paid for 929 56-lb "market" bushels (52,000 lbs ÷ 56 lbs/bu) PLUS they receive a discounted price for the low test weight grain. On the other hand, high test weight grain makes growers feel good when they deliver a 1000 bushel semi-load of grain that averages 60 lb test weight because they will get paid for 1071 56-lb "market" bushels (60,000 lbs ÷ 56 lbs/bu).
These emotions encourage the belief that high test weight grain (lbs of dry matter per volumetric bushel) is associated with high grain yields (lbs. of dry matter per acre) and vice versa. However, there is little evidence in the research literature that grain test weight is strongly related to grain yield.
Hybrid variability exists for grain test weight, but does not automatically correspond to differences in genetic yield potential. Grain test weight for a given hybrid often varies from field to field or year to year, but does not automatically correspond to the overall yield level of an environment.
Similarly, grain from high yielding fields does not necessarily have higher test weight than that from lower yielding fields. In fact, test weight of grain harvested from severely stressed fields is occasionally higher than that of grain from non-stressed fields, as evidenced in Fig. 2 for 27 corn hybrids grown at 3 locations with widely varying yield levels in Kansas in 2011. Another example from Ohio with 22 hybrids grown in common in the drought year of 2012 and the much better yielding year of 2013 also indicated no relationship between yield level and grain test weight (Fig. 3).
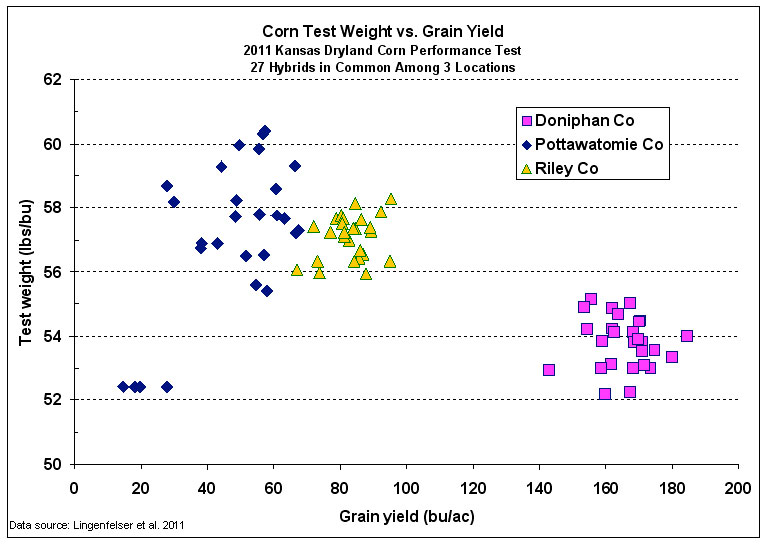
Fig. 2. Corn grain test weight versus grain yield for 27 hybrids grown at 3 Kansas locations (Lingenfelser et al, 2011).
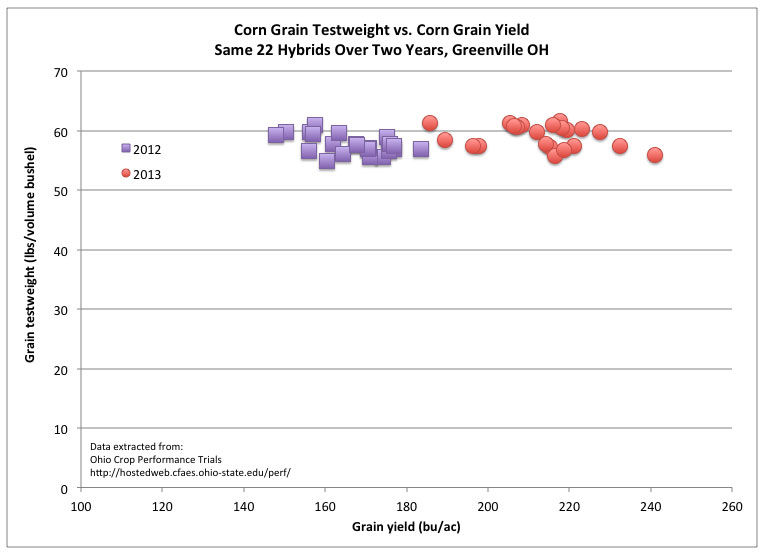
Fig. 3. Corn grain test weight versus grain yield for 22 hybrids grown at Greenville, OH in 2012 (drought) and 2013 (ample rainfall).
Conventional dogma suggests that low test weight corn grain decreases the processing efficiency and quality of processed end-use products like corn starch (U.S. Grains Council, 2017), although the research literature does not consistently support this belief. Similarly, low test corn grain is often thought to be inferior for animal feed quality, although again the research literature does not support this belief (Rusche, 2012, Simpson, 2000, Wiechenthal Pas et al., 1998). Whether or not low test weight grain is inferior to higher test weight grain may depend on the cause of the low test weight in the first place.
During the 2009 corn harvest season in Indiana, there were more reports of low test weight corn grain than good or above average test weights. There were primarily six factors that accounted for most of the low test weight grain in 2009 and four shared a common overarching effect.
First and foremost, growers should understand that test weight and grain moisture are inversely related. The higher the grain moisture, the lower the test weight AT THAT POINT IN TIME. As grain dries in the field or in the dryer, test weight naturally increases as long as kernel integrity remains intact. Test weight increases as grain dries partly because kernel volume tends to shrink with drying and so more kernels pack into a volume bushel and partly because drier grain is slicker which tends to encourage kernels to pack more tightly in a volume bushel.
Therefore in a year like 2009 with many of the initial harvest reports of grain moisture ranging from 25 to 30% instead of the usual starting moisture levels of about 20 to 23%, it should not be surprising that test weights were lower than expected. Hellevang (1995) offered a simple formula for estimating the increase in test weight with grain drying. In its simplest form, the equation is (A / B) x C; where A = 100 - dry moisture content, B = 100 - wet moisture content, and C = test weight at wet moisture content. The author does not say, but I suspect this simple formula is most applicable within a "normal" range of harvest moistures; up to moistures in the mid- to high 20's.
Example: Dry moisture = 15%, Wet moisture = 25%, Test weight at 25% = 52 lbs/bu.
Estimated test weight at 15% moisture = ((100 - 15) / (100 - 25)) x 52 = (85/75) x 52 = 58.9 lbs/bu
An older reference (Hall & Hill, 1974) offers an alternative suggestion for adjusting test weight for harvest moisture that also accounts for the level of kernel damage in the harvested grain (Table 1). The table values are based on the premise that kernel damage itself lowers test weight to begin with and that further drying of damaged grain results in less of an increase in test weight that what occurs in undamaged grain. Compared to the results from using Hellevang's simple formula, adjustments to test weight using these tabular values tend to result in smaller adjustments to test weight for high moisture grain at harvest, but larger adjustments for drier grain at harvest.
Table 1. Adjustment added to the wet-harvest test weight to obtain an expected test weight level after drying to 15.5 percent moisture.
| Percent Damage | 30% Grain Moisture at Harvest |
28% Grain Moisture at Harvest |
26% Grain Moisture at Harvest |
24% Grain Moisture at Harvest |
22% Grain Moisture at Harvest |
20% Grain Moisture at Harvest |
18% Grain Moisture at Harvest |
16% Grain Moisture at Harvest |
|---|---|---|---|---|---|---|---|---|
| 45 | 0.3 | |||||||
| 40 | 0.7 | 0.2 | ||||||
| 35 | 1.3 | 0.7 | ||||||
| 30 | 1.8 | 1.3 | 0.8 | |||||
| 25 | 2.4 | 1.9 | 1.4 | 0.9 | 0.3 | |||
| 20 | 3.1 | 2.6 | 2.0 | 1.5 | 1.0 | 0.5 | ||
| 15 | 3.8 | 3.2 | 2.7 | 2.2 | 1.7 | 1.2 | 0.7 | 0.2 |
| 10 | 4.5 | 4.0 | 3.5 | 2.9 | 2.2 | 1.9 | 1.4 | 0.8 |
| 5 | 5.3 | 4.7 | 4.2 | 3.7 | 3.0 | 2.7 | 2.1 | 1.6 |
| 0 | 6.1 | 5.6 | 5.0 | 4.5 | 4.0 | 3.5 | 2.9 | 2.4 |
Source: Hall & Hill, 1974
Secondly, thirdly, and fourthly; drought stress, late-season foliar leaf diseases (primarily gray leaf spot and northern corn leaf blight), and below normal temperatures throughout September of 2009 all resulted in a significant deterioration of the crop's photosynthetic machinery beginning in early to mid-September that "pulled the rug out from beneath" the successful completion of the grain filling period in some fields; resulting in less than optimum starch deposition in the kernels. Fifthly, early October frost/freeze damage to late-developing, immature fields resulted in leaf or whole plant death that effectively put an end to the grain-filling process with the same negative effect on test weight.
Finally, ear rots (diplodia, gibberella, etc.) were widespread throughout many areas of Indiana in 2009. Kernel damage by these fungal pathogens results in light-weight, chaffy grain that also results in low test weight diseased grain, broken kernels, and excessive levels of foreign material. This cause of low test weight grain obviously results in inferior (if not toxic) animal feed quality grain, unacceptable end-use processing consequences (ethanol yield, DDGS quality, starch yield and quality, etc.), and difficulties in storing the damaged grain without further deterioration.
Bern, Carl and Thomas Brumm. 2009. Grain Test Weight Deception. Iowa State Extension Publication PMR-1005. [online] http://www.extension.iastate.edu/Publications/PMR1005.pdf. [URL accessed Sep 2017].
Bradley, Carl. 2009. Diplodia Ear Rot Causing Problems in Corn Across the State. The Bulletin, Univ of Illinois Extension. [online]. http://ipm.illinois.edu/bulletin/article.php?id=1233. [URL accessed Sep 2017].
Hall, Glenn and Lowell Hill. 1974. Test Weight Adjustment Based on Moisture Content and Mechanical Damage of Corn Kernels. Trans. ASAE 17:578-579.
Hellevang, Kenneth. 1995. Grain Moisture Content Effects and Management. North Dakota State Extension Publication AE-905. [online]. http://www.ag.ndsu.edu/extension-aben/documents/ae905.pdf. [URL accessed Sep 2017].
Hicks, D.R. and H.A. Cloud. 1991. Calculating Grain Weight Shrinkage in Corn Due to Mechanical Drying. Purdue Extension Publication NCH-61 [online]. http://www.ces.purdue.edu/extmedia/nch/nch-61.html. [URL accessed Sep 2017].
Hill, Lowell D. 1990. Grain Grades and Standards: Historical Issues Shaping the Future. Univ. of Illinois Press, Champaign, IL.
Hurburgh, Charles and Roger Elmore. 2008. Corn Quality Issues in 2008 - Moisture and Test Weight. Integrated Crop Management News, Iowa State Univ. Extension. [online]. https://crops.extension.iastate.edu/cropnews/2008/10/corn-quality-issues-2008-moisture-and-test-weight. [URL accessed Sep 2017].
Hurburgh, Charles and Roger Elmore. 2008. Corn Quality Issues in 2008 – Storage Management. Integrated Crop Management News, Iowa State Univ. Extension. [online]. https://crops.extension.iastate.edu/cropnews/2008/10/corn-quality-issues-2008-–-storage-management. [URL accessed Sep 2017].
Lingenfelser, Jane (sr. author). 2011. Kansas Crop Performance Tests with Corn Hybrids (SRP1055). Kansas State University Agricultural Experiment Station and Cooperative Extension Service, Kansas State Univ.
Nafziger, Emerson. 2003. Test Weight and Yield: A Connection? The Bulletin, Univ of Illinois Extension. [online]. http://ipm.illinois.edu/bulletin/pastpest/articles/200323h.html. [URL accessed Sep 2017].
Rusche, Warren. 2012. Feeding Value of Light-Test Weight Corn. iGrow, South Dakota State Univ Extension. http://igrow.org/livestock/beef/feeding-value-of-light-test-weight-corn. [URL accessed Sep 2017]
Simpson, Greg. 2000. Summary of Research on Feeding Low Test Weight Corn to Pigs. Ontario Ministry of Ag, Food, and Rural Affairs. http://www.omafra.gov.on.ca/english/livestock/swine/facts/info_n_summary.htm. [URL accessed Sep 2017]
USDA-GIPSA. United States Standards for Corn. 1996. USDA Grain Inspection, Packers and Stockyards Administration (GIPSA). [online] http://www.gipsa.usda.gov/fgis/standards/810corn.pdf. [URL accessed Sep 2017].
U.S. Grains Council. 2017. Quality Test Results: Grade Factors: Test Weight. http://www.grains.org/key-issues/corn-export-cargo-quality-report/1-test-weight. [URL accessed Sep 2017]
Weichenthal Pas, B.A., I.G. Rush, B.G. Van Pelt, A.D. Howes, and J.R. Males. 1998. Light-Test Weight Corn for Growing and Finishing Steers. The Professional Animal Scientist, Vol. 14, Issue 2, pp. 114-117. Elsevier, Inc. http://www.sciencedirect.com/science/article/pii/S1080744615318040. [URL accessed Sep 2017]
Woloshuk, Charles and Kiersten Wise. 2009. Diplodia Ear Rot. Purdue Extension Publication #BP-75-W. https://www.extension.purdue.edu/extmedia/BP/BP-75-W.pdf. [URL accessed Sep 2017].
Corn is often harvested at grain moisture contents higher than what is desired by grain buyers, which is typically about 15% moisture. Wetter grain obviously weighs more than drier grain and so grain buyers will "shrink" the weight of "wet" grain to the equivalent weight of "dry" grain and then divide that weight by 56 to calculate the market bushels of grain they will purchase from the grower. The two sources of weight loss due to mechanical drying are 1) that due to the loss of grain moisture itself and 2) the anticipated weight loss due to dry matter loss during the grain drying and handling processes (e.g., broken kernels, fines, foreign materials).
An exact value for the handling loss, sometimes called "invisible shrink", is difficult to predict and can vary significantly from one grain buyer to another. For a lengthier discussion on grain weight shrinkage due to mechanical drying, see Hicks & Cloud, 1991.
The simple weight loss due to the reduction in grain moisture represents the greatest percentage of the total grain weight shrinkage due to drying and is easily calculated using a handheld calculator or a smartphone calculator app. In general terms, you first convert the "wet" weight to absolute dry weight. Then you convert the absolute dry weight to market-standard "dry" weight at 15% grain moisture.
For example, if the initial grain moisture content is 20%, then the initial percent dry matter content is 80% (e.g., 100% - 20%). NOTE: The initial percent dry matter content varies depending on the initial grain moisture content.
If the desired ending grain moisture content is 15% (the typical market standard), then the desired ending percent dry matter content is 85% (100% - 15%).
Multiply the weight of the "wet" grain by the initial percent dry matter content, then divide the result by the desired ending percent dry matter content.
Example:
One take-home reminder from this little exercise is the fact that the grain trade allows you to sell water in the form of grain moisture... up to a maximum market-standard 15% grain moisture content (or 14% for long term storage). Take advantage of this and maximize your "saleable" grain weight by avoiding delivering corn grain to the elevator at moisture levels less than 15% moisture content.
Hicks, D.R. and H.A. Cloud. 1991. Calculating Grain Weight Shrinkage in Corn Due to Mechanical Drying. National Corn Handbook Publication NCH-61. https://www.extension.purdue.edu/extmedia/nch/nch-61.html. [URL accessed Sep 2017]
Nielsen, RL (Bob). 2014. Corn Grain Test Weight. Corny News Network, Purdue Extension. http://www.kingcorn.org/news/timeless/TestWeight.html. [URL accessed Sep 2017]
Pryor, Randy, Paul Jasa, & Jenny Rees. 2017. Plan Harvest to Deliver Soybeans at the Optimum Moisture. Cropwatch, Univ Nebraska Extension. http://cropwatch.unl.edu/2017/plan-harvest-deliver-soybean-optimum-moisture. [URL accessed Sep 2017]
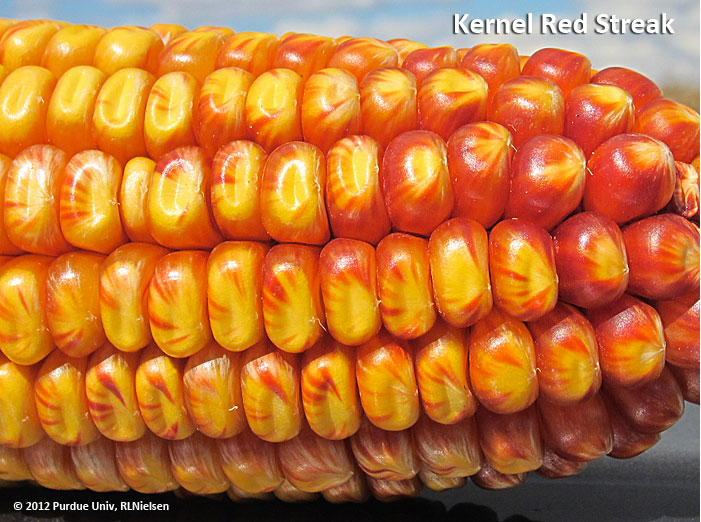
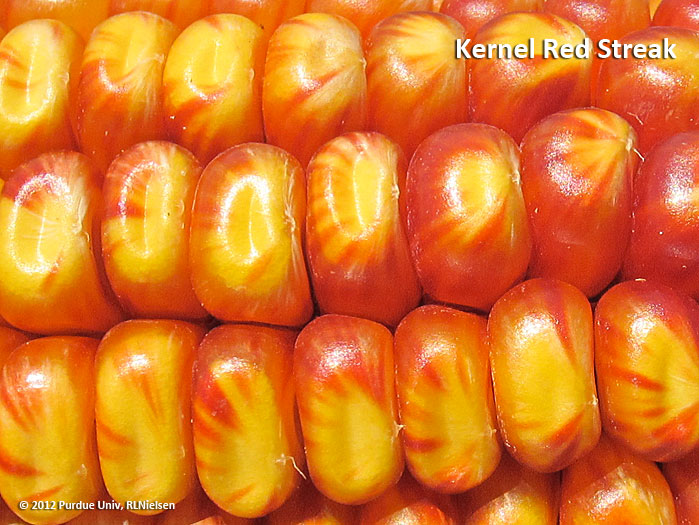
Kernel red streak, or KRS, is a phenomenon wherein streaks of red pigments radiate throughout the pericarp of an otherwise yellow kernel. On a bright, sunny day, the combination of red and yellow is strikingly beautiful. The occurrence of kernel red streaking does not seem to restrict itself to fields of "good" corn or "bad" corn. Some hybrids seem to exhibit KRS more often than others, but those may simply be random chance observations.
The KRS symptom was apparently first documented in 1963 in fields throughout northeast Indiana, southern Michigan, and northwest Ohio (Anonymous, 1963) and in Ontario in 1964 (Wall & Mortimore, 1965). By 1966 (Williams, 1966), researchers had begun to associate the KRS symptom with the concomitant presence of the wheat curl mite (Aceria tulipae K.; aka Aceria tosichella Keifer), a pest in wheat and vector of the wheat streak mosaic virus (WMSV). Researchers in South Dakota reported in 1969 that KRS could be caused by artificially infesting kernels with wheat curl mites during the grain filling period. The severity of the KRS development was more severe with infestations of mites carrying the WSMV, but also occurred with infestations of virus-free mites.
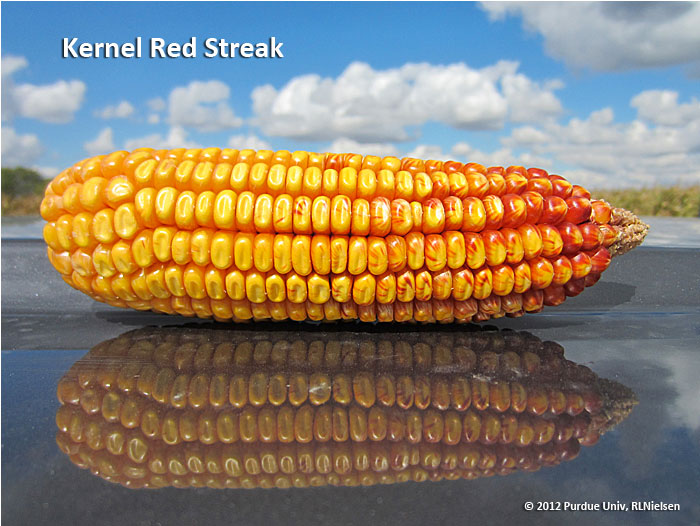
Kernel red streak.
Kernel red streak.
Kernel red streak.
Earlier research (Nault et al., 1967) had suggested that the WSMV was not the cause of the red streaks, but rather the pigmentation resulted from "salivary phytotoxins" secreted by the mites as they fed on the pericarp of kernels. Their work was confirmed by research published from Ontario a year later (Slykhuis et al., 1968). Much later research from Ontario documented the correlation between wheat curl mites and incidence of KRS; as well as the relationship between distance from mite-infested wheat fields and incidence of KRS in adjacent corn fields (Liu et al., 2005).
Growers often worry that the red streaks may signify the presence of ear molds or toxins, but there is no such documented relationship. The most frequent concern with KRS occurs with food grade corn grown under contract for snack food processors. While purely cosmetic, the red pigmentation in the pericarp can discolor the finished products (e.g., corn chips, tortilla chips, taco shells) and, apparently, deter some customers. This appears to be especially true for the wet milling industry wherein the pericarp is not always removed prior to the alkaline cooking process and the remaining pigmented pericarp pieces can turn black with the cooking. Thus, the snack food industry is not keen on purchasing corn grain with high levels of KRS.
Trivia: Though not part of the official grade requirements for corn, the U.S. Standards for Corn (http://www.gipsa.usda.gov/fgis/standards/810corn.pdf) define "yellow corn" as corn that is yellow-kerneled and contains not more than 5 percent of corn of other colors. "White corn" is similarly defined as corn that contains not more than 2 percent of corn of other colors. Grain that does not meet either of these definitions is defined as "Mixed corn". Specifications for food grade corn grain usually refer to #1 yellow or white dent corn.
I have yet to find any research that offers an alternative cause of KRS in yellow dent corn. However, research published by Lee et al. (2009) describes a similar, but reportedly unrelated, phenomenon in white corn that they defined as purple kernel streak (PKS). They distinguished the purple pigmentation of PKS (caused by anthocyanins) from the red pigmentation of KRS (caused by phlobaphenes) and identified different genetic pathways that control the development of the pigments. Their paper suggests that cold temperatures late in the grain filling process may trigger the formation of the anthocyanin pigments in the kernels of sensitive white corn hybrids.
Anonymous. 1963. MSU, USDA analyze “red-stripe” corn in Mich-Ind-Ohio. Seed Trade News 81: 24.
Lee, E.A., J.A. Young, F. Azizi, S. Jay, and A.W. Schaafsma. 2009. Phenotypic and Genotypic Characterization of Purple Kernel Streak in White Food Corn. Crop Science 49(4): 1235–1241.
Liu, J., E.A. Lee, M.K. Sears, and A.W. Schaafsma. 2005. Wheat Curl Mite (Acari: Eriophyidae) Dispersal and Its Relationship with Kernel Red Streaking in Maize. Journal of Economic Entomology 98(5): 1580–1586.
Nault, L.R., M.L. Briones, L.E. Williams, and B.D. Barry. 1967. Relation of wheat curl mite to kernel red streak of corn. Phytopathology 57: 986–989.
Slykhuis, J.T., C.G. Mortimore, and L.F. Gates. 1968. Kernel Red Streak of Corn in Ontario and Confirmation of Aceria tulipae (K.) as the Causal Agent. Can. J. Plant Sci. 48(4): 411–414.
Townsend, Lee, Doug Johnson, and Don Hershman. 1996. Wheat Streak Mosaic Virus and the Wheat Curl Mite. Univ of Kentucky Extension publication ENTFACT-117. Online at https://entomology.ca.uky.edu/ef117 [URL accessed Sep 2017].
Tunac, J.B., and Nagel, C.M. 1969. Kernel red streak of dent corn. Plant Disease Reporter 53: 660–662.
Wall, R.E., and C.G. Mortimore. 1965. Red striped pericarp of corn. Can. Plant Dis. Survey 45: 92–93.
Williams, L.E. 1966. Kernel red streak (KRS) of corn. Proceedings of the Annual Hybrid Corn Industry-Research Conference 21: 18–22.
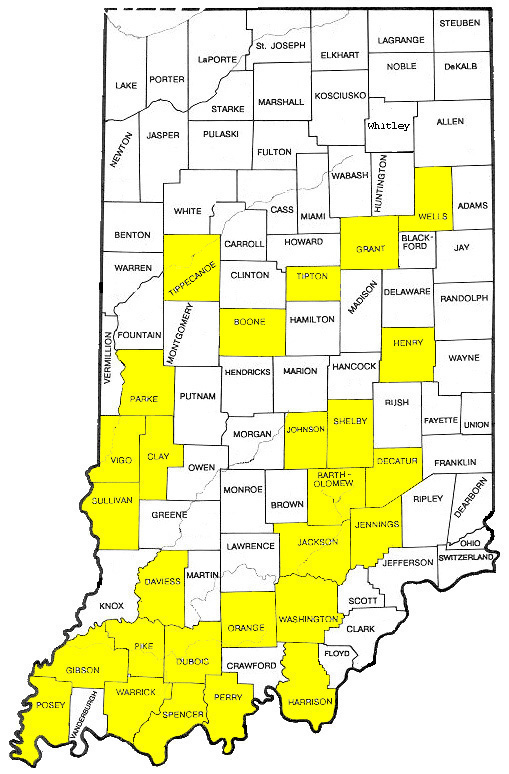
The following map is continually being updated as samples are received and analyzed by Purdue’s Plant and Pest Diagnostic Lab. See the links below for sample submission and more information on southern rust.
Before you put your irrigation system away for the season, create a list of needed repairs and potential improvements. “A good end-of-season list of needed irrigation maintenance and repairs can help irrigators prevent in-season system breakdowns and delays in watering during next summer” says Lyndon Kelley, MSU/Purdue Extension Irrigation Educator.
Create a plan for tackling repairs, and ideally making the repairs, before winter sets in. Often there are special fall pricing and incentives for parts, service and repair work that is booked during the fall and winter months. Using a smart phone to take photos and jot down notes can help create a detailed repair list and makes it easy to send to others.
Put the center pivot system in motion and listen - Listen to each center pivot tower drive system to detect a damaged gear box or worn bearings. Identify gear box leaks and note or mark with a crayon for later repair.
Check wheels and tires - Inspect wheels for loose lug bolts and tires for cracks and wear. If you add air to tires in the fall and they are not still full in the spring, they need to be replaced or at least patched.
Listen to your traveler - Drive system noise can help you identify needed off-season repairs. Take time to listen to the traveler drive system at the point of greatest stress—beginning of the run for hard hose traveler, or end of the run or pull for soft hose systems. Note squeals and knocks that can indicate bearing or equipment wear.
Inspect the distribution system - Turn the water on and walk the length of the system or coverage area and list all the needed repairs. Leaks, bad seals and worn out sprinklers can be marking with a crayon or photographed to will eliminate the need to run water as you make repairs over fall and winter. Watch big guns and endguns for a few cycles. Hesitations in advancing around the semi-circle or in reversing are indications of a needed tune-up or bearing and seal replacement.
Check-out the pressure gauge - First make sure your pressure gauge works. A good gauge should return to zero when system pressure is relieved and should show the fluctuation in system pressure as the endgun or addition sprinklers are turned on and off. Pressure gauges provide very important information on the performance of your system. If you question the accuracy of your gauge, replace it with a good quality liquid filled one. Mounting gauges on an isolator or upright section of pipe 4-5” in length allows the gauge to read the compressed air in the pipe rather than being constantly exposed to water, thus reducing rust accumulation and fouling.
Note the end of season operating pressure - With a good gauge, note the date and operating pressure. A log of operating pressures taken periodically throughout the season should highlight performance of the pump/screen and the static water level the pump pulls from. Expect that normal seasonal fluctuation will create a lower pressure reading in late summer/early fall than a spring reading when water levels are at seasonal highs.
Measure water flow - Many irrigators just have an educated guess at the flow their system puts out. A flow meter can give you a simple, quick look at your system’s output. Late summer/early fall is the low point in the annual cycle for surface water and ground water static water level. Compare the sprinkler package criteria to your measured flow and make adjustments as needed. Many dealers have the capacity to measure irrigation flow for their clients. Several well drillers and maintenance companies offer well testing programs. Be cautious of in-line impeller style flow meters. Most impeller style flow meters require annual calibration to be accurate—misinformation can be worse than a guess.
A good indication the water supply flow is not what the system was designed for is when the pressure at the pivot point is greater than 10 % different than your sprinkler package specification when all of the sprinklers and the endgun on. If you utilize sprinkler pressure regulators, your pressure should be at least 5-10 lbs. greater, with the end gun on, than the regulator operating pressure at the pivot point and just above the regulator operating pressure at the last sprinkler. See the explanation in the sprinkler chart design for details.
Compare actual application to the application chart – One of the surprising things we found doing uniformity can tests and flow testing is that about 2/3 of systems evaluated applied less water than they were designed for. Accurate applications are dependent upon measurements of water flow to the distribution system and control of the pivot or traveler’s speed. By timing a complete run of a circle and comparing to the system application chart, you can identify problems. The center pivot percent timer tends to be less accurate at low settings (below 10 %). With larger systems being installed, and the switch to high-speed pivot drives, many irrigation applications are at these lower settings.
Check irrigation controls – Test the function of all the major control and interlock systems. Check center pivot end gun switches, stop-in slot or park, cornering arm valve controls, and pump interlock systems.
Stop barricades - Pivots that make partial circles often use stop barricades at the edge of the water area. Check stops for integrity, making sure that the height is still appropriate for the machine’s turnoff mechanism. Newer style stop barricades are designed to catch and spin the tire against the barricade allowing the last tower safety timer to shut the pivot down as a backup safety system. Tire skid marks on the barricade indicates the primary stop switch has failed and needs replacing.
Make the most of irrigated fields yield maps - GPS yield mapping has tremendous potential for improving irrigation design, maintenance and management. If you had a period of drought this summer, the yield data and map will have even greater importance. Normal rainfall will mask many of the irrigation issues in most years.
Make a special effort to calibrate your yield sensor before harvesting irrigated fields and save the data back to a safe place before shutting the yield monitoring system down at the end of the day. Note areas in the field that have significant low or highs yields at harvesting and look for any obvious explanation while still in the field. After harvest find the GPS locations of center points of pivots, wheel paths or traveler lanes, and double-watered areas. Most mapping programs will allow you to draw in the pivot point and pivot wheel rings allowing you to compare yield under each span.
If you do not enjoy the computer part of yield mapping, consider paying one of many services or consultants to help you. Finding irrigation equipment design or malfunctions can have a long-lasting benefit. A beginning step is to compare an aerial photo where you can identify the irrigation system with the yield map and see what jumps out at you.
Check your irrigated and non-irrigated yields – Now is the time to lay out the plan for future irrigation investments. Due to higher input costs, it is harder to survive a drought year without irrigation. Gather the data needed to decide where future irrigation investments are warranted.
Review the repair and needed improvement list and consider buying new – In most situations, the cost of needed repairs and improvements are small compared to the price of a new system. For systems covering large acreage or on crops of great importance it may be better to replace them before a mid-summer catastrophe. Often the old equipment is recycled into a few small field or dry corner machines if they still have useable life left.
Purdue Cooperative Extension Service
Purdue Extension Entomology
901 W. State Street
West Lafayette, IN, 47907
(765) 494-8761
luck@purdue.edu
@PurdueExtEnt
PurdueEntomology
If you would like to be alerted by e-mail when the current issue of the Pest&Crop is available on-line, please enter your e-mail address and click the submit button.
It is the policy of the Purdue University Cooperative Extension Service that all persons have equal opportunity and access to its educational programs, services, activities, and facilities without regard to race, religion, color, sex, age, national origin or ancestry, marital status, parental status, sexual orientation, disability or status as a veteran. Purdue University is an Affirmative Action institution. This material may be available in alternative formats.