Pest & Crop
Newsletter
Purdue Cooperative Extension Service
Purdue Cooperative Extension Service
Issue 19, August 12, 2016 • USDA-NIFA Extension IPM Grant
CLICK HERE FOR A PDF VERSION OF THIS ISSUE ![]()
The "dog days of August" are upon us with warm and uncomfortably muggy days accompanied by warm and uncomfortably muggy nights. Invariably, conversations down at the local cafe over coffee or the neighborhood tavern over a few beers turn to the inevitable belief that "...these warm nights simply cannot be good for the corn crop."
One of the concerns often expressed relative to warm nights during the grain fill period is that excessively warm nighttime temperatures result in excessively high rates of maintenance respiration by plants. That physiological process oxidizes photosynthetic sugars and provides energy for the maintenance and repair of plant cell tissue, which helps the photosynthetic "factory" continue to operate efficiently.
Excessive rates of maintenance respiration, in response to excessively warm nighttime temperatures, are thought to wastefully "use up" photosynthetic sugars that would otherwise be available as photoassimilate for use by the developing kernels. While the relationship between temperature and the rate of maintenance respiration is well documented, the practical significance of excessive maintenance respiration rates to a full-size corn crop during the grain fill period is not well documented in the research literature.
Perhaps more importantly, warmer temperatures from pollination to kernel maturity increase the calendar rate of crop development (how fast the crop moves through the grain filling stages). Consequently, the number of days in the grain fill period decreases and kernel maturity occurs earlier with warmer temperatures than with cooler temperatures. It is also true that warmer temperatures increase the photosynthetic rate (amount of photosynthetic sugars produced per day), but it appears that shorter grain fill duration trumps faster photosynthetic rate and so yield tends to decrease with warmer grain fill periods.
Another consideration with grain fill periods that are warmer than usual AND muggy is that such weather conditions are conducive for the development of several important foliar corn diseases, including gray leaf spot (Cercospora zeae-maydis). Severe outbreaks of such diseases early in the grain filling period can destroy significant amounts of the "solar capture components" (i.e., leaves) of the photosynthetic "factory", resulting in significantly less production of photosynthetic sugars, which translates into yield loss.
Having said all that, does history support the belief that "...these warm nights simply cannot be good for the corn crop?" Considering that July and August by and large represent the bulk of the grain fill period for corn in Indiana year in and year out, that time period merits a look to see whether there is a strong relationship between statewide temperature deviations and grain yield.
Figure 1 illustrates that relationship for statewide departures in July & August temperature and statewide grain yields for the period 1994 through 2015. Five of those years represented record-setting or near record grain yields and three represented very poor corn years with statewide yields more than 10% below trend, including the 2012 drought year when statewide corn yield was nearly 38% below trend. All the other years represent statewide corn yields with single-digit departures from trend.
There is a reasonable relationship between these departures in temperature and departures in yield. In general, cooler July and August grain fill periods tend to result in above average statewide corn yields and vice versa for warmer than normal July & August grain fill periods. However, temperature departures from normal only account for about 38% of the annual variability in statewide grain yields.
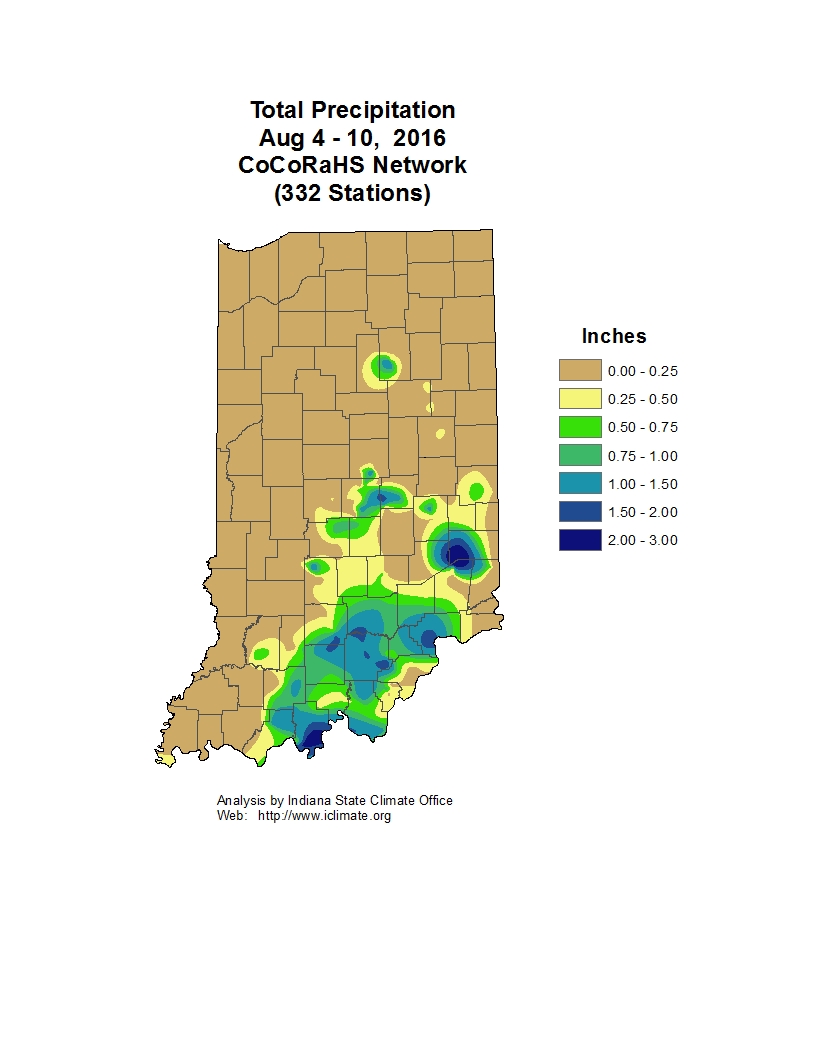
Obviously, rainfall during the grain fill period is also important in determining grain yield. Figure 2 illustrates the relationship for statewide departures in July & August rainfall and statewide grain yields for the period 1994 through 2015. While the nature of the relationship is what one would expect (rain makes grain), it is not a very strong one. Rainfall departures from normal only account for about 13% of the annual variability in statewide grain yields.
Figure 3 illustrates the relationship between statewide grain yield and a simple index that combines the temperature and rainfall departures. The graph basically reinforces what we expect: Cooler and wetter July & August grain fill periods tend to have above average statewide corn yields and vice versa for warmer and drier July & August grain fill periods.
So, where does this discussion leave us relative to the 2016 Indiana corn crop? After all, statewide corn crop condition ratings throughout the season have been consistently strong, averaging more than 70% "good" to "excellent" in USDA-NASS parlance (USDA-NASS, 2016b).
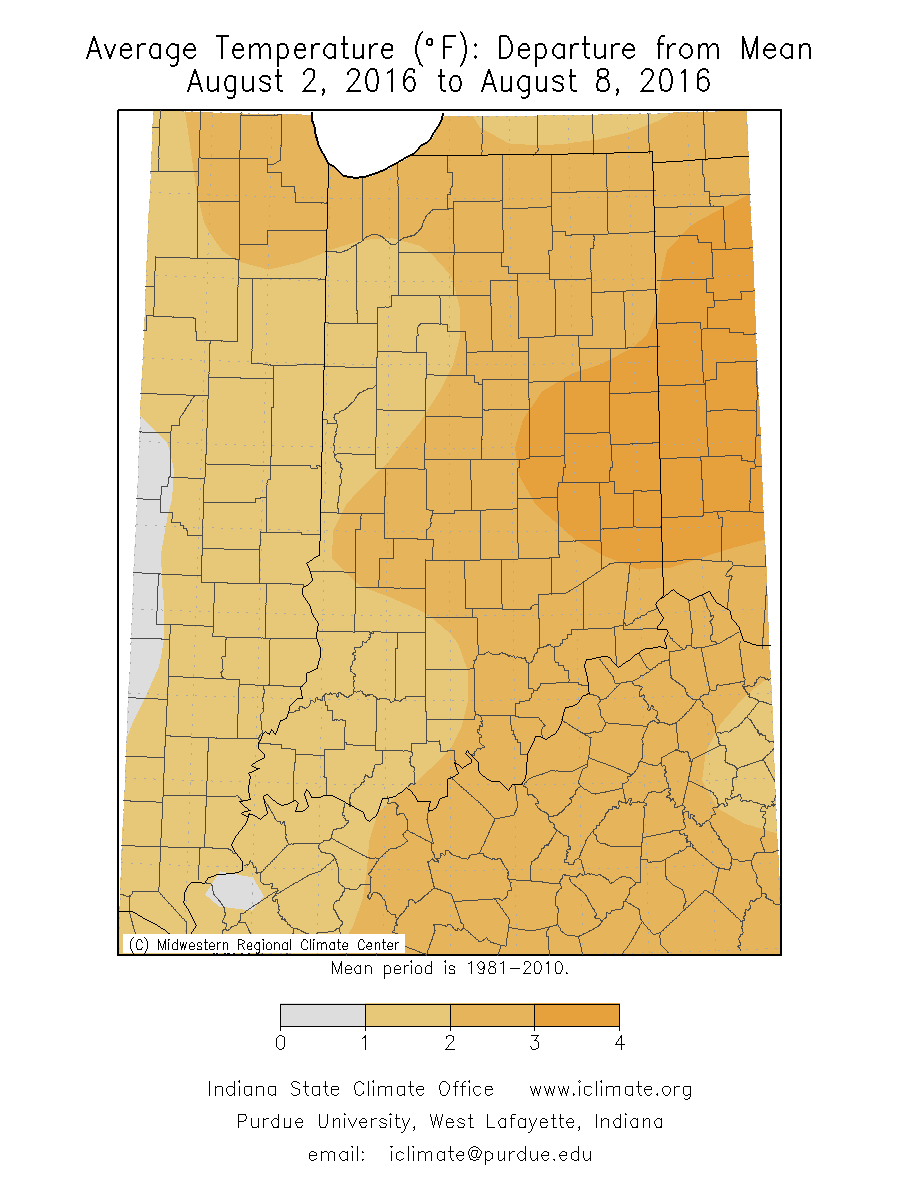
Statewide temperatures for July were slightly cooler than average and rainfall slightly above average (MRCC, 2016), both of which are positive for yield prospects. The exceptions to the positive rainfall data are those areas of northeast Indiana that were drier than average.
August to date has been 1 to 3°F warmer than normal across the state and, more importantly, zero to 50% of normal rainfall has occurred for the northern two-thirds of the state (MRCC, 2016). Neither climate departures are favorable for finishing a corn crop strongly.
The corn crop statewide is certainly poised to finish with statewide yields above trend. The question lies mostly with "how much" above trend. The answer lies mainly with what happens weather-wise the remainder of the grain filling period.
Midwestern Regional Climate Center (MRCC). 2016. http://mrcc.isws.illinois.edu [URL accessed Aug 2016].
Nielsen, RL (Bob). 2016. Grain Fill Stages in Corn. Corny News Network, Purdue Extension. http://www.kingcorn.org/news/timeless/GrainFill.html [URL accessed Aug 2016].
USDA-NASS. 2016a. Crop Production Annual Summary. United States Dept Agriculture, National Agricultural Statistics Service. http://usda.mannlib.cornell.edu/MannUsda/viewDocumentInfo.do?documentID=1047 [URL accessed Aug 2016].
USDA-NASS. 2016b. Crop Progress. United States Dept Agriculture, National Agricultural Statistics Service. http://usda.mannlib.cornell.edu/MannUsda/viewDocumentInfo.do?documentID=1048 [URL accessed Aug 2016].
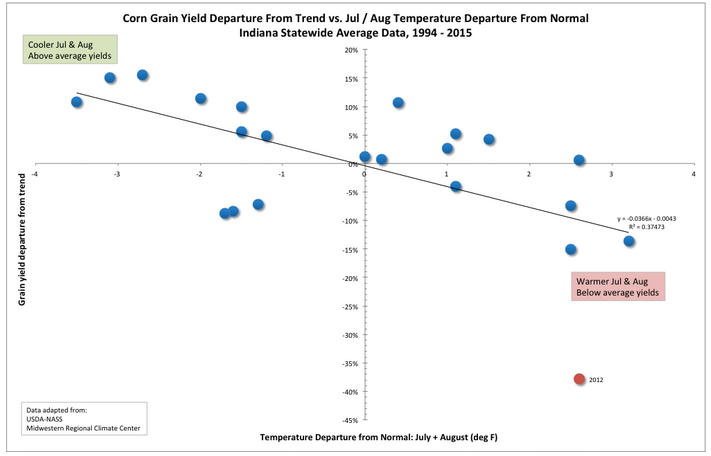
Figure 1. Corn grain yield departure from trend vs. July/Aug temperature departure from normal Indiana statewide average data, 1994-2015.
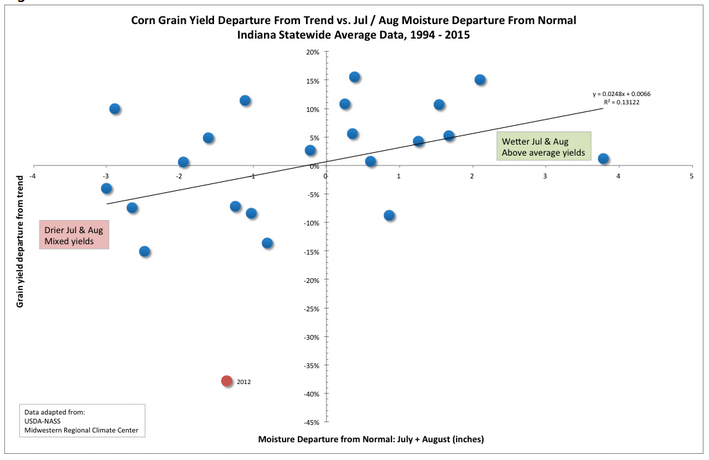
Figure 2. Corn grain yield departure from trend vs. July/Aug moisture departure from normal Indiana statewide average data, 1994-2015.
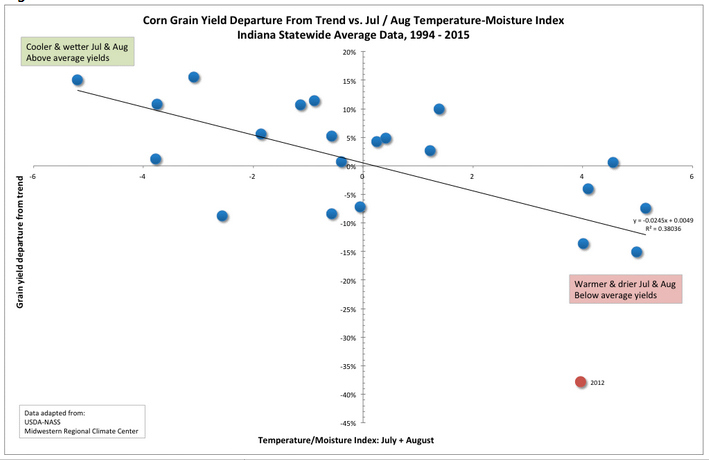
Figure 3. Corn grain yield departure from trend vs. July/Aug temperature-moisture index from normal Indiana statewide average data, 1994-2015.
Fancy colored yield maps are fine for verifying grain yields at the end of the harvest season, but bragging rights for the highest corn yields are established earlier than that down at the Main Street Cafe, on the corner of 5th and Earl. Some patrons of the cafe begin "eyeballing" their yields as soon as their crops reach "roasting ear" stage. Some of the guys there are pretty good (or just plain lucky) at estimating yields prior to harvest, while the estimates by others are not even close to being within the proverbial ballpark. Interestingly, they all use the same procedure referred to as the Yield Component Method.
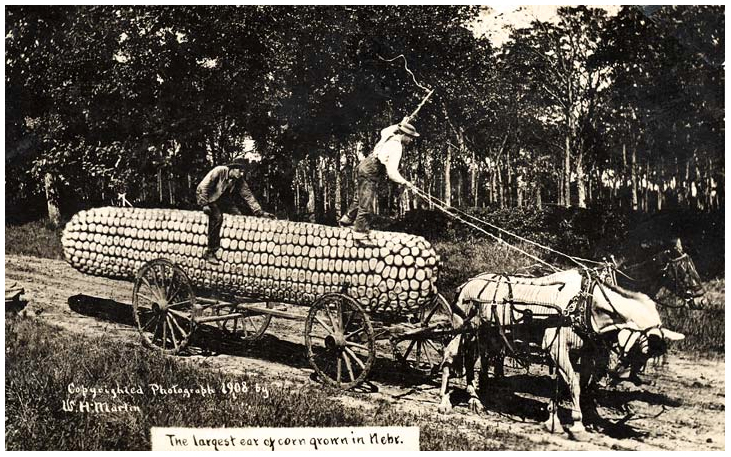
Figure 1. Largest ear of corn in Nebraska, ca. 1908. Courtesy of the Nebraska Historical Society.
Other pre-harvest yield prediction methods exist (Lauer, 2002; Lee & Herbek, 2005; Thomison, 2015), but the Yield Component Method is probably the most popular because it can be used well ahead of harvest; as early as the so-called "roasting ear" or milk (R3) stage of kernel development. Under “normal” conditions, the kernel milk stage occurs about 18 to 22 days after pollination is complete (Nielsen, 2016). Estimates made earlier in the kernel development period risk being overly optimistic if subsequent severe stresses cause unforeseen kernel abortion (Nielsen, 2013).
The Yield Component Method was originally described by the University of Illinois many years ago and is based on the premise that one can estimate grain yield from estimates of the yield components that constitute grain yield. These yield components include number of ears per acre, number of kernel rows per ear, number of kernels per row, and weight per kernel. The first three yield components (ear number, kernel rows, kernels/row) are easily measured in the field.
Final weight per kernel obviously cannot be measured until the grain is mature (kernel black layer) and, technically, at a grain moisture of 15% since that is the typical moisture value used to determine a 56-lb market bushel. Consequently, an average value for kernel weight is used as a proverbial "fudge factor" in the yield estimation equation. As first described many years ago, the equation originally used a "fudge factor" of 90, which represented 90,000 kernels per 56-lb bushel. In terms of how kernel weight is usually measured in research, this would be equal to about 282 grams per 1000 kernels.
Be aware that actual kernel numbers per 56-lb bushel among years or fields within years can vary significantly and is influenced by both growing conditions and hybrid genetics. Kernel weight among hybrids can easily vary from less than 65,000 kernels per 56-lb bushel to more than 100,000 kernels per 56-lb bushel. Kernel weight from year to year for the same hybrid can easily vary by 20,000 kernels per bushel or more simply due to variability in growing conditions during the grain filling period.
Crop uniformity also influences the accuracy of any yield estimation technique. The less uniform the field, the greater the number of samples that should be taken to estimate yield for the field. There is a fine line between fairly sampling disparate areas of the field and sampling randomly within a field so as not to unfairly bias the yield estimates up or down.
TIP:
For other row spacings, divide 43,560 by the row spacing (in feet) and then divide that result by 1000 (e.g., [43,560 / 2.5] / 1000 = 17.4 ft).TIP:
Do not count dropped ears or those on severely lodged plants unless you are confident that the combine header will be able to retrieve them.TIPS:
Do not sample nubbins or obviously odd ears, unless they fairly represent the sample area. If row number changes from butt to tip (e.g., pinched ears due to stress), estimate an average row number for the ear. Don't count the extreme butt or tip kernels, but rather begin and end where you perceive there are complete "rings" of kernels around the cob. Do not count aborted kernels. If kernel numbers per row are uneven among the rows of an ear, estimate an average value for kernel number per row.EXAMPLE:
For five sample ears with 480, 500, 450, 600, and 525 kernels per ear, the average number of kernels per ear would be (480 + 500 + 450 + 600 + 525) divided by 5 = 511.Example:
Let's say you counted 30 harvestable ears at the first thousandth-acre sampling site. Let's also assume that the average number of kernels per ear, based on sampling every 5th ear in the sampling row, was 511. Using "fudge factor" values of 75, 85, and 95; the estimated range in yield for that sampled site would (30 x 511) divided by 75 = 204, or divided by 85 = 180, or divided by 95 = 161 bushels per acre.Repeat the procedure throughout field as many times as you deem to be representative. Tally and average the results separately for each "fudge factor" used for the calculations.
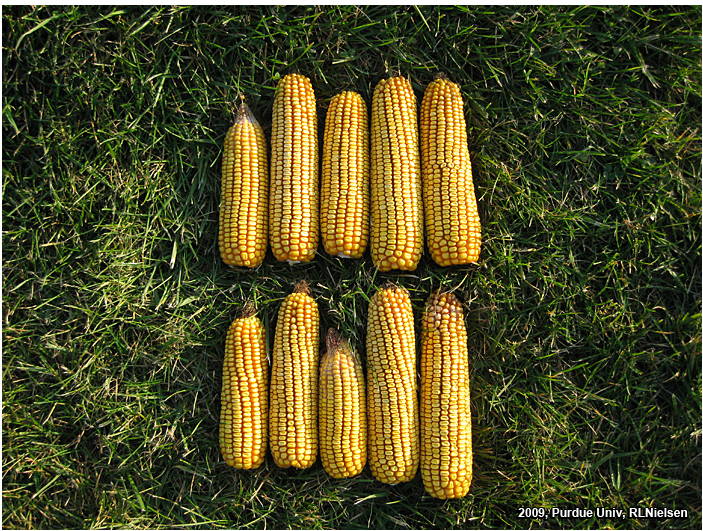
Figure 2. Random sample of ears.
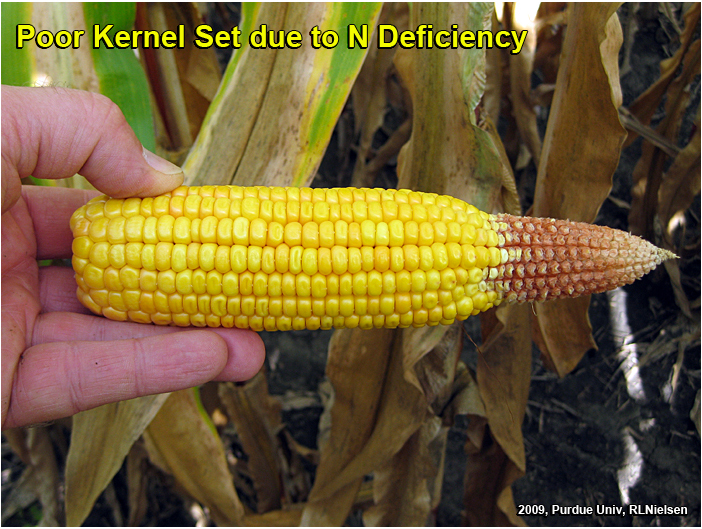
Figure 3. Poor tip fill due to N deficiency.
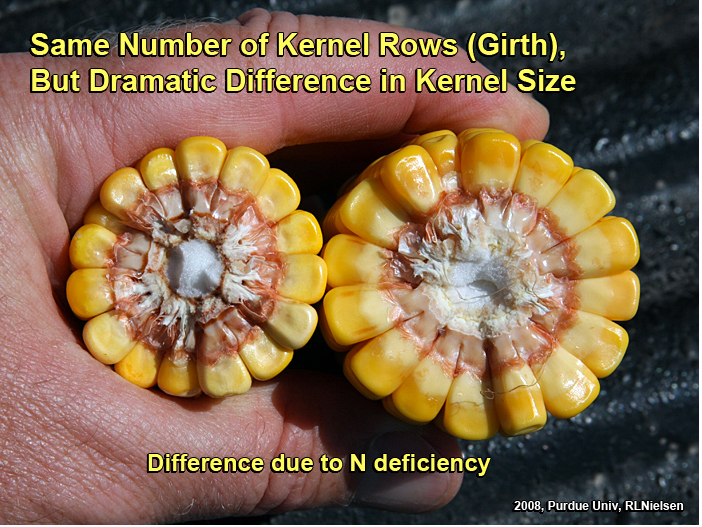
Figure 4. Kernel size differences due to N deficiency.
Remember that this method for estimating pre-harvest grain yield in corn indeed provides only an estimate. Since kernel size and weight will vary depending on hybrid and environment, this yield estimator should only be used to determine “ballpark” grain yields. Yield can easily be overestimated in a year with poor grain fill conditions (e.g., low kernel size and weight from a drought year) and underestimated in a year with excellent grain fill conditions (e.g., larger kernel size and weight from non-stress grain fill periods).
Recognize that the Yield Component Method for estimating corn grain yield is probably only accurate within plus or minus 20 bushels of the actual yield. Obviously, the more ears you sample within a field, the more accurately you will "capture" the variability of yield throughout the field. Use the yield estimates obtained by this method for general planning purposes only.
There are a number of apps available for download to your smart phone or mobile tablet that can be used to simplify the calculations of the Yield Component Method. Some crop scouting apps include grain yield estimators as one of their features. Be sure to thoroughly test the calculations of any app you choose to use on your phone to ensure that the math is correct. Some offer multiple kernel "fudge factors", but do not literally specify what kernel numbers per 56-lb bushel they use. Some only allow you to sample 3 ears at a time. Most do not allow you to sample AND save the results of multiple sites within a field or multiple fields in an operation. As the old adage says... "Buyer beware!"
This curmudgeon prefers to do the math the old-fashioned way... with my smart phone calculator and a note pad.
The Pro Farmer division of Farm Journal Media sponsors an annual Midwest Crop Tour that sends out teams of "scouts" to visit corn fields throughout the Midwest to estimate yields. The method used in that effort is a variation of one described years ago by University of Minnesota agronomist Dale Hicks (now Professor Emeritus) that combines the use of several yield components (ears per acre and kernel rows per ear) with a measurement of ear length (a proxy for kernel number per row).
The focus of the crop tour is not to necessarily estimate the yields of specific fields, but rather to more broadly estimate the yield potential within regions of the Midwest, so one probably should exercise caution in using this method for estimating yields within an individual field. Nevertheless, folks who have heard about the Pro Farmer Tour may be interested in trying the method themselves, so here are the steps involved with the Pro Farmer method (Flory, 2010; Mick, 2013). I would certainly suggest that these steps be repeated in several areas of an individual field because of natural spatial variability for yield.
Example:
30 inchesTip:
For subsequent yield estimates within the field, I would suggest walking even further into the field and crossing over multiple planter passes to sample different areas of the field.Example:
(42 ears in one row + 45 ears in other row) divided by 2 = 43.5Tip:
Frankly, I would suggest harvesting up to 5 ears from each of the two adjacent rows to better sample the area and minimize the effect that one oddball ear could have on the calculated average ear lengths and kernel row numbers.Example:
(6 inches + 7 inches + 5 inches) divided by 3 = 6Example:
(16 rows + 14 rows + 16 rows) divided by 3 = 15.3Example:
(43.5 ears x 6 inches x 15.3 rows) divided by 30-inch rows = 133 bu/ac yield estimateFlory, Chip. 2010. Crop Tour Insider. Pro Farmer, Farm Journal Media. [Originally online, but no longer accessible. See Mick, 2013].
Lauer, Joe. 2002. Methods for Calculating Corn Yield. Agronomy Advice, Univ. of Wisconsin-Madison. Online at http://corn.agronomy.wisc.edu/AA/pdfs/A033.pdf [URL accessed Aug 2016].
Lee, Chad and Jim Herbek. 2005. Estimating Corn Yields (AGR-187). Univ. of Kentucky. Online at http://www.ca.uky.edu/agc/pubs/agr/agr187/agr187.pdf. [URL accessed Aug 2016].
Mick, Katie. 2013. How the Crop Tour Arrives at Yield Estimates. DTN/Progressive Farmer. http://goo.gl/ADmbYt [URL accessed Aug 2016].
Nielsen, R.L. (Bob). 2011. Kernel Set Scuttlebutt. Corny News Network, Purdue Univ. Online at http://www.kingcorn.org/news/timeless/KernelSet.html [URL accessed Aug 2016].
Nielsen, RL (Bob). 2012. Opportunities to Assess Yield Potential of Drought-Stressed Corn. Corny News Network, Purdue Extension. Online at http://www.kingcorn.org/news/articles.12/YldAssessment-0727.html [URL accessed Aug 2016].
Nielsen, R.L. (Bob). 2013. Effects of Stress During Grain Filling in Corn. Corny News Network, Purdue Univ. Online at http://www.kingcorn.org/news/timeless/GrainFillStress.html [URL accessed Aug 2016].
Nielsen, R.L. (Bob). 2016. Grain Fill Stages in Corn. Corny News Network, Purdue Univ. Online at http://www.kingcorn.org/news/timeless/GrainFill.html [URL accessed Aug 2016].
Thomison, Peter. 2015. Estimating Corn Yields . C.O.R.N. Newsletter, Ohio State Univ. Online at http://agcrops.osu.edu/newsletter/corn-newsletter/2015-25/estimating-corn-yields [URL accessed Aug 2016].
We have received a few reports from northern counties, primarily sandy soils, of Western Bean Cutworm feeding. This isn’t unusual; we do get similar reports from that region every year. However, this year it seems that the feeding on traited corn is more prevalent. Recall that the larvae must feed on the corn to get exposure to the Bt protein, which works on the lining of their stomach. However, in past years this feeding is been confined to grazing on the tops of a few kernels, the larvae then die before getting into the larger, later stages. The reports we've heard this year indicate that the larvae are larger and seem to be feeding more deeply in the ears.
Egg-laying peaked about a month ago, and WBC larvae have now made their way from leaf axils into the corn ears, so treatment with foliar sprays is no longer an option. However, it’s wise to check on fields now, even in traited hybrids, so that the degree of damage and feeding can be assessed. The reason is that although you can’t kill the caterpillars, the real worry with Western Bean Cutworm is the potential for ear rots – these pests and their feeding have been shown to pre-dispose damaged ears to Gibberella ear rot. This disease, and the toxin it produces in grain, is a serious issue for producers of corn, especially if used for animal feed.
If you have damage in corn that is labeled for WBC control, the first thing to do is use check strips to determine if the hybrid is indeed producing the toxin. Recall that there are refuge plants scattered throughout the field in SmartStax planting, and those plants have no WBC protection. Heavy damage on plants expressing a WBC-active trait is reason for concern and follow-up with your seed supplier.
In the meantime, keep enjoying the hover fly plague! Happy scouting!
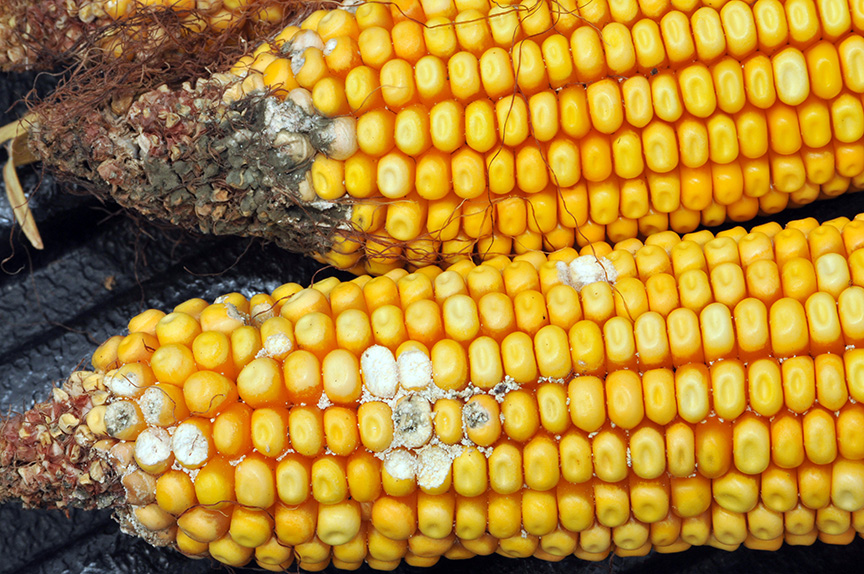
Traited corn ears damaged by western bean cutworm.
| County | Cooperator | WBC Trapped | ||||||
|---|---|---|---|---|---|---|---|---|
| Week 1 6/23/16 - 6/29/16 |
Week 2 6/30/16-7/6/16 |
Week 3 7/7/16-7/13/16 |
Week 4 7/14/16-7/20/16 |
Week 5 7/21/16-7/27/16 |
Week 6 7/28/16-8/3/16 |
Week 7 8/4/16-8/10/16 |
||
| Adams | Kaminsky/New Era Ag | 0 | 3 | 3 | 1 | 1 | 0 | 0 |
| Adams | Roe/Mercer Landmark | 0 | 0 | 4 | 7 | 2 | 0 | 0 |
| Allen | Anderson/Syngenta Seed | 0 | 0 | 0 | 0 | 0 | 0 | 1 |
| Allen | Gynn/Southwind Farms | 0 | 0 | 15 | 28 | 4 | 12 | 3 |
| Allen | Kneubuhler/G&K Concepts | 1 | 2 | 1 | 6 | 9 | 0 | |
| Bartholomew | Bush/Pioneer Hybrids | 0 | 1 | 0 | 0 | 0 | 0 | |
| Clay | Bower/Ceres Solutions/Brazil | 0 | 0 | 0 | 0 | 0 | 0 | 0 |
| Clay | Bower/Ceres Solutions/Bowling Green | 0 | 0 | 0 | 0 | 0 | 0 | 0 |
| Clay | Bower/Ceres Solutions/Clay City | 0 | lost trap | 0 | 0 | 0 | 0 | 0 |
| Clay | Bower/Ceres Solutions/Clinton | 0 | 0 | 0 | 0 | 0 | 0 | 0 |
| Clinton | Emanuel/Boone Co. CES | 0 | 0 | 0 | 4 | 1 | 1 | 1 |
| Clinton | Foster/Purdue Entomology | 0 | 0 | 2 | 2 | 0 | 0 | 1 |
| DeKalb | Hoffman/ATA Solutions | 0 | 0 | 0 | 60 | 77 | 29 | 1 |
| Dubois | Eck/Purdue CES | 1 | 0 | 0 | 0 | 0 | 0 | 3 |
| Elkhart | Barry/Helena-Goshen | 6 | 8 | 50 | 36 | 18 | 4 | 1 |
| Elkhart | Kauffman/Crop Tech Inc. | 9 | 58 | 100 | 75 | 180 | 47 | 9 |
| Fayette | Schelle/Falmouth Farm Supply Inc. | 0 | 0 | 2 | 0 | |||
| Fountain | Mroczkiewicz/Syngenta | 8 | 29 | 18 | 13 | 3 | 1 | 0 |
| Fulton | Jenkins/N. Central Coop-Rochester | 0 | 23 | 50 | 23 | 23 | 0 | 0 |
| Fulton | Jenkins/N. Central Coop-Kewana | 2 | 91 | 122 | 130 | 28 | 2 | 5 |
| Gibson | Schmitz/Gibson Co. CES | 0 | 0 | 0 | 0 | 0 | 0 | 0 |
| Hamilton | Campbell/Beck's Hybrids | 1 | 8 | 0 | 0 | 0 | 0 | 0 |
| Hamilton | Truster/Reynolds Farm Equipment | 0 | 0 | 0 | 0 | 0 | 0 | 0 |
| Hendricks | Nicholson/Nicholson Consulting | 0 | 3 | 3 | 1 | 1 | 0 | 0 |
| Jasper | Overstreet/Purdue CES | 6 | 20 | 50 | 118 | 69 | 0 | 1 |
| Jasper | Ritter/Brodbeck Seeds | 0 | 112 | 87 | 52 | 4 | ||
| Jay | Boyer/Davis PAC | 0 | 3 | 1 | 0 | 0 | 0 | |
| Jay | Shrack/Ran Del Agri Services | 0 | 0 | 0 | 0 | 0 | 1 | 0 |
| Jay | Temple/Pennyville | 1 | 0 | 0 | 3 | 0 | ||
| Jay | Temple/RedKey | 2 | 0 | 0 | 1 | 3 | ||
| Jennings | Bauerle/SEPAC | 0 | 1 | 0 | 1 | 0 | 2 | 0 |
| Knox | Bower/Ceres Solutions/Vincennes | 0 | 0 | 0 | 0 | 0 | 0 | 0 |
| Knox | Bower/Ceres Solutions/Frichton | 0 | 0 | 0 | 0 | 0 | 0 | 0 |
| Lake | Kleine/Kleine Farms | 6 | 12 | 11 | 9 | 3 | 3 | 1 |
| Lake | Moyer/Dekalb Hybrids, Shelby | 25 | 93 | 103 | 418 | 32 | 4 | |
| Lake | Moyer/Dekalb Hybrids, Schneider | 19 | 156 | 219 | 369 | 58 | 12 | |
| LaPorte | Rocke/Agri-Mgmt Solutions, Wanatah | 50 | 120 | 158 | 157 | 65 | 23 | 2 |
| Madison | Truster/Reynolds Farm Equip. | 0 | 1 | 0 | 3 | 0 | 0 | 0 |
| Miami | Early/Pioneer Hybrids | 2 | 88 | 94 | 47 | 11 | 0 | 0 |
| Newton | Moyer/Dekalb Hybrids, Lake Village | 39 | 263 | 309 | 454 | 121 | 1 | |
| Porter | Leuck/PPAC | 3 | 9 | 40 | 146 | 26 | 2 | 1 |
| Pulaski | Capouch/M&R Ag Services | 1 | 4 | 6 | 120 | 42 | 8 | 0 |
| Putnam | Nicholson/Nicholson Consulting | 0 | 0 | 2 | 0 | 0 | 0 | 0 |
| Randolph | Boyer/DPAC | 0 | 2 | 0 | 1 | 2 | 0 | 3 |
| Rush | Schelle/Falmouth Farm Supply Inc. | 0 | 0 | 0 | 0 | |||
| Shelby | Fisher/Shelby Co. Co-Op | 0 | 0 | 0 | 1 | 1 | 1 | 0 |
| Shelby | Simpson/Simpson Farms | 0 | 0 | 0 | 0 | 0 | 0 | 0 |
| Sullivan | Bower/Ceres Solutions/Farmersburg | 0 | 0 | 2 | 1 | 0 | 0 | 0 |
| Sullivan | Bower/Ceres Solutions/Sullivan | 0 | 3 | 3 | 1 | 1 | 0 | 0 |
| Tippecanoe | Bower/Ceres Solutions | 5 | 15 | 26 | 3 | 2 | 0 | 0 |
| Tippecanoe | Nagel/Ceres Solutions | 0 | 7 | 20 | 10 | 0 | 0 | 0 |
| Tippecanoe | Obermeyer/Purdue Entomology | 0 | 1 | 2 | 1 | 0 | 0 | 0 |
| Tippecanoe | Westerfeld/Monsanto | 0 | 5 | 5 | 4 | 4 | 1 | 1 |
| Tipton | Campbell/Beck's Hybrids | 0 | 0 | 1 | 0 | 0 | 0 | |
| Whitley | Walker/NEPAC | 1 | 8 | 61 | 87 | 41 | 5 | |
Corn Earworm Trap Report
Purdue Cooperative Extension Service
Purdue Extension Entomology
901 W. State Street
West Lafayette, IN, 47907
(765) 494-8761
luck@purdue.edu
@PurdueExtEnt
PurdueEntomology
![]()
If you would like to be alerted by e-mail when the current issue of the Pest&Crop is available on-line, please enter your e-mail address and click the submit button.
It is the policy of the Purdue University Cooperative Extension Service that all persons have equal opportunity and access to its educational programs, services, activities, and facilities without regard to race, religion, color, sex, age, national origin or ancestry, marital status, parental status, sexual orientation, disability or status as a veteran. Purdue University is an Affirmative Action institution. This material may be available in alternative formats.