Pest & Crop
Newsletter
Purdue Cooperative Extension Service
Purdue Cooperative Extension Service
Issue 18, August 5, 2016 • USDA-NIFA Extension IPM Grant
CLICK HERE FOR A PDF VERSION OF THIS ISSUE ![]()
Over the last couple of weeks, we’ve received many out-of-focus pictures and videos of multitudes of looping worms crawling over spray equipment that has recently been through corn fields. Many questions followed: “What are these creepy things?” “Were they eating the corn?” “Should we kill them?” “Are they edible?” These “worms” are actually maggots – fly larvae. The only maggots found in cornfields this time of the year are syrphid fly larvae. Syrphids are also called hover flies, and are primarily predators of soft-bodied insects, especially aphids. However, the ones that have been common this year (genus Toxomerus) get their protein not from aphids, but from corn pollen. They tend to feed in leaf axils and other areas where pollen collects. They are not pests, and are really only feeding on “surplus” pollen that does not land on silks and pollinate corn. Pollination is now largely complete in Indiana corn, and each corn plant produces many thousands of pollen grains more than it needs, so these maggots are taking advantage of an under-utilized protein source.
We have also received, and experienced first-hand, additional reports of large numbers of hover flies in and around cornfields. These are the adult form of the maggots, and if reports this week are any indication, there are many more to come. Hover flies are bee and wasp mimics and are often orange, black or yellow with banding patterns – this helps protect them from predators that confuse them with more hostile and hazardous insects. The species we are talking about here, Toxomerus, looks like a tiny yellowjacket wasp. They cannot sting and are harmless. Sweat bees, on the other hand, are actually bees and have stingers. They are smaller and are typically dark or metallic in color. Both hover flies and sweat bees can be a minor nuisance. They are attracted to us by moisture and salts they get by lapping up our sweat. Sweat bees will sting if we accidently squish/swat them on our skin while they are feeding. However, they are sometimes cruel and will sting even when they are not bothered at all.
To sum up, the maggots in corn are not a concern. They are not really a pest, nor are they beneficial. Like the vast majority of insects, they are neutral for us humans – they’re just out doing their thing. The recent spike in numbers over the last couple of seasons is a bit of a mystery, but nothing to be concerned about. So during some upcoming field days, impress wagon loads of attendees with your knowledge of hover flies and sweat bees. Just make sure you know the difference before trying to catch one.

Close-up of Syrphid (hover fly) larvae (Photo Credit: Kyle Ross).
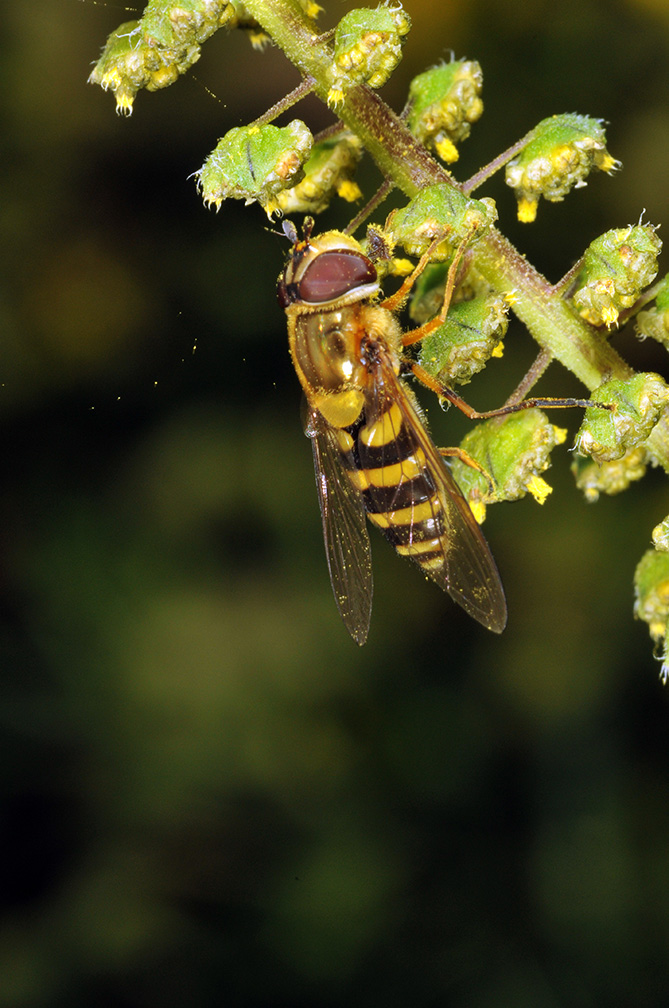
Syrphid fly (hover fly) feeding on weed pollen.
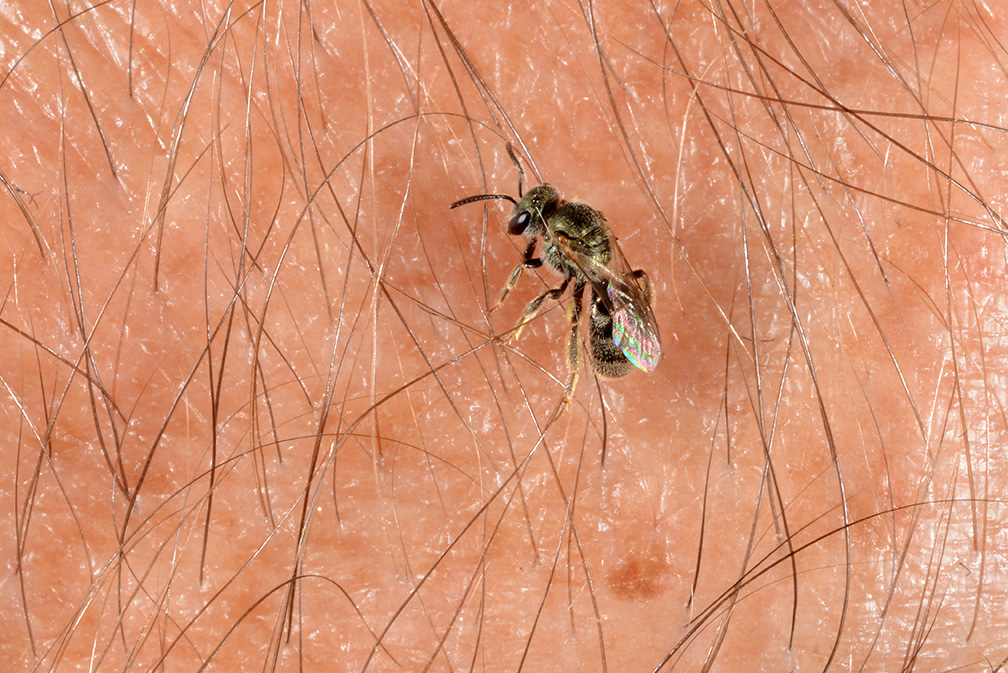
Sweat bee on skin.
| County | Cooperator | WBC Trapped | ||||||
|---|---|---|---|---|---|---|---|---|
| Week 1 6/23/16 - 6/29/16 |
Week 2 6/30/16-7/6/16 |
Week 3 7/7/16-7/13/16 |
Week 4 7/14/16-7/20/16 |
Week 5 7/20/16-7/27/16 |
Week 6 7/28/16-8/3/16 |
|||
| Adams | Kaminsky/New Era Ag | 0 | 3 | 3 | 1 | 1 | 0 | |
| Adams | Roe/Mercer Landmark | 0 | 0 | 4 | 7 | 2 | 0 | |
| Allen | Anderson/Syngenta Seed | 0 | 0 | 0 | 0 | 0 | 0 | |
| Allen | Gynn/Southwind Farms | 0 | 0 | 15 | 28 | 4 | 12 | |
| Allen | Kneubuhler/G&K Concepts | 1 | 2 | 1 | 6 | 9 | 0 | |
| Bartholomew | Bush/Pioneer Hybrids | 0 | 1 | 0 | 0 | 0 | 0 | |
| Clay | Bower/Ceres Solutions/Brazil | 0 | 0 | 0 | 0 | 0 | ||
| Clay | Bower/Ceres Solutions/Bowling Green | 0 | 0 | 0 | 0 | 0 | ||
| Clay | Bower/Ceres Solutions/Clay City | 0 | lost trap | 0 | 0 | 0 | ||
| Clay | Bower/Ceres Solutions/Clinton | 0 | 0 | 0 | 0 | 0 | ||
| Clinton | Emanuel/Boone Co. CES | 0 | 0 | 0 | 4 | 1 | 1 | |
| Clinton | Foster/Purdue Entomology | 0 | 0 | 2 | 2 | 0 | 0 | |
| DeKalb | Hoffman/ATA Solutions | 0 | 0 | 0 | 60 | 77 | 29 | |
| Dubois | Eck/Purdue CES | 1 | 0 | 0 | 0 | 0 | 0 | |
| Elkhart | Barry/Helena-Goshen | 6 | 8 | 50 | 36 | 18 | 4 | |
| Elkhart | Kauffman/Crop Tech Inc. | 9 | 58 | 100 | 75 | 180 | 47 | |
| Fayette | Schelle/Falmouth Farm Supply Inc. | 0 | 0 | 2 | 0 | |||
| Fountain | Mroczkiewicz/Syngenta | 8 | 29 | 18 | 13 | 3 | 1 | |
| Fulton | Jenkins/N. Central Coop-Rochester | 0 | 23 | 50 | 23 | 23 | 0 | |
| Fulton | Jenkins/N. Central Coop-Kewana | 2 | 91 | 122 | 130 | 28 | 2 | |
| Gibson | Schmitz/Gibson Co. CES | 0 | 0 | 0 | 0 | |||
| Hamilton | Campbell/Beck's Hybrids | 1 | 8 | 0 | 0 | 0 | 0 | |
| Hamilton | Truster/Reynolds Farm Equipment | 0 | 0 | 0 | 0 | 0 | 0 | |
| Hendricks | Nicholson/Nicholson Consulting | 0 | 3 | 3 | 1 | 1 | 0 | |
| Jasper | Overstreet/Purdue CES | 6 | 20 | 50 | 118 | 69 | 0 | |
| Jasper | Ritter/Brodbeck Seeds | 0 | 112 | 87 | 52 | 4 | ||
| Jay | Boyer/Davis PAC | 0 | 3 | 1 | 0 | 0 | ||
| Jay | Shrack/Ran Del Agri Services | 0 | 0 | 0 | 0 | 0 | 1 | |
| Jay | Temple/Pennyville | 1 | 0 | 0 | 3 | |||
| Jay | Temple/RedKey | 2 | 0 | 0 | 1 | |||
| Jennings | Bauerle/SEPAC | 0 | 1 | 0 | 1 | 0 | 2 | |
| Knox | Bower/Ceres Solutions/Vincennes | 0 | 0 | 0 | 0 | 0 | ||
| Knox | Bower/Ceres Solutions/Frichton | 0 | 0 | 0 | 0 | 0 | ||
| Lake | Kleine/Kleine Farms | 6 | 12 | 11 | 9 | 3 | 3 | |
| Lake | Moyer/Dekalb Hybrids, Shelby | 25 | 93 | 103 | 418 | 32 | 4 | |
| Lake | Moyer/Dekalb Hybrids, Schneider | 19 | 156 | 219 | 369 | 58 | 12 | |
| LaPorte | Rocke/Agri-Mgmt Solutions, Wanatah | 50 | 120 | 158 | 157 | 65 | ||
| Madison | Truster/Reynolds Farm Equip. | 0 | 1 | 0 | 3 | 0 | 0 | |
| Miami | Early/Pioneer Hybrids | 2 | 88 | 94 | 47 | 11 | 0 | |
| Newton | Moyer/Dekalb Hybrids, Lake Village | 39 | 263 | 309 | 454 | 121 | 1 | |
| Porter | Leuck/PPAC | 3 | 9 | 40 | 146 | 26 | 2 | |
| Pulaski | Capouch/M&R Ag Services | 1 | 4 | 6 | 120 | 42 | ||
| Putnam | Nicholson/Nicholson Consulting | 0 | 0 | 2 | 0 | 0 | ||
| Randolph | Boyer/DPAC | 0 | 2 | 0 | 1 | 2 | 0 | |
| Rush | Schelle/Falmouth Farm Supply Inc. | 0 | 0 | 0 | 0 | |||
| Shelby | Fisher/Shelby Co. Co-Op | 0 | 0 | 0 | 1 | 1 | 1 | |
| Shelby | Simpson/Simpson Farms | 0 | 0 | 0 | 0 | 0 | 0 | |
| Sullivan | Bower/Ceres Solutions/Farmersburg | 0 | 0 | 2 | 1 | 0 | ||
| Sullivan | Bower/Ceres Solutions/Sullivan | 0 | 3 | 3 | 1 | 1 | ||
| Tippecanoe | Bower/Ceres Solutions | 5 | 15 | 26 | 3 | 2 | ||
| Tippecanoe | Nagel/Ceres Solutions | 0 | 7 | 20 | 10 | 0 | 0 | |
| Tippecanoe | Obermeyer/Purdue Entomology | 0 | 1 | 2 | 1 | 0 | 0 | |
| Tippecanoe | Westerfeld/Monsanto | 0 | 5 | 5 | 4 | 4 | 1 | |
| Tipton | Campbell/Beck's Hybrids | 0 | 0 | 1 | 0 | 0 | ||
| Whitley | Walker/NEPAC | 1 | 8 | 61 | 87 | 41 | 5 | |
Corn Earworm Trap Report
Places in the country that have limited water supplies like western Nebraska have found that if you only have a limited water supply, irrigating at R-3 or beginning pod fill stage will give the greatest return for the water used. The second most effective use of water is at pod fill. Most of the irrigated areas of Indiana and Michigan are blessed with ample supplies, but the work on water efficiencies in irrigated soybean in water limited arid areas production can help local growers understand the importance of August irrigation for soybeans.
Most irrigation scheduling programs have soybeans at R-3 stage using 110 to120% of a six-inch grass reference evapotranspiration (rET.), which translates to a need for as much as 2” per week in soybean fields. Dr.Shaun Casteel, Purdue University -Soybean Extension Specialist defines R-3 or beginning pod fill stage as any pod that is about 3/16 inch long and is on one of the four uppermost nodes of the Main stem.
Reference evapotranspiration for an average summer day during early August is 0.19 inches per day or 1.3 inches per week. To convert the rET. to a crop water use, you need to multiply by a crop coefficient value (Kc). The week a soybeans reach R-3 or pod elongation stage it will use 120% of the rET or a Kc of 1.2. That results in a crop ET of about 0.23” a day (1.6” per week) of water use. A cool cloudy week would result in a soybean water use of 1.4” and a hot dry week would result in a water use of 2.0”.
Indiana producers may use data from their own E.T. gauge station or rET data from Purdue’s PAC center weather stations. Then take that number and multiply by 1.2. Multiply that result by 7 (days) and that equals the estimated soybean water use per week
Michigan and Indiana producers in the adjacent counties can have daily rET data sent to them by E-mail or text by signing up for the service at MSU Enviro-Weather website. (https://secure.enviroweather.msu.edu/login.php). Messages are sent at 5:30 AM each day providing rET data for the previous five days and estimates of projected rET for the following 7 days from any of the networks 87 stations. Estimates of rET can also be found by going to the Enviroweather web site at http://www.enviroweather.msu.edu/homeMap.php and following the link to Potential Evapotranspiration and the Water-Use Tool heading.
To make the best use of irrigation water, producers want to try to provide 5 or 6 days’ worth of crop water use per application, typically 0.8” to to 1.0 inches. These larger irrigation applications increase the amount of effective water available to the crop by reducing the water lost by evaporation in the soybean canopy and on the residue and soil surface, about a 0.1” inch per application regardless of the amount applied. A producer making two 0.5” applications provides 0.8” of effective water, compared to a producer making a single 1.0” application that provides 0.9” of effective water. Irrigators with center pivots that apply water faster than the soil can infiltrate are forced to use smaller applications (less than 0.5”) to avoid irrigation runoff.
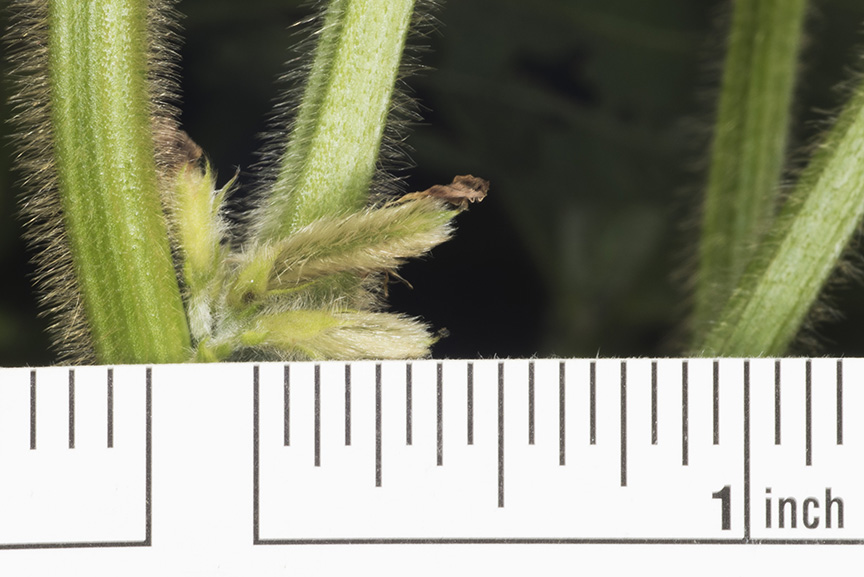
R3 soybean, pod greater than 1/4 inch long at upper four nodes.
By the time that soybeans develop to R-3 stage, the plant has achieved 100% all of its effective rooting of about 2½ feet. A 2½ foot deep reservoir of soil moisture can hold as little as 2.4” on sands to as much as 5.5” on loam soils. Our most typical irrigated soils, sandy loams, hold between 3.2” and 3.8” in 2½ feet of soil. But even with the low capacity of sandy soils well timed 0.8” -1.0” application rarely result in loss of water out the root zone.
You do not need sensors to evaluate soil moisture, although they can help to make it easier to understand how water moves in a given fields soil. The most valuable information can be obtained by simply digging to the depth of the wetted front 12 hours after irrigation. Ideally, at least every other application should wet the soil down to 15” or half the rooting depth on coarse textured soils. At peak water use, soybeans that are inadequately watered will dry out the lower rooting zone to the point that it can reduce nutrient uptake.
Daytime vs. nighttime irrigation water efficiency differences are almost non-measurable in Indiana and Michigan. “The import issue is keeping up with the soybeans plants water needs to avoid stress related yield reductions” says Lyndon Kelley, Irrigation Educator with Michigan State University and Purdue Extension.
Visual signs of water stress in Soybeans occur too late to use as a good irrigation scheduling method without lowering yields. The soybean plant has a natural defense mechanism that rotates the leaves to expose the silver/gray fuzzy side of the leaf to the sunlight reflect more light and reducing water use. During extremely hot days, soybeans may flip their leaves due to the plants inability to pull water fast enough from the soil. A good indication of under watering is when soybean field still appear silver/gray into the evening hours. This symptom in the absence of sunlight driven heat loads indicates moisture stress and will likely reduce potential yield. Compacted areas or sandier parts of field can be monitored for leaf rolling, providing an early warning of the field's moisture status for the rest of the crop.
Many of the irrigation systems in Indiana and Michigan do not have the pumping capacity to keep up with the peak water use of all of the crops grown. That results in the crop drawing down the soil moisture reserves. Irrigation systems that can provide 5 gpm/acre of irrigated land can provide 1” water every 4 days or 0.25”/day if ran continuously. Irrigation systems with less capacity to deliver water, or when crop water use is greater than 0.25”/day, are reliant on the soil moisture reserves to provide soil water or yield loss can occur.
As we near second half of August soybean water use slows and the chances of rainfall providing enough water increases, making it important for grower to leave enough room in the soil profile to hold a 1” rainfall. ”It benefits both the farm bottom line and the environment to make use of all the rainfall you are blessed with” says Kelley.
For more information on irrigation water use and when to irrigate see fact sheet #3 “Irrigation Scheduling tools” at: http://msue.anr.msu.edu/uploads/235/67987/FactSheets/3_IrrigationSchedulingTools5.14.pdf
The grain fill period begins with successful pollination and initiation of kernel development, and ends approximately 60 days later when the kernels are physiologically mature. During grain fill, the developing kernels are the primary sink for concurrent photosynthate produced by the corn plant. What this means is that the photosynthate demands of the developing kernels will take precedence over that of much of the rest of the plant. In essence, the plant will do all it can to "pump" dry matter into the kernels, sometimes at the expense of the health and maintenance of other plant parts including the roots and lower stalk.
A stress-free grain fill period can maximize the yield potential of a crop, while severe stress during grain fill can cause kernel abortion or lightweight grain and encourage the development of stalk rot. The health of the upper leaf canopy is particularly important for achieving maximum grain filling capacity. Some research indicates that the upper leaf canopy, from the ear leaf to the uppermost leaf, is responsible for no less than 60% of the photosynthate necessary for filling the grain.
Kernel development proceeds through several distinct stages that were originally described by Hanway (1971) and most recently by Abendroth et al. (2011). As with leaf staging protocols, the kernel growth stage for an entire field is defined when at least 50% of the plants in a field have reached that stage.
Silk emergence is technically the first recognized stage of the reproductive period. Every ovule (potential kernel) on the ear develops its own silk (the functional stigma of the female flower). Silks begin to elongate soon after the V12 leaf stage (12 leaves with visible leaf collars), beginning with the ovules nearer the base of the cob and then sequentially up the cob, with the tip ovules silking last. Consequently, the silks from the base half of the ear are typically the first to emerge from the husk leaves. Turgor pressure "fuels" the elongation of the silks and so severe drought stress usually results in delayed silk elongation and emergence from the husk leaves. Silks elongate about 1.5 inches per day during the first few days after they emerge from the husk leaves. Silks continue to elongate until pollen grains are captured and germinate or until they simply deteriorate with age.
Silks remain receptive to pollen grain germination up to 10 days after silk emergence (Nielsen, 2016b), but deteriorate quickly after about the first 5 days of emergence. Natural senescence of silk tissue over time results in collapsed tissue that restricts continued growth of the pollen tube. Silk emergence usually occurs in close synchrony with pollen shed (Nielsen, 2016c), so that duration of silk receptivity is normally not a concern. Failure of silks to emerge in the first place (for example, in response to silkballing or severe drought stress) does not bode well for successful pollination.
Pollen grains "captured" by silks quickly germinate and develop pollen tubes that penetrate the silk tissue and elongate to the ovule within about 24 hours. The pollen tubes contain the male gametes that eventually fertilize the ovules. Within about 24 hours or so after successfully fertilizing an ovule, the attached silk deteriorates at the base, collapses, and drops away. This fact can be used to determine fertilization success before visible kernel development occurs (Nielsen, 2016a).
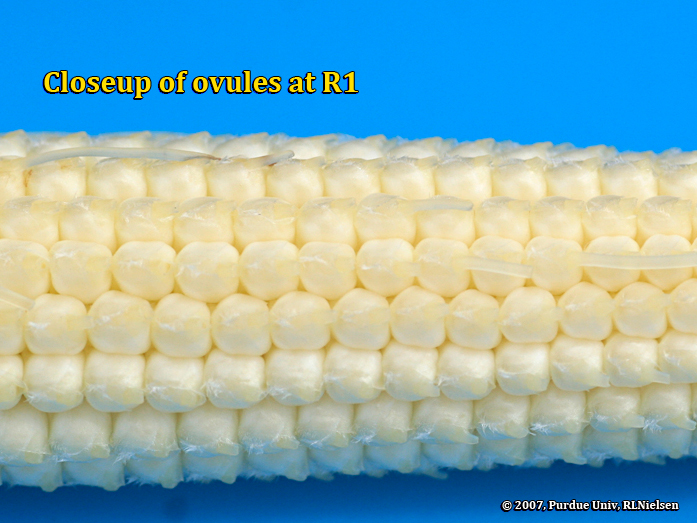
Close-up of ovules at R1.
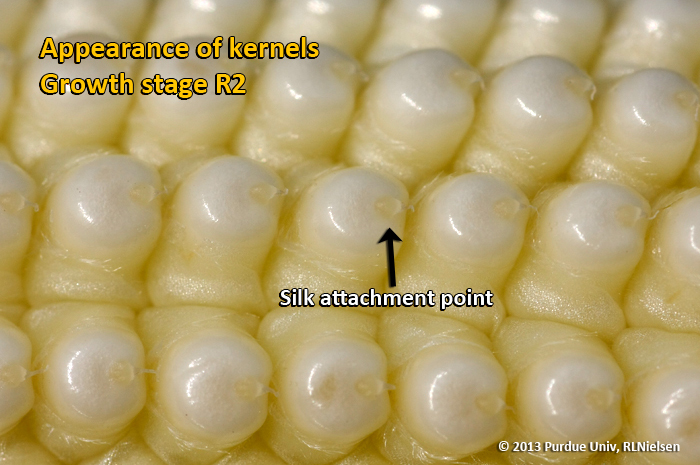
About 10 to 14 days after silking, the developing kernels are whitish "blisters" on the cob and contain abundant clear fluid. The ear silks are mostly brown and drying rapidly. Some starch is beginning to accumulate in the endosperm. The radicle root, coleoptile, and first embryonic leaf have formed in the embryo by the blister stage. Severe stress can easily abort kernels at pre-blister and blister stages. Kernel moisture content is approximately 85 percent. For late April to early May plantings in Indiana, the thermal time from blister stage to physiological maturity is approximately 960 GDDs (Brown, 1999).

Appearance of kernels growth stage R2.
Appearance of kernels growth stage R2.
About 18 to 22 days after silking, the kernels are mostly yellow and contain "milky" white fluid. The milk stage of development is the infamous "roasting ear" stage, that stage where you will find die-hard corn aficionados standing out in their field nibbling on these delectable morsels. Starch continues to accumulate in the endosperm. Endosperm cell division is nearly complete and continued growth is mostly due to cell expansion and starch accumulation. Severe stress can still abort kernels, although not as easily as at the blister stage. Kernel moisture content is approximately 80 percent. For late April to early May plantings in Indiana, the thermal time from milk stage to physiological maturity is approximately 880 GDDs (Brown, 1999).
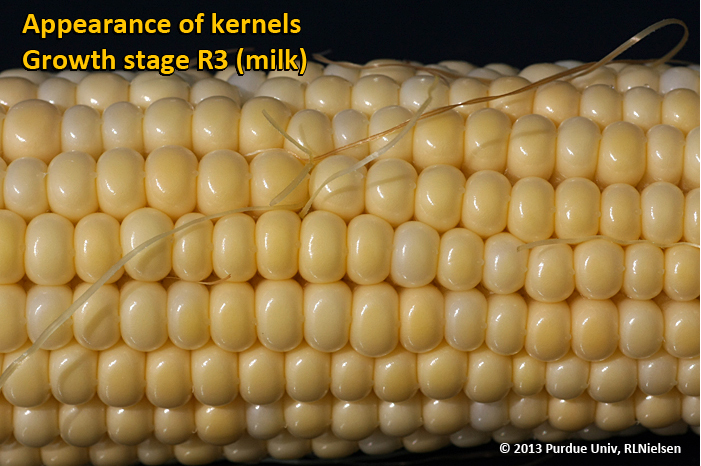
Appearance of kernels growth stage R3 (milk).
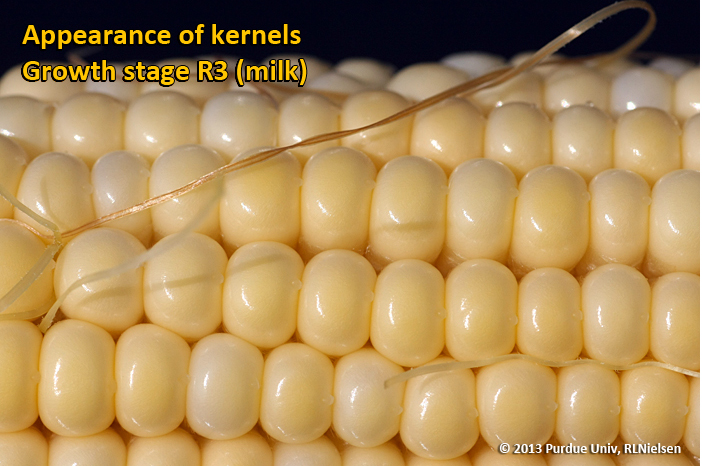
Appearance of kernels growth stage R3 (milk).
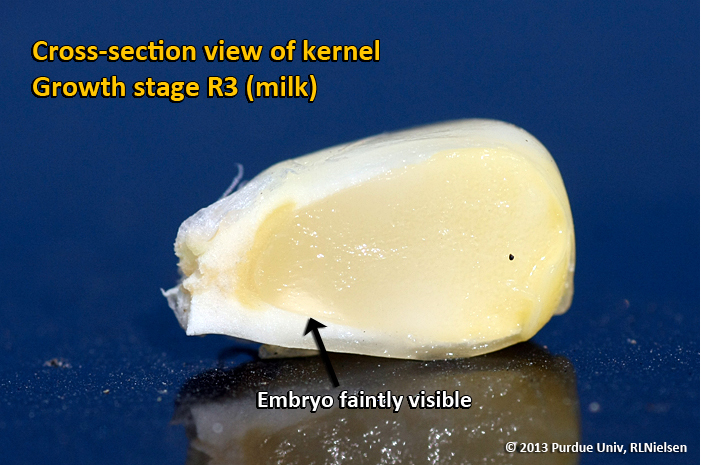
Cross-section view of kernel growth stage R3 (milk).
About 24 to 28 days after silking, the kernel's milky inner fluid is changing to a "doughy" consistency as starch accumulation continues in the endosperm. The shelled cob is now light red or pink. By dough stage, four embryonic leaves have formed and the kernels have reached about 50 percent of their mature dry weight. Kernel moisture content is approximately 70 percent by R4. Kernel abortion is much less likely to occur once kernels have reached early dough stage, but severe stress can continue to affect eventual yield by reducing kernel weight. For late April to early May plantings in Indiana, the thermal time from dough stage to physiological maturity is approximately 670 GDDs (Brown, 1999).
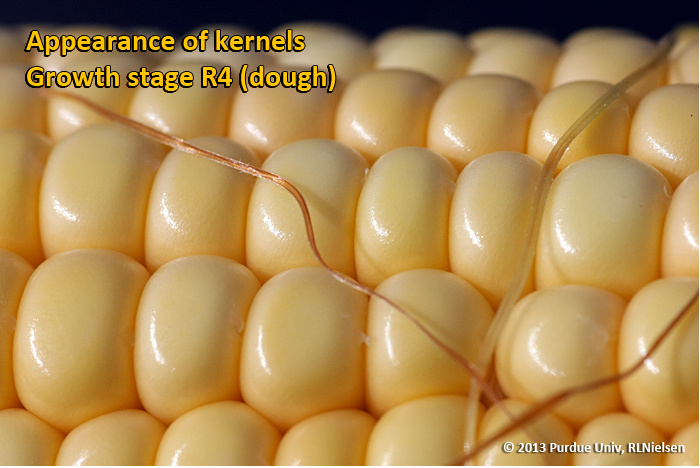
Appearance of kernels growth stage R4 (dough).
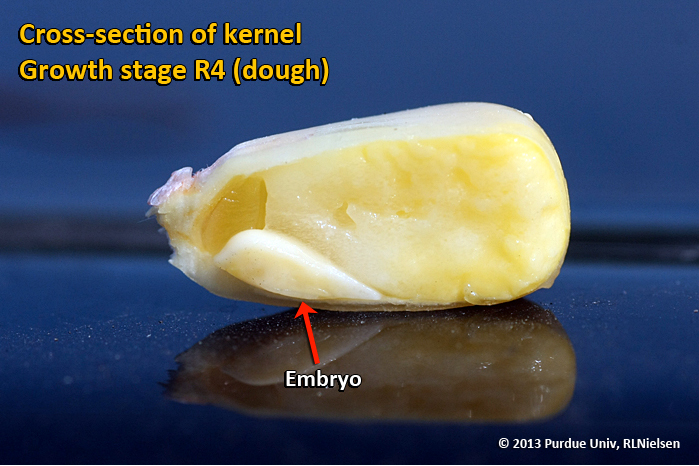
Cross-section view of kernel growth stage R4 (dough).
About 35 to 42 days after silking, all or nearly all of the kernels are denting near their crowns. The fifth (and last) embryonic leaf and lateral seminal roots form just prior to the dent stage. Kernel moisture content at the beginning of the dent stage is approximately 55 percent.

Cross section of ear.
A distinct horizontal line appears near the dent end of the kernel and slowly progresses to the tip end of the kernel over the next 3 weeks or so. This line is called the "milk line" and marks the boundary between the liquid (milky) and solid (starchy) areas of the maturing kernels.
For late April to early May plantings in Indiana, the thermal time from full dent (kernel milk line barely visible) to physiological maturity is approximately 350 GDDs (Brown, 1999). Thermal time from the half-milkline stage to physiological maturity for similar planting dates is approximately 280 GDDs. One of the consequences of delayed planting is that thermal time from the dent stage to physiological maturity is shortened, though this may simply reflect a premature maturation of the grain caused by the cumulative effects of shorter daylengths and cooler days in early fall or by outright death of the plants by a killing fall freeze.
Severe stress can continue to limit kernel dry weight accumulation between the dent stage and physiological maturity. Estimated yield loss due to total plant death at full dent is about 40%, while total plant death at half-milkline would decrease yield by about 12% (Carter & Hesterman, 1990)
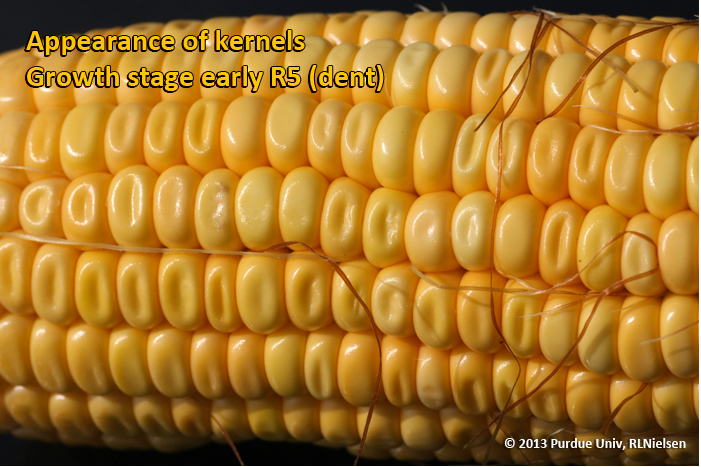
Appearance of kernels growth stage early R5 (dent).
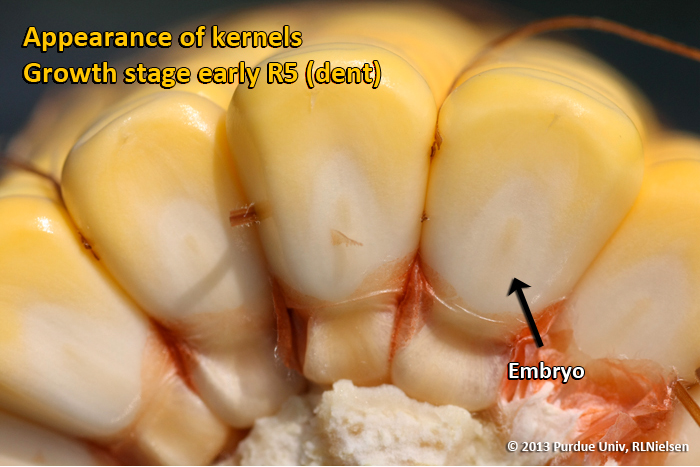
Appearance of kernels growth stage early R5 (dent).
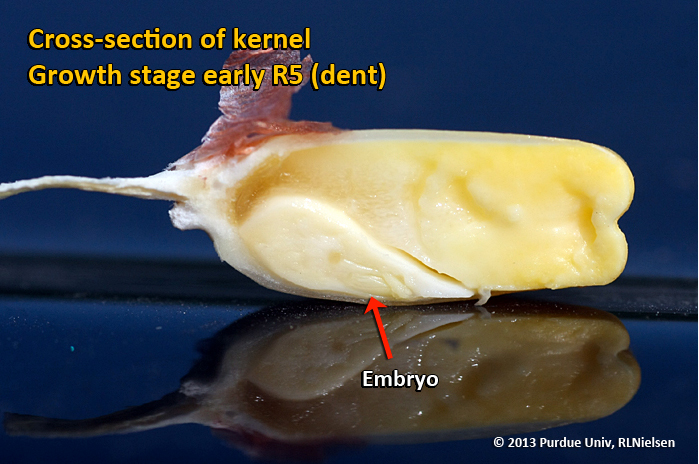
Cross-section of kernel growth stage early R5 (dent).
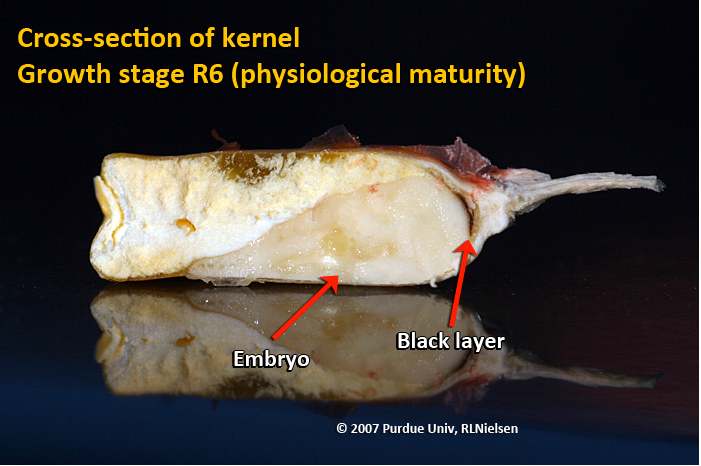
About 55 to 65 days after silking, kernel dry weight usually reaches its maximum and kernels are said to be physiologically mature and safe from frost. Physiological maturity occurs shortly after the kernel milk line disappears and just before the kernel black layer forms at the tip of the kernels. Severe stress after physiological maturity has little effect on grain yield, unless the integrity of the stalk or ear is compromised (e.g., damage from European corn borer or stalk rots). Kernel moisture content at physiological maturity averages 30 percent, but can vary from 25 to 40 percent grain moisture.
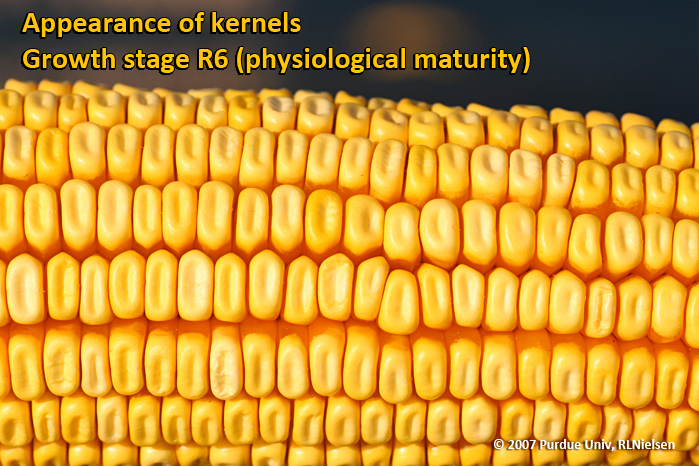
Appearance of kernels growth stage R6 (physiological maturity).
Appearance of kernels growth stage R6 (physiological maturity).
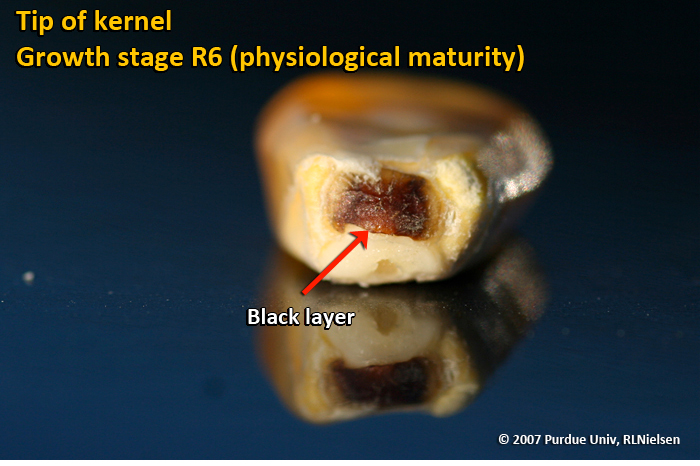
Tip of kernel growth stage R6 (physiological maturity).
While not strictly a stage of grain development, harvest maturity is often defined as that grain moisture content where harvest can occur with minimal kernel damage and mechanical harvest loss. Harvest maturity is usually considered to be near 25 percent grain moisture.
Abendroth, Lori J., Roger W. Elmore , Matthew J. Boyer , & Stephanie K. Marlay. 2011. Corn Growth and Development. Iowa State Univ. Extension publication PMR1009. Purchase online at https://store.extension.iastate.edu/ItemDetail.aspx?ProductID=6065. [URL accessed Aug 2016].
Brown, Greg A. 1999. Influence of Delayed Planting on Growing Degree Day Requirements of Corn (Zea mays L.) Hybrids During Grain Fill and Maturation. M.S. Thesis, Purdue University.
Carter, P.R. and O.B. Hesterman. 1990. Handling Corn Damaged by Autumn Frost (NCH-57). Purdue Extension. Online at https://www.extension.purdue.edu/extmedia/NCH/NCH-57.html. (URL accessed Aug 2016).
Hanway, John J. 1971. How a Corn Plant Develops. Iowa State Univ. Sp. Rpt. No. 48. [out of print]
Nielsen, R.L. (Bob). 2011. Kernel Set Scuttlebutt. Corny News Network, Purdue Univ. Online at http://www.kingcorn.org/news/timeless/KernelSet.html. (URL accessed Aug 2013).
Nielsen, R.L. (Bob). 2013. Effects of Stress During Grain Filling in Corn. Corny News Network, Purdue Univ. Online at http://www.kingcorn.org/news/timeless/GrainFillStress.html. (URL accessed Aug 2016).
Nielsen, R.L. (Bob). 2016a. A fast and accurate pregnancy test for corn. Corny News Network, Purdue Univ. Online at http://www.kingcorn.org/news/timeless/EarShake.html [URL accessed Aug 2016].
Nielsen, R.L. (Bob). 2016b. Silk Emergence. Corny News Network, Purdue Univ. Online at http://www.kingcorn.org/news/timeless/Silks.html (URL accessed Aug 2016).
Nielsen, R.L. (Bob). 2016c. Tassel Emergence & Pollen Shed. Corny News Network, Purdue Univ. Online at http://www.kingcorn.org/news/timeless/Tassels.html (URL accessed Aug 2016).
The occurrences of failed control of waterhemp and Palmer amaranth with postemergence herbicides has continued to increase during the 2016 field season in Indiana. The Purdue Weed Science Group (with funding assistance from the Indiana Soybean Alliance) has been accepting samples for resistance screening from farmers and industry reps who have experienced poor control waterhemp and Palmer. The samples received have been tested for PPO-inhibitor (group 14), glyphosate (group 9), and ALS resistance (group 2). So far in 2016 samples from 22 fields from 10 counties within Indiana have been tested for resistance, with more samples waiting to be run through the lab.
The occurrence of glyphosate resistance in waterhemp continues to increase with a large majority of populations submitted having one of the resistance mechanisms we can screen for in our lab. We have currently confirmed 31 counties with glyphosate resistant waterhemp and 19 of 22 samples submitted to the lab contained at least 1 plant with resistance and a majority of samples contained predominantly resistant plants.
With widespread glyphosate resistance in waterhemp, producers are forced to rely heavily on PPO-inhibiting herbicides to control the problematic weed in soybean. Other than Liberty in a Liberty Link soybean system, postemergence PPO-inhibiting herbicides (Flexstar, Cobra, Ultra Blazer, etc) are the only products available to control waterhemp postemergence. These post applications of PPO’s often follow a preemergence herbicide with a PPO-inhibiting active ingredient (Valor and Authority products). The repeated use of PPO’s in these systems in conjunction with often late post applications on large plants has quickly led to the selection of PPO-resistant waterhemp populations.
To date Purdue Weed Science has confirmed PPO-resistant waterhemp in 14 Indiana counties with the majority of occurrences occurring in the southwestern portion of the state. The laboratory has screened samples from 20 fields for PPO-resistance so far in 2016, with 10 of those samples returning at least one plant that was resistant. As PPO’s continue to be heavily relied upon for management of glyphosate-resistant waterhemp it is expected that the occurrence of PPO-resistance will continue to increase.
Purdue researchers have also confirmed one population of PPO-resistant Palmer amaranth that has occurred in Daviess County. While this is the only population confirmed in Indiana it is worth noting that Palmer amaranth also has the potential for selecting for PPO-resistance.
Producers who are currently dealing with glyphosate resistant populations of Palmer amaranth and waterhemp are encouraged to diversify their modes of action as much as possible in their soybean acres. This would include using a group 15 (Warrant, Dual II Magnum, Outlook, Zidua, etc) or 5 (metribuzin) in conjunction with the group 14’s (PPO-inhibitors) in their preemergence programs. Farmer should also consider the use of Liberty Link soybean to add another mode of action option to their post-emergence programs.
Postemergence applications of PPO-inhibitors as well as Liberty should be maximized to reduce the risk of selecting for resistant plants. Maximizing these applications includes making timely applications to plants that are no larger than 6 inches tall, as well as ensuring proper spray coverage of these contact products by using higher spray volumes (15-20 GPA) and smaller droplet producing nozzles.
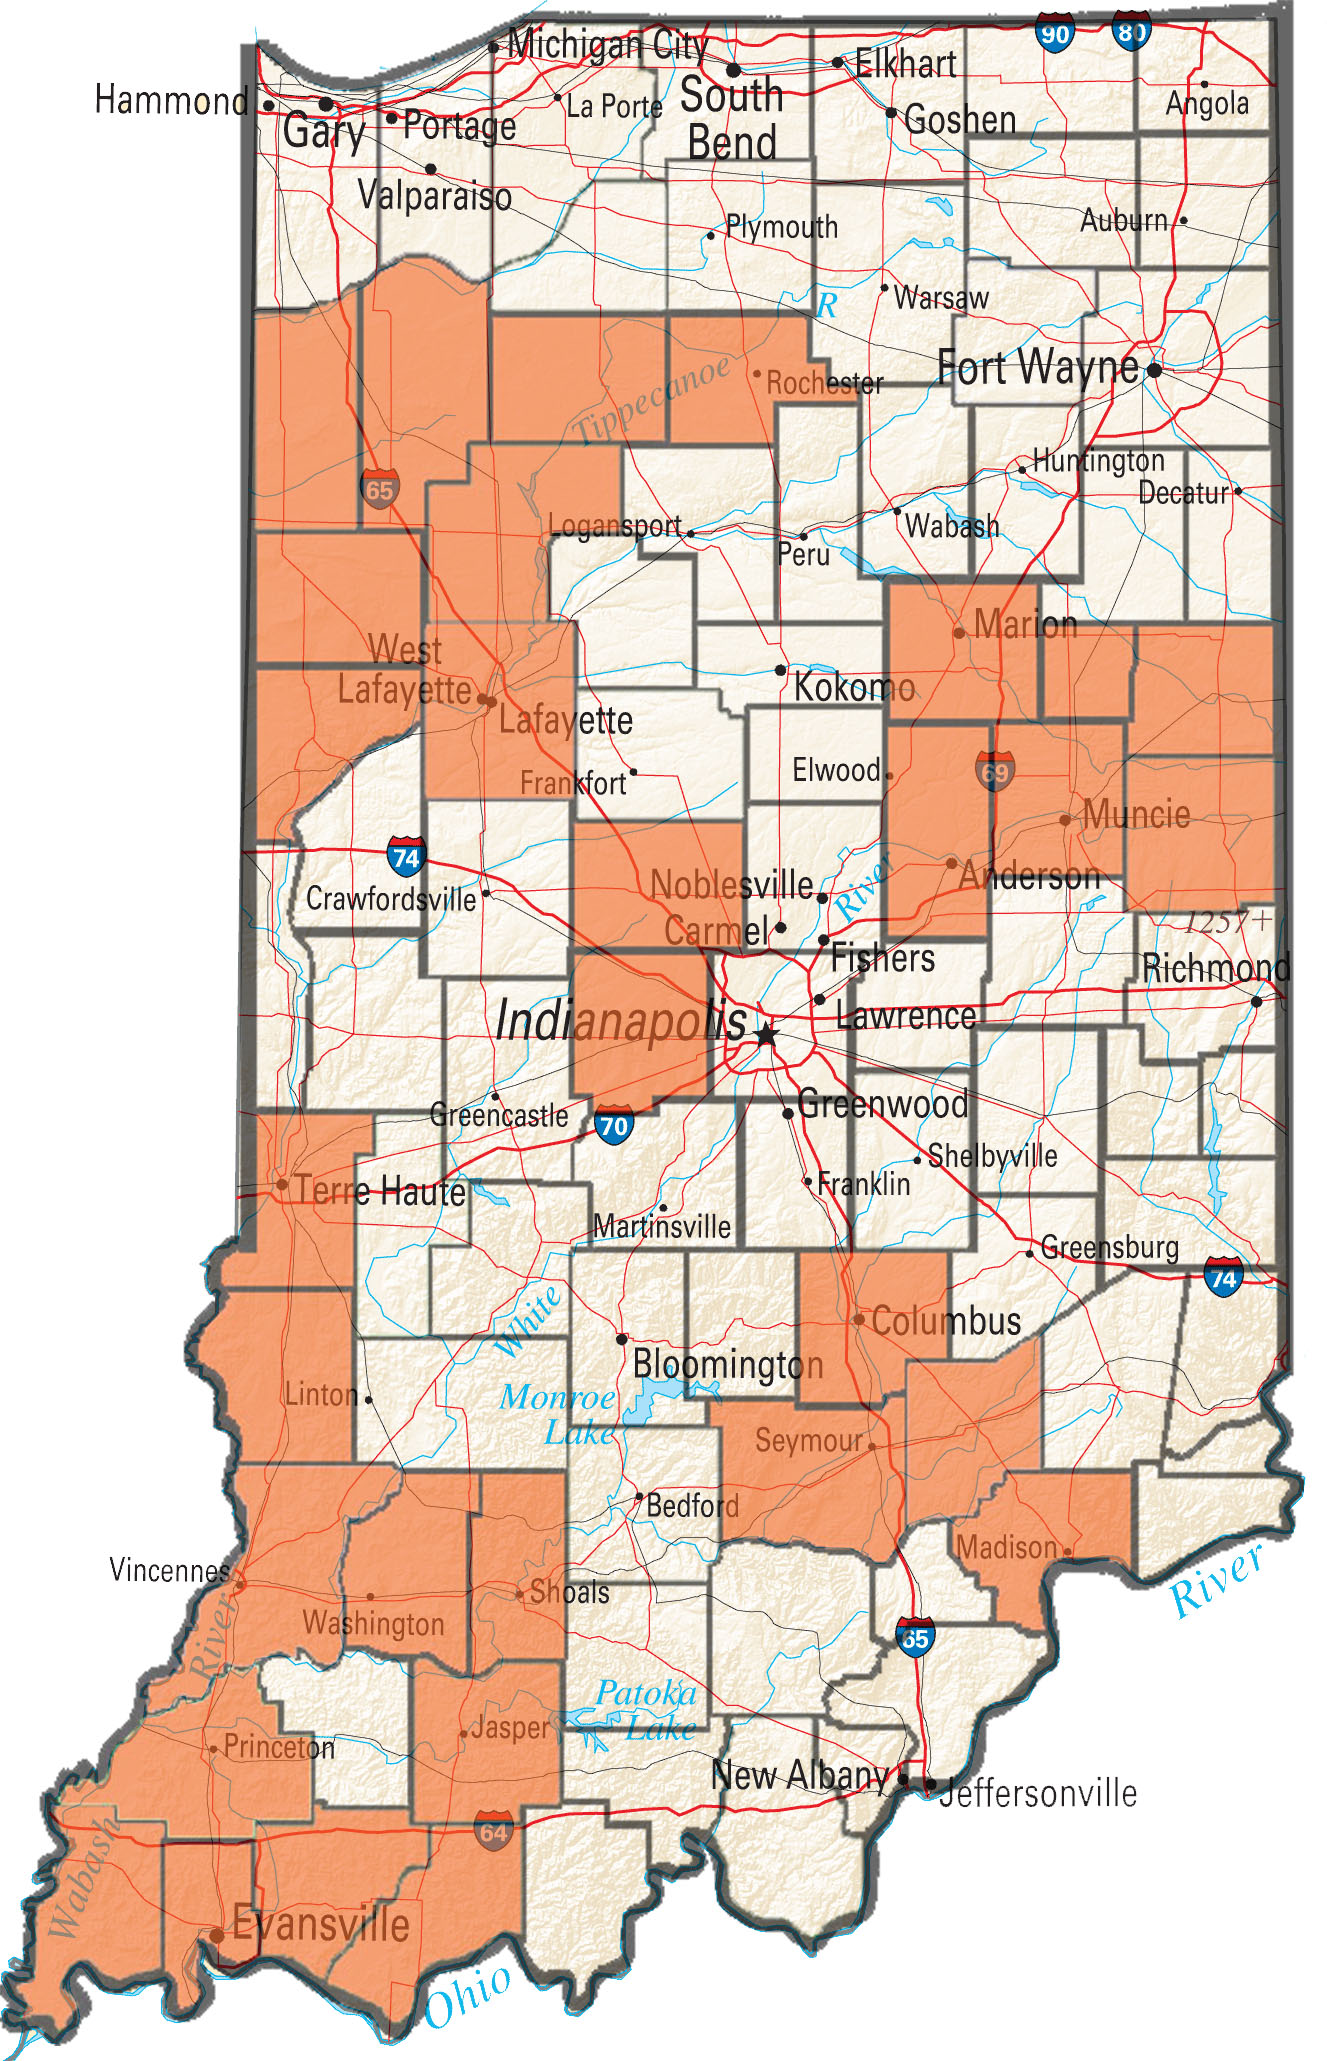
Figure 1. Indiana counties with confirmed glyphosate-resistant water hemp.
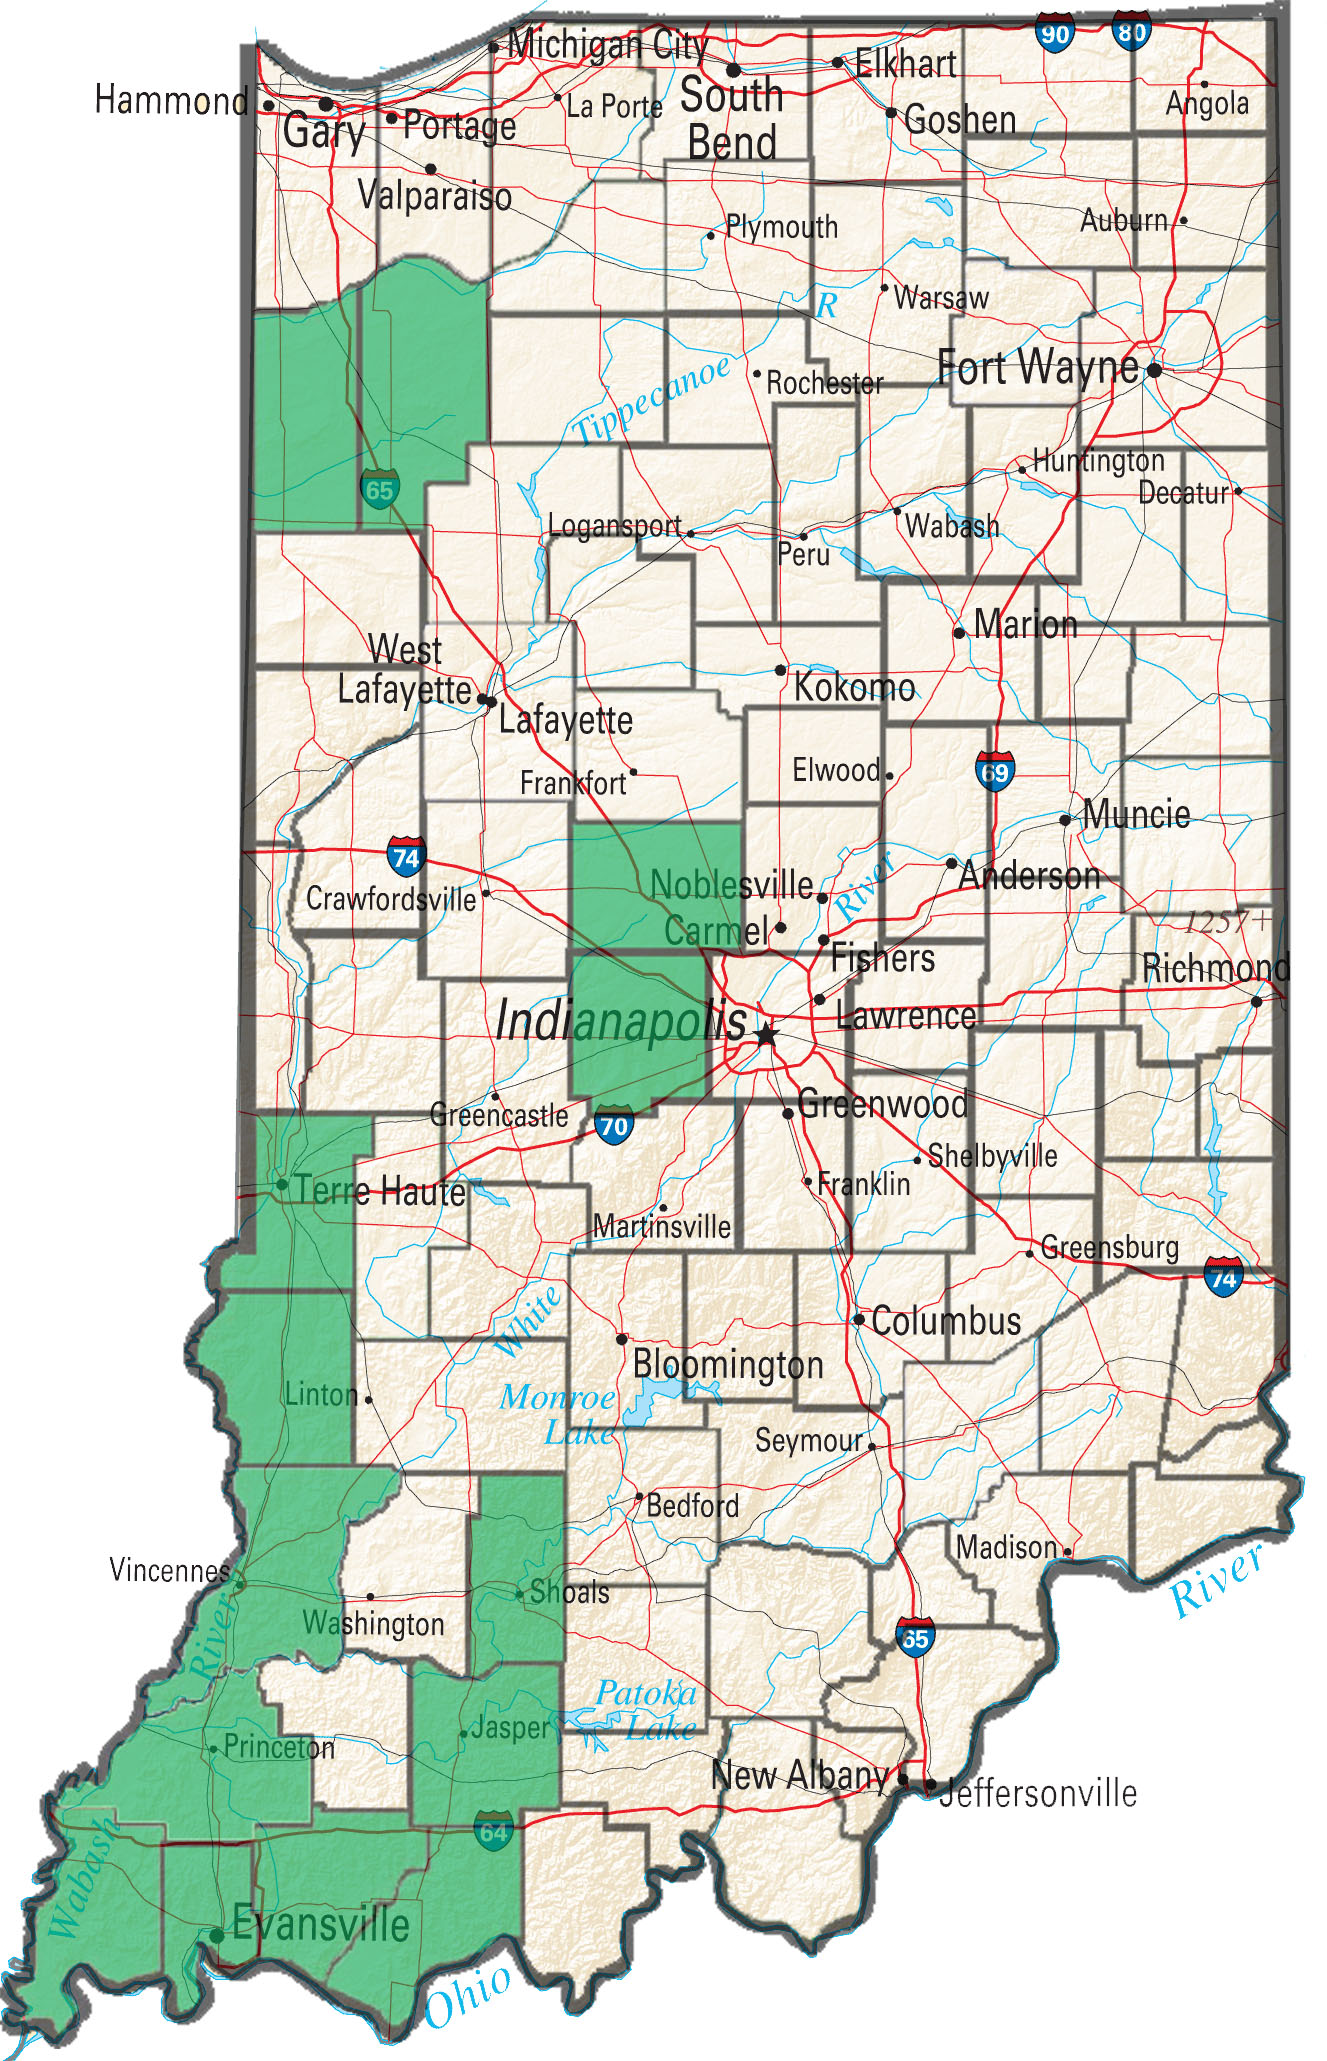
Figure 1. Indiana counties confirmed PPO resistant waterhemp.
Purdue Cooperative Extension Service
Purdue Extension Entomology
901 W. State Street
West Lafayette, IN, 47907
(765) 494-8761
luck@purdue.edu
@PurdueExtEnt
PurdueEntomology
![]()
If you would like to be alerted by e-mail when the current issue of the Pest&Crop is available on-line, please enter your e-mail address and click the submit button.
It is the policy of the Purdue University Cooperative Extension Service that all persons have equal opportunity and access to its educational programs, services, activities, and facilities without regard to race, religion, color, sex, age, national origin or ancestry, marital status, parental status, sexual orientation, disability or status as a veteran. Purdue University is an Affirmative Action institution. This material may be available in alternative formats.