
USDA-NIFA Extension IPM Grant
Pest & Crop Newsletter, Entomology Extension, Purdue University
Dear Pest&Crop Readers:
We need your HELP. We want the Pest&Crop to better serve your needs. Please take a couple mimutes now for this confidential, online survey. Thank you for your time! Click the following link: <http://tinyurl.com/o4e2o2k>
Post Harvest Update and Recertification Workshop – (Linda Mason) -
The Post Harvest Update and Recertification Workshop will be held December 19, 2014 at the Beck Agricultural Center, Purdue Agronomy Center for Research and Education, 4540 U.S. 52 W., West Lafayette, IN 47906. Pre-register and save money, $95.00 by Dec. 12 and $110.00 after. Registration is limited.
The schedule of the day:
8:30 AM Registration, Coffee & Donuts
9 AM - 12 PM Sessions
12 - 1 PM Catered Lunch Provided
1 - 4 PM Sessions
4 PM Complete Certification Forms
CCH’s applied for. Watch for more detail on our Post Harvest and Grain Quality Website: <http://extension.entm.purdue.edu/grainlab/>.
![]()
The Purdue Pest Management Program will be offering a series of Crop Management Workshops to be held at four locations throughout Indiana. Here are the locations and dates:
Monday, January 26, Warsaw, Grace College
Tuesday, January 27, Seymour, The Pines
Wednesday, January 28, Vincennes, Vincennes University
Thursday, January 29, W. Lafayette, Becks Center
Friday, January 30, W. Lafayette, Becks Center
Look for future notification in the Pest&Crop for registration details.
![]()
Wandering Swath Width Syndrome: Yield Monitor Errors – (Bob Nielsen) -
While we often focus on the importance of yield monitor calibration relative to logging accurate yield estimates during grain harvest (Luck & Fulton, 2014), there are other yield monitor settings that can inadvertently influence yield estimates. One of these is the option in certain displays to automatically adjust harvest header or swath width based on the harvested “coverage map” and the estimated current geo-position of the combine in the field. Header or swath width, of course, is used by the yield monitor to estimate the harvested area and the calculation of yield per acre for individual data points and so accurate widths are important to ensure accurate yield estimates.
When set to automatically adjust header width, the yield monitor will automatically decrease the header width if it perceives that part of the combine header is overlapping a previously harvested area. When the estimated geo-position of the combine is accurate, this automatic setting is great when harvesting point rows or field edges in corn or when harvesting soybeans in general. However, when the estimated geo-position of the combine is not accurate, the yield monitor may erroneously change header widths in the middle of the field where, in fact, the combine is NOT overlapping a harvested area.. This is most likely to occur when the combine is using DGPS signals from WAAS or similar signal sources with positional accuracies ranging from 5 to 15 feet horizontally.
The consequence of inadvertent and erroneous header width changes on yield estimates can be quite significant. Figure 1 illustrates a small section of a field where the yield monitor erroneously decreased the header width value from the full 20 feet (eight 30-inch rows of corn) to 17.5 feet (seven 30-inch rows) for a short distance.

Fig 1. Yield data points depicting full (20 ft) header width (blue) and incorret partial 17.5 ft header widths (yellow).
The incorrect and narrower header width values for those data points resulted in overestimated yields per acre for those data points because the estimated harvested area for those points was erroneously smaller. Figure 2 illustrates the estimated yields for the individual data points. The average estimated yield for the 8 data points with incorrect header width values was 263 bu/ac. The average estimated yield for the surrounding data points with the correct 20ft header width values was 223 bu/ac. The data points were logged every second at an average speed of 5.7 mph and so are approximately 8 feet apart, meaning that there is approximately 64 feet of incorrect header width values and, subsequently, incorrect yield data.
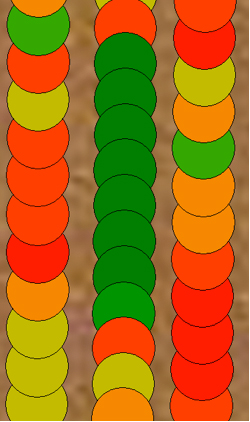
Fig 2. Yield data points depicting estimated yields. Average yield for the 17.5 ft header width points was 263 bu/ac while the aveage yield for the surrounding normal 20 ft header widths was 223 bu/ac.
Clearly, the impact of such random and incorrect automatic header width changes on yield estimates throughout a field can be significant depending on the percentage of the field affected. Recognize that such yield estimate errors are far larger than those resulting from simpler calibration issues and, thus, deserve your attention if your goal is to end up with an accurate yield map.
So, how can you tell whether your yield data is afflicted with Wandering Swath Width Syndrome (WSWS)?
•If you use auto-steer on your combine, I suppose you could keep your eyes glued to the display monitor and watch the header width values as you harvest the field.
•Some, but not all, mapping software programs allow you to map the logged data by their header / swath width values. That allows you to visualize the header width changes throughout the field as illustrated in Fig. 1.
°Unfortunately, this diagnostic occurs after the “cows have broken through the fence” and only points you in the right direction for future harvesting.
So, what can be done to prevent or minimize the occurrence of WSWS?
•Equip your combine with more precise DGPS signal sources, such as RTK, so that the combine’s estimated geo-position is more precise (within inches) and, thus, the estimated harvest coverage map will be more precise.
•Turn off the automatic header width setting in the yield monitor display and manually change header widths when harvesting point rows or other partial header widths.
So, what can be done once the problem has occurred and you are stuck with a bunch of yield files containing incorrect header widths and consequently incorrect yield estimates?
•Some yield data processing software allows you to “re-process” yield data during or after it has been imported by the software. Often there will be an option to force the use of a single header / swath width in processing the data. Selecting this would override the logged header / swath widths in the data file and result in correct yield estimates.
•If the software you use to process (aka “read”, “import”, etc) yield files does not allow you to force a single manual header / swath width during the yield processing step, then you are basically stuck with the yield estimation errors.
°Unless.... you are savvy enough to save / export the yield data to a “shape” file, and then...
°Edit the “shape” file to add a new “yield” variable and recalculate yields yourself using the logged values for grain flow, logging interval, grain moisture, distance traveled, and your single value for header / swath width (see formula in Luck & Fulton, 2014).
°Such editing of a yield data file is doable with GIS programs like ArcGIS, but not with many of the other “off-the-shelf” mapping programs.
Related Reading
Luck, Joe and John Fulton. 2014. Best Management Practices for Collecting Accurate Yield Data and Avoiding Errors During Harvest. Univ. of Nebraska Extension publication EC2004. <http://goo.gl/ttufk1> [URL accessed Oct 2014].
![]()

![]()