
USDA-NIFA Extension IPM Grant
Pest & Crop Newsletter, Entomology Extension, Purdue University
- Soybean Aphid Update
- Aphids in Corn
- 2014 Corn Earworm Trap Report
- Western Bean Cutworm Adult Pheromone Trap Report
- Goss's Bacterial Wilt and Leaf Blight in Corn
- VIDEO: Goss's Bacterial Wilt in Corn
- Sudden Death Syndrome and Brown Stem Rot in Soybeans
- VIDEO: Soybean Disease: Sudden Death Syndrome
- VIDEO: Studying Sudden Death Syndrome Management on Soybean
Soybean Aphid Update – (Christian Krupke and John Obermeyer)
Soybean aphids have begun to show up in a few northern Indiana soybean fields, some are reportedly over threshold. This certainly illustrates the importance of scouting each field before treating. Most fields won’t need any insecticide treatment, but a complicating factor is some areas where the aphids are starting to build in numbers are dry. Refer to the following soybean aphid threshold. Normally we do not recommend treating beyond growth stage R5 (seed fill), but abnormally dry conditions may warrant protecting the plant from further stress. Rains, 0.5 inch or more, will alleviate stress and knock down some of the aphids.
Winged aphids are on the move, and fields can almost “clear out” overnight in some areas. Soybean aphid movement is initiated by many factors, including day-length, population density, and predator pressure. This leads to wing development for flight to new, unexploited food sources. With this is in mind, pay close attention to very late-planted soybean fields, such as double cropped beans. The bottom line…keep scouting!
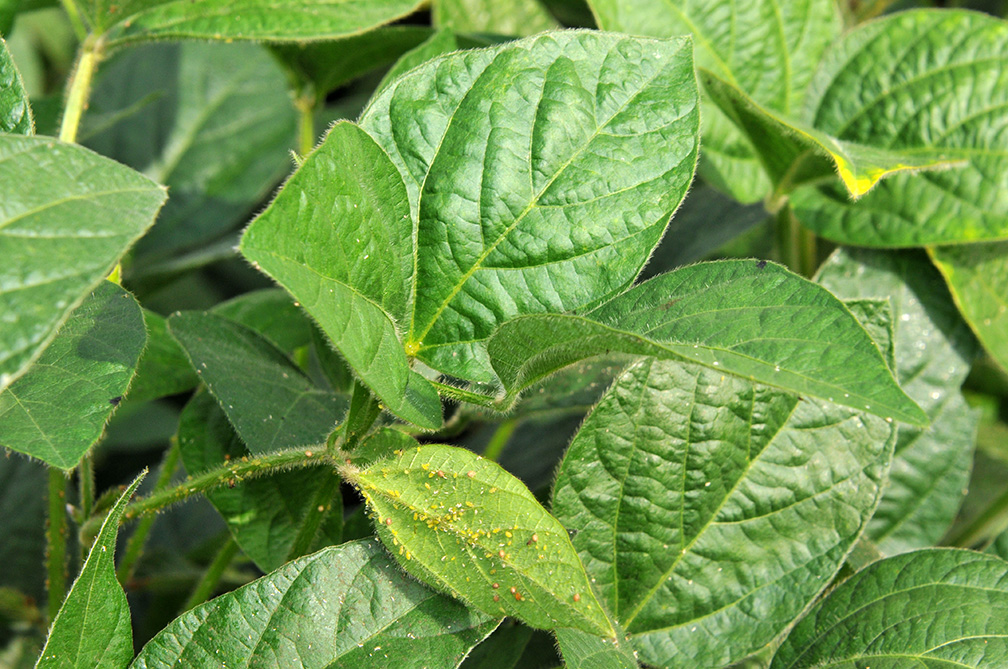
Soybean aphid population buildup on underside of leaf
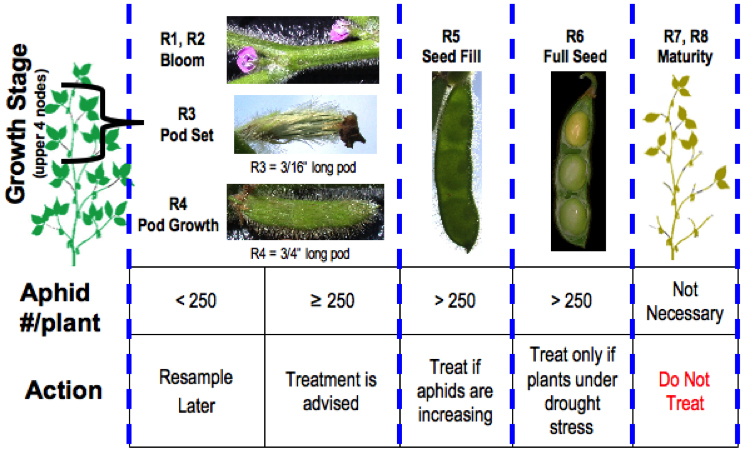
Soybean Aphid Threshold
![]()
Aphids in Corn – (Christian Krupke and John Obermeyer)
As in years past, we have received reports of cornfields in northern counties being infested with aphids. Two common cereal aphids (frequent pests of wheat), bird cherry-oat and English grain aphid, are often found colonizing plants, usually quite randomly in a field and not near field edges, so they are seldom seen. The soybean aphid suction trap network has captured an inordinate number of these winged species in the Purdue Ag Research Stations in northwestern and northeastern Indiana several weeks ago.
A very small percentage (<1%) of the plants are being colonized to the point of being damaged, and that only in scattered areas of the field. Most aphids are on the middle to bottom of the canopy and that most fields were in the dough stage of growth. Before and during pollination is the most critical time where aphids in corn may cause economic problems, especially when their excrement (“honey dew”) potentially interferes with pollination. Also, aphid predators and parasites are always found in these large aphid colonies doing their part to keep aphids in check. Though a few plants may be already be badly damaged from the aphids removing plant juices, and the neighboring plants look nasty with black sooty molds growing on the honeydew, our recommendation is to let things be. Most of the time the appearance is far worse than the actual damage and treatments now are too late to make any difference. The aphid populations are likely in decline from natural enemies.

Aphid hot-spot, weeks after the damage has been done
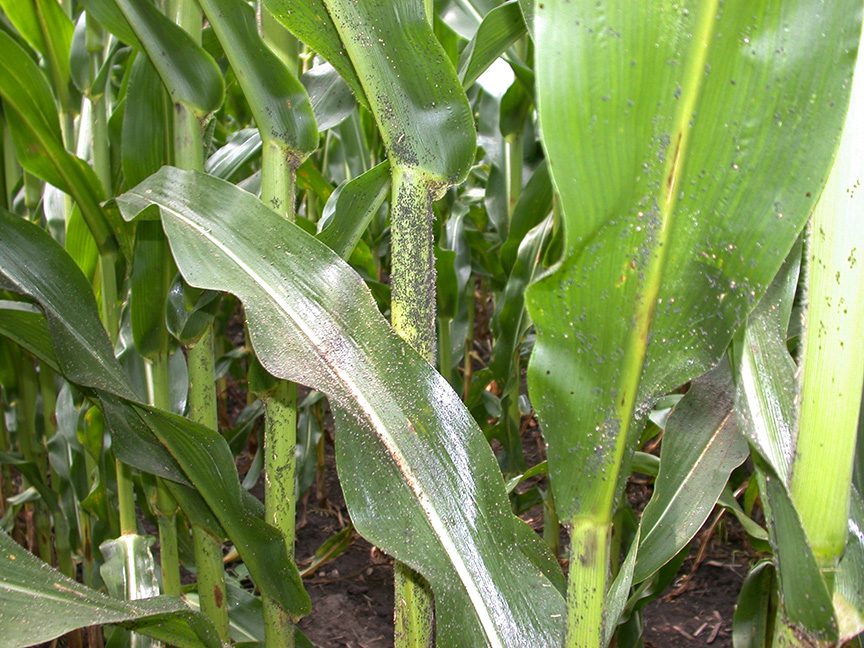
Aphids and honeydew on leaves and stalks
![]()
Click here to see the 2014 Corn Earworm Trap Report
![]()
Western Bean Cutworm Adult Pheromone Trap Report
![]()
Goss’s Bacterial Wilt and Leaf Blight in Corn – (Kiersten Wise) -
Goss’s wilt of corn, caused by the bacteria Clavibacter michiganensis subsp. nebraskensis, has been confirmed in several areas of Indiana. This disease is difficult to accurately identify in fields since hybrid and environmental conditions influence symptom expression. Lesions of Goss’s wilt are often confused with northern corn leaf blight symptoms, and there are many fields with confirmed northern corn leaf blight this year. It is important to accurately identify Goss’s wilt to help with future management decisions.
The bacterium that causes the disease survives in residue and some grassy weed species and infects corn plants through wounds. The diagnostic symptoms of Goss’s wilt include water-soaked lesions that have black “freckles” or specks on or surrounding the lesions (Figure 1). These lesions can be on any leaves of the plant and may be quite large on susceptible hybrids, and specialty corn, such as popcorn. Bacteria can also move onto the leaf surface and give the leaves a shiny appearance (Figure 2).

Figure 1. Black freckling associated with lesions of Goss's wilt of corn
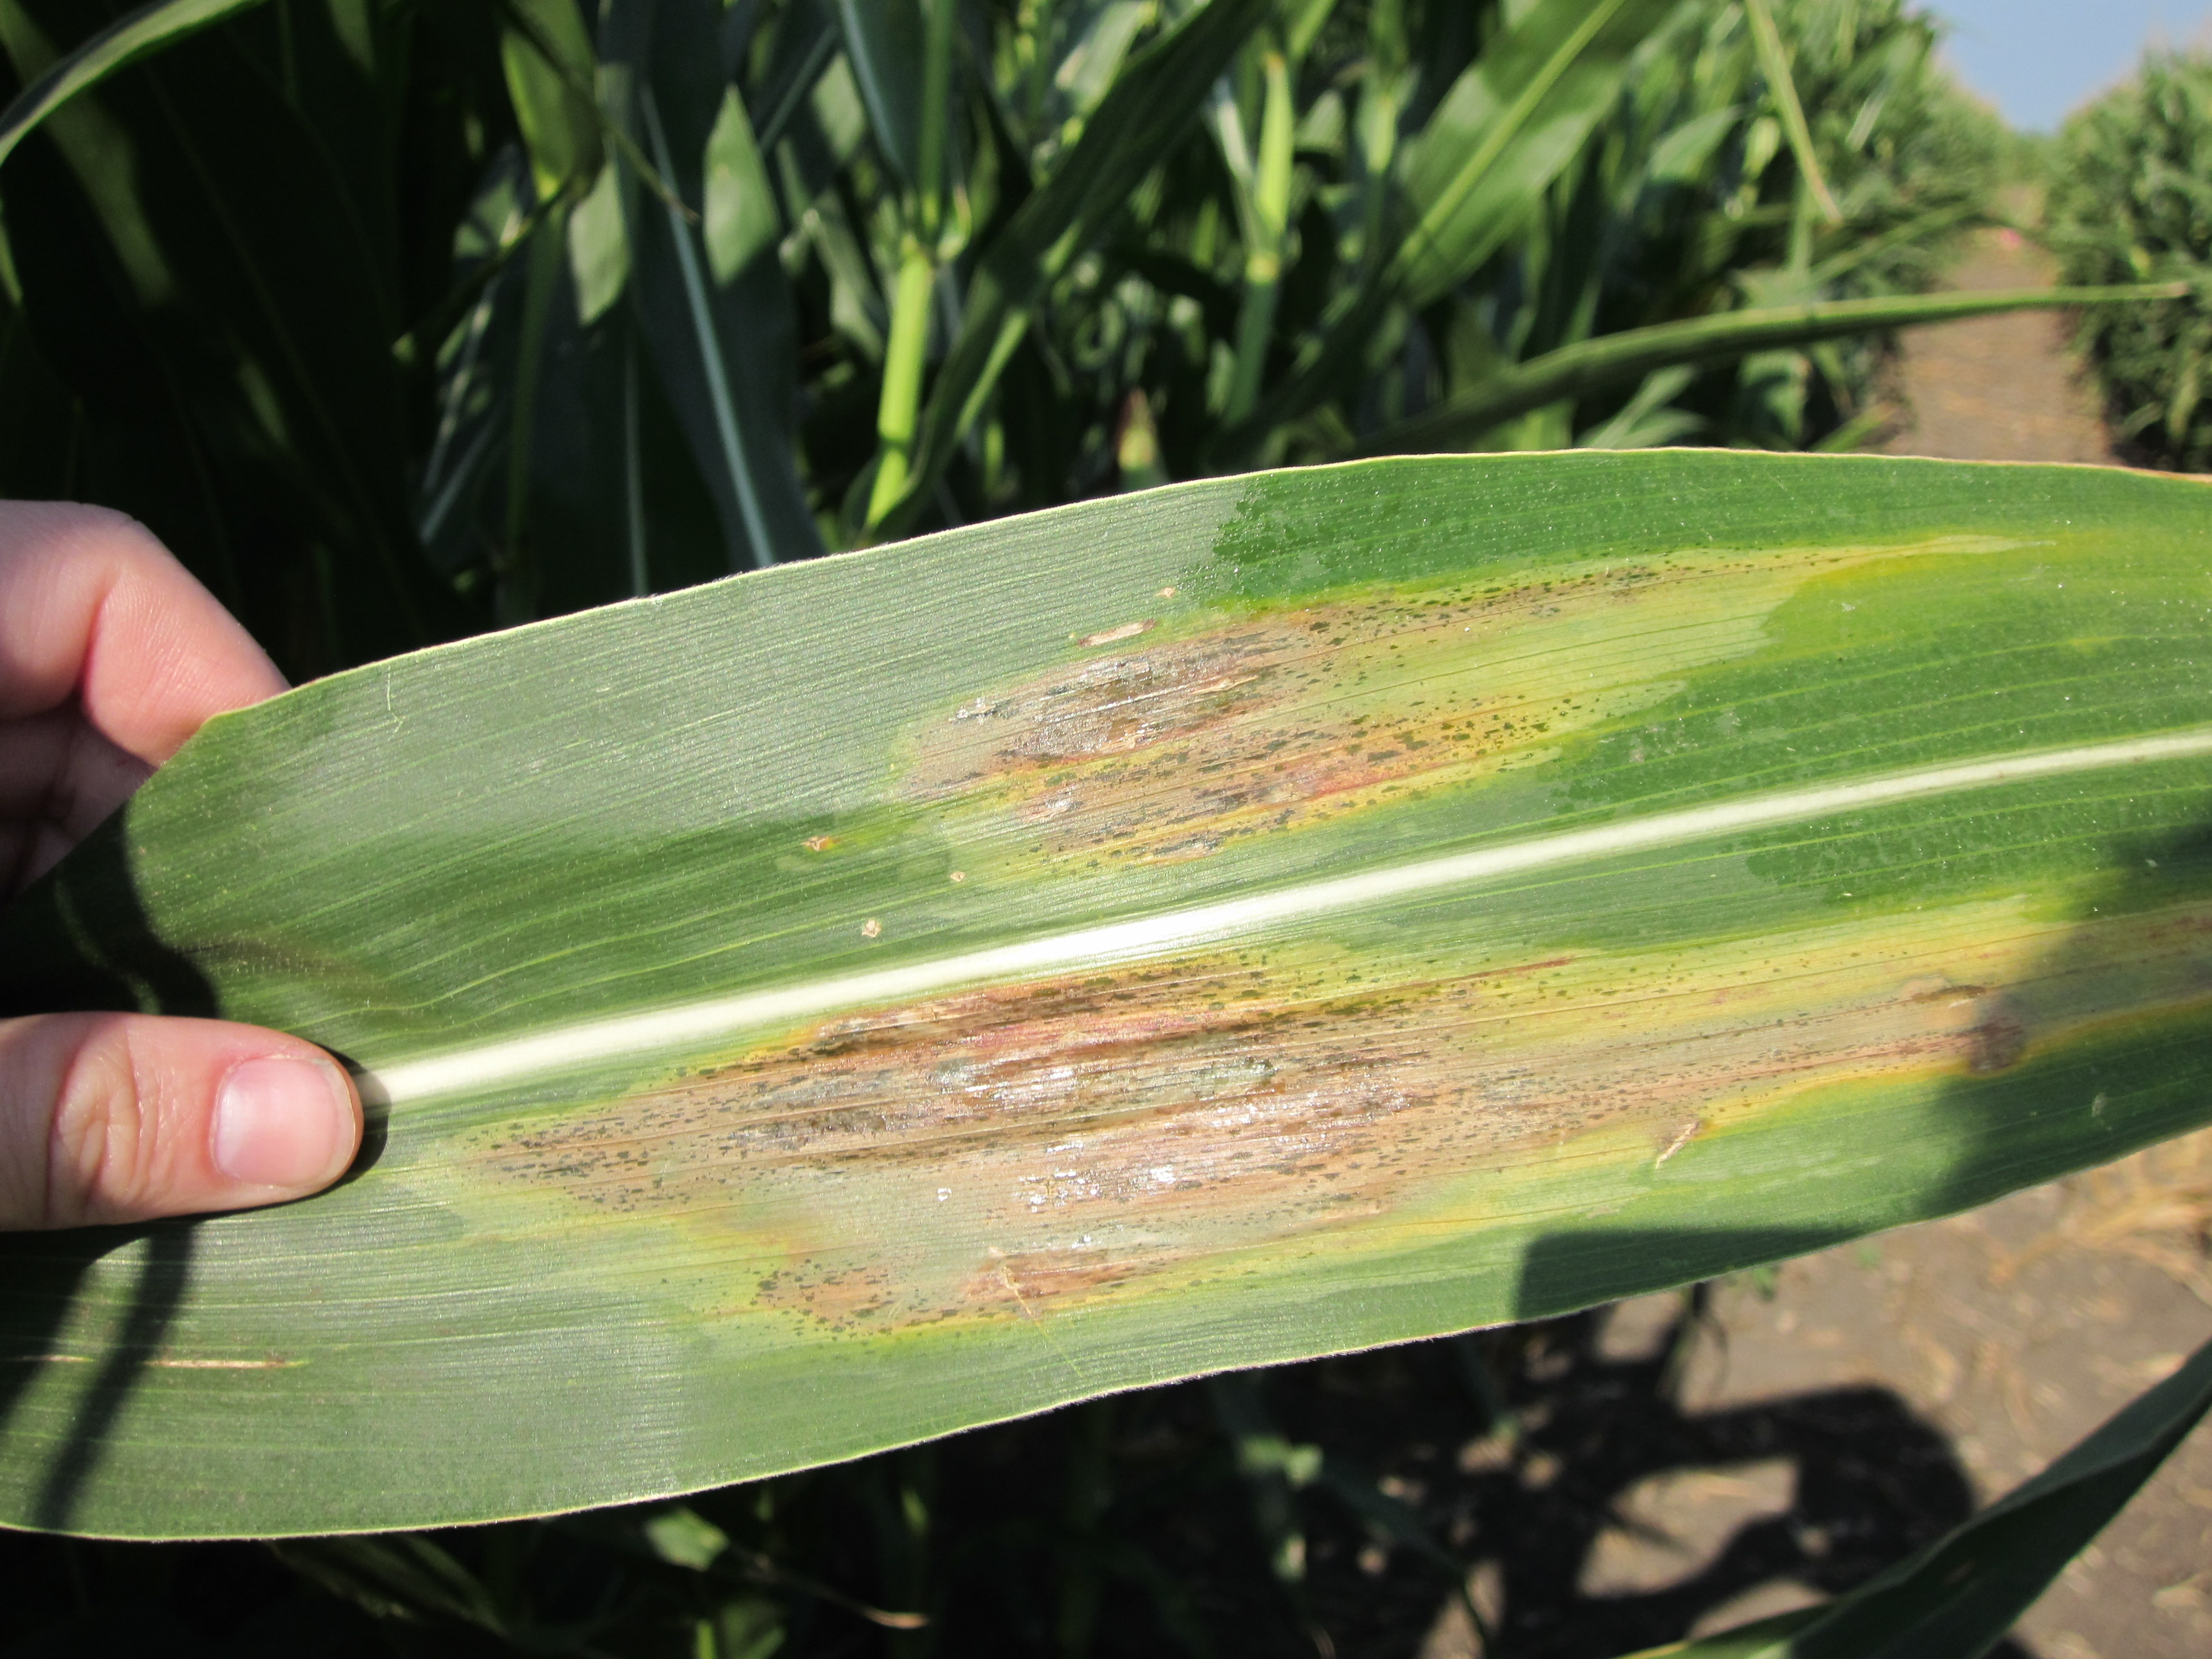
Figure 2. Bacterial ooze on leaves is a sign of Goss's wilt
It is important to remember that this disease MUST be diagnosed with at least two methods: microscopic observation of bacterial streaming from symptomatic tissue, and confirmation of the causal bacteria using organism-specific tests. In-field testing is possible with an immunostrip test marketed by the company Agdia, Inc. <http://www.agdia.com/>. However, there are limitations to these in-field tests, and it is not recommended to rely solely on a positive diagnosis based on immunostrips. Sample contamination can occur in the field, and samples may occasionally test positive with the strips when leaves are not actually infected with the Goss’s wilt bacterium. Because of the potential for these false positives, it is important that any sample that tests positive in the field for Goss’s wilt is sent to a diagnostic lab for additional microscopic observation. Plants that are not infected with the bacterium will not exhibit this bacterial streaming, and Goss’s wilt can be ruled out.
Make sure to accurately diagnose Goss’s wilt before deciding on management options. In-season management is limited and may not be warranted depending on the growth stage and yield potential of the crop. Fungicides are not recommended to use for management of Goss’s wilt since it is a bacterial disease. Management options include tillage and rotation to help reduce the bacteria population present in the field for the subsequent corn crop. Residue can harbor bacteria for years, and so it is important to choose a hybrid that is less susceptible to plant into fields with a history of the disease.
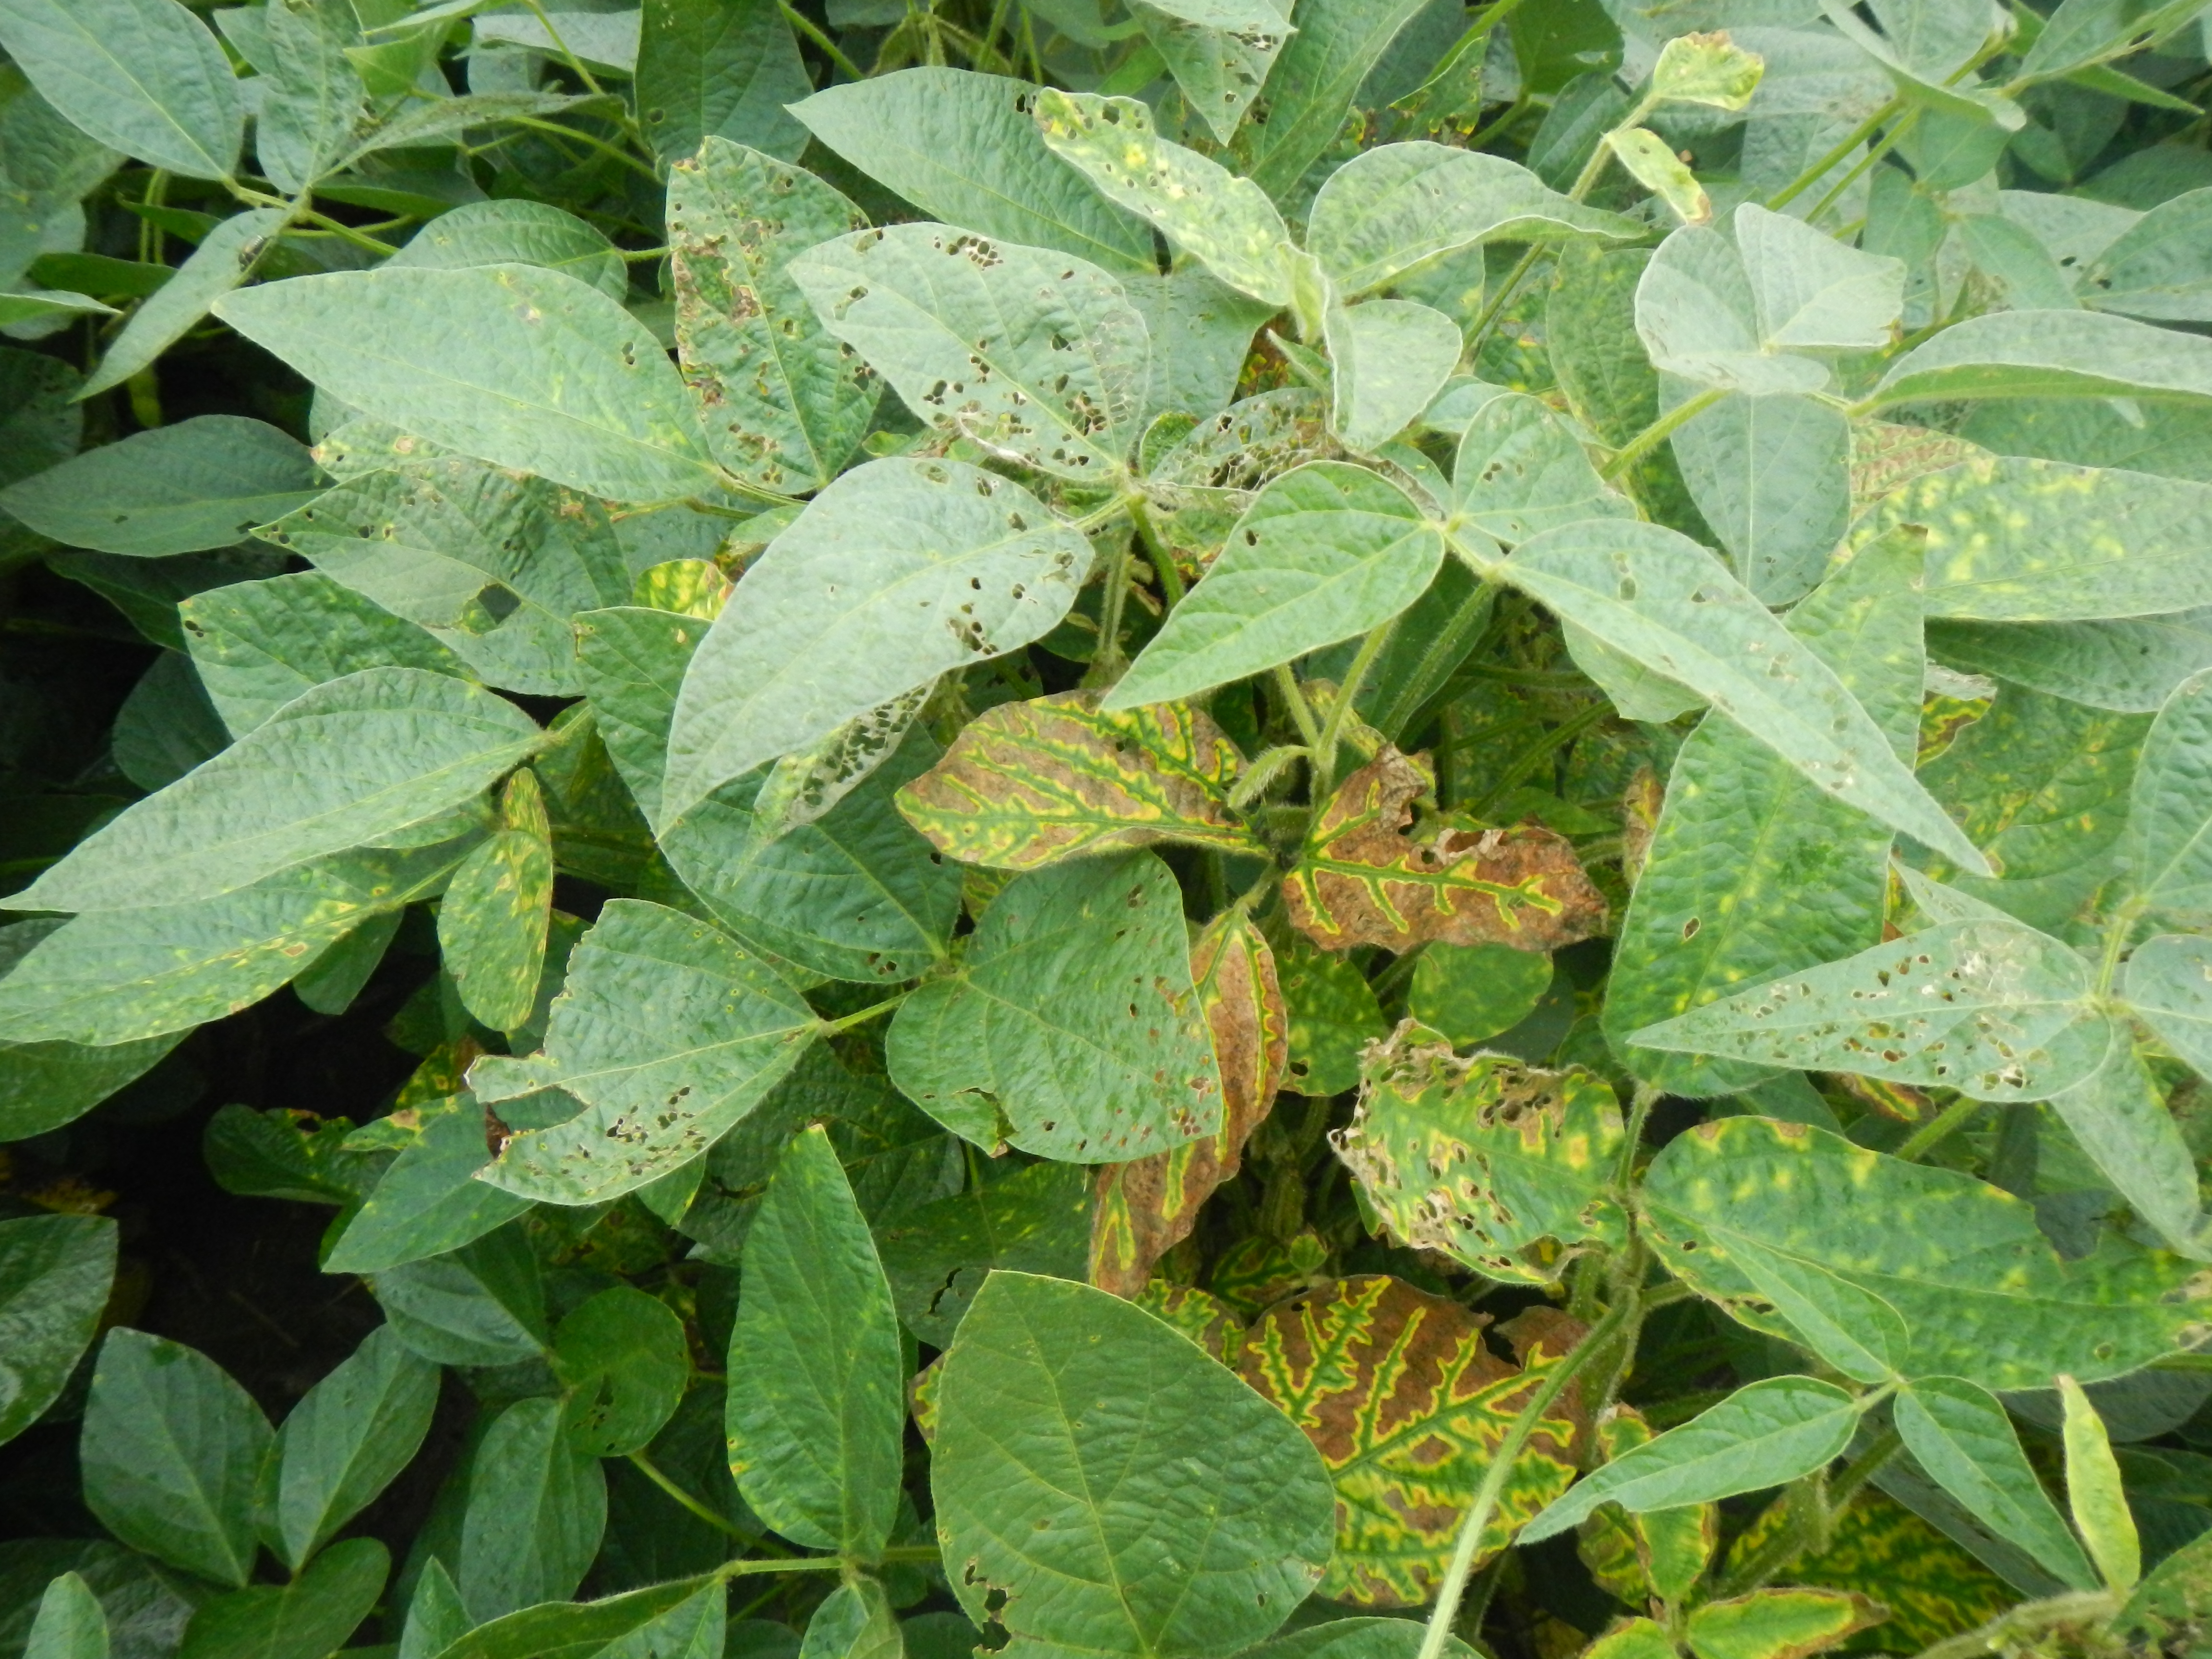
Sudden Death Syndrome and Brown Stem Rot in Soybean – (Kiersten Wise) - Sudden death syndrome, or SDS, has been observed in soybean fields in Indiana over the last week. The fungus that causes SDS, Fusarium virguliforme, infects soybean early, and symptoms are typically expressed later in the growing season. Many soybeans throughout Indiana emerged from wet soils this spring, and growers should be watching for symptoms of SDS in fields over the next few weeks. Figure 1 and 2. Foliar symptoms of sudden death syndrom (SDS) on soybean leaves SDS and BSR are diseases best managed through preventative methods. Producers are encouraged to plant varieties that are less susceptible to SDS and BSR in fields with a history of the disease. However, varieties that are resistant to SDS may not be resistant to BSR, so it is important to properly diagnose plants in each field. SDS is typically more problematic in early-planted soybeans, although if soil and weather conditions are favorable for infection, later planted soybeans are also at risk for disease development. Other factors such as soil compaction and high soybean cyst nematode populations may increase severity and impact of these diseases. Foliar fungicide applications are not recommended for management of SDS or BSR. For help in determining if SDS or BSR is present in fields, please view the following video filmed previously by the Purdue IPM team: Soybean Disease: Sudden Death Syndrome
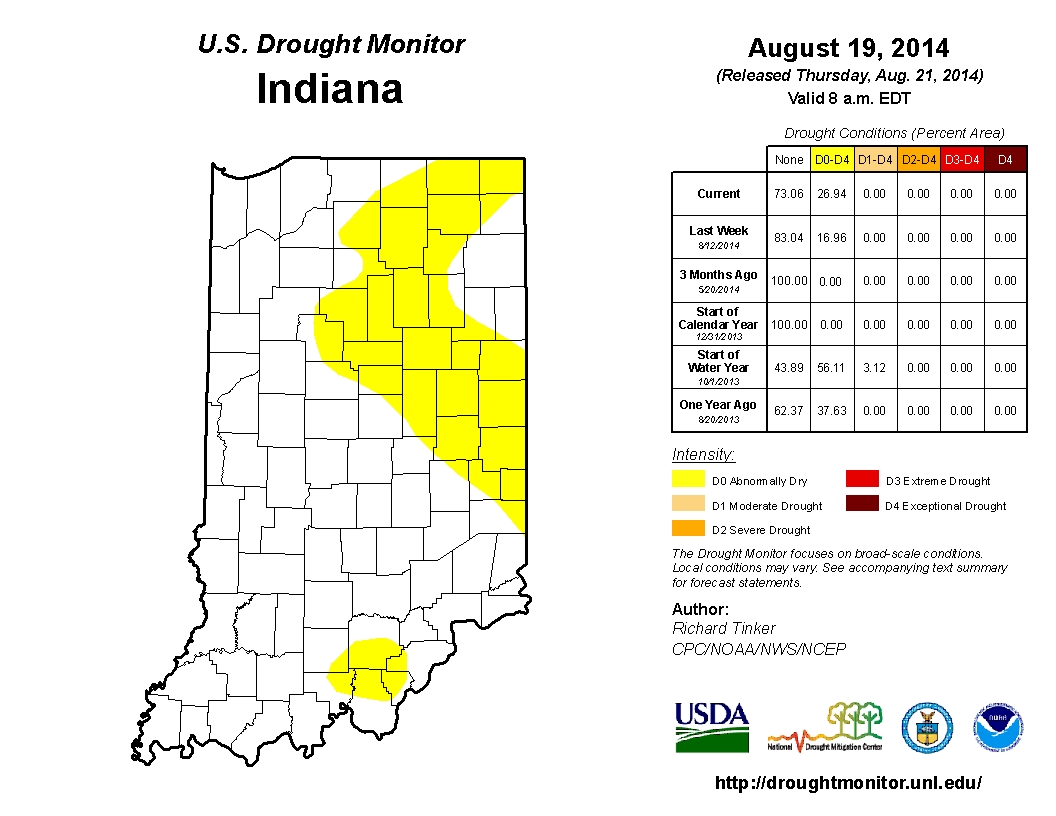
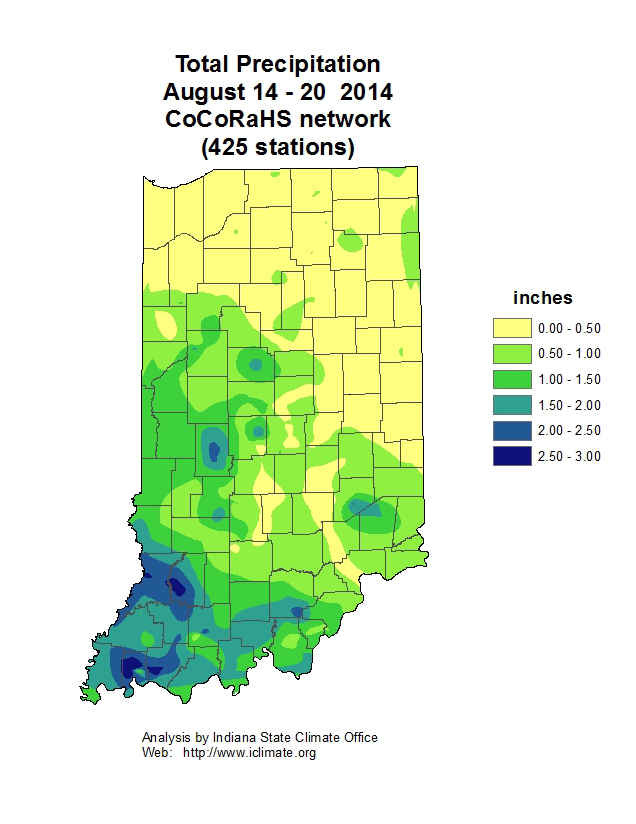
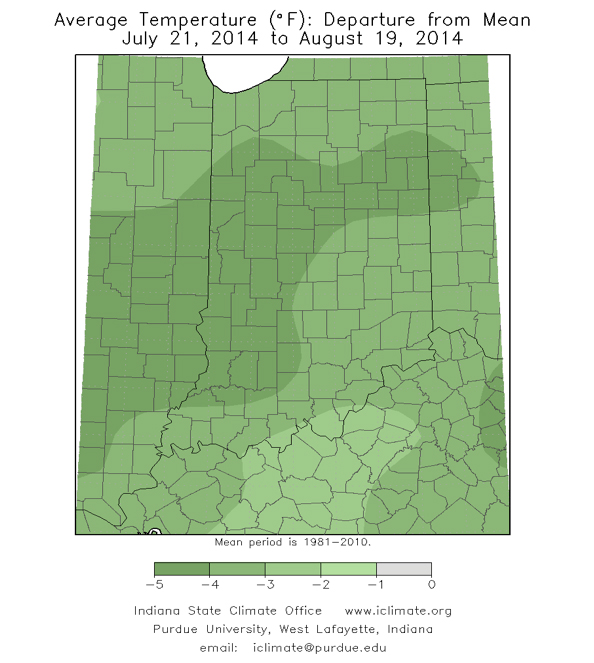
Purdue is involved in a multi-state project funded by the North Central Soybean Research Project to improve our understanding of the fungus that causes SDS and develop new management practices for the disease. To see how we conduct research on SDS, please view the following video: Studying Sudden Death Syndrome Management in Soybean. Simplified Soybean Yield Estimation. Individual plant production will vary and we must take a representative sample without being extraneous. Every field will have variations based on soils, pests, fertility, and other factors. I have simplified the process of estimating soybean yields, so that you can scout multiple areas quickly while maintaining representative estimates. The system is based on 1/10,000th acre and the following formula: Pods X Seeds Per Pod divided by Seed Size Factor = Estimated Bushels Per Acre Step 1 – Pods Figure 1. Number of rows to count to equal 1/10,000th of an acre. We certainly have other row widths, and this simplified system can be adapted to your row width. If you have a different row width, divide 627.26 by your row width (inches) to calculate the linear length (inches) of 1 row to equal 1/10,000th acre. For example, an 18-in row width would require 34.8 inches of 1 row to equal 1/10,000th acre (627.26 18 inches). This simplified system is more reliable when you have 8 or more plants in the sampled area, which translates to 80,000 plants per acre. If plant stands are less than 8, you should count additional areas to decrease the variability of the overall yield estimate for the field. If you want to have an idea of final plant stand, multiply the number of plants sampled by 10,000. However, you do not need plant population to estimate yield with this approach. You will count the total number of pods in the 1/10,000th acre. You will need to use discretion to which pods you will include in the count. A good rule of thumb is to count the pods that are R5 or larger, with the knowledge that some of the smaller pods may or may not make it. The starting point is an average of 2.5 seeds per pod, since there can be a range of 1-, 2-, 3-, and 4-seeded pods. This value is conservative since we do not know exactly how the rest of the season will finish. The soybean plants may arrest seed development on several 3-seeded pods or some pods are aborted completely. You can quickly increase or decrease the yield estimate by changing this one value. You can more confidently adjust this value because you are more likely to remember the frequency of 2- or 4-seeded pods within a few hundred pods. Examples: Good early soybean growth, fair pod retention, BUT little late season moisture. Fair soybean growth, limited pod retention, BUT good late season moisture. Temperature Effects for Soybean Reproduction - (Shaun N. Casteel) - Soybeans like it warmer in the evening so that it can “burn” (respire) the stored energy (photosynthates that are stored as starch) and grow. If the stored energy is not burned one night, it will be left in the tank for the following day. Then, the tank is already partially filled (inhibition feedback to photosynthesis) so soybean may not fully utilize the new day’s supply of sunlight. A few days of this pattern is not detrimental, but it will eventually compound if the pattern persists. In other words, leaf/node development could be delayed, pod production limited, and seed fill is slowed due to low photosynthate production. Nightly temperatures have dipped into the 50s frequently in July and August with even several nights in the mid-40s over the past few weeks. In some cases, the cooler weather has been a bit of a saving grace due to limited rainfall over the past 30 days, especially in the northern third of Indiana (Fig. 2). Figure 1. July 2014 average temperature (°F) across the Midwest (HPRCC, 2014). It is difficult to predict the yield impact of the cooler temperatures over the past several weeks, because of the ability of soybean to compensate among pods and seed size. However, some studies have provided insight to the response of soybean to various temperatures near reproductive development. A chilling treatment of 50°F (constant temperature) for one week during early reproduction stages reduced pod production by increasing abortion of flowers (Musser et al, 1983). Pollen malformation, reduced pollen production, and sterility of pollen are some of the potential causes of the loss of flowers following the chilling treatment. The recovery of soybean to develop flowers was not affected by the cool temperatures when imposed early in reproduction. Soybeans were able to recover a larger portion of their photosynthetic capacity when the cool temperatures (2 or 3 nights of 41°F) occurred at R2 (full bloom) compared to R6 (full pod) (Purcell et al., 1987). The greater recovery rate was most likely linked to more nutrient reserves in the leaves at R2. Nutrients were remobilizing from leaves to pods and seeds at R6, and thus, leaf nutrient reserves were low. In Egli and Warlaw (1980) study, normal temperatures were maintained until R5.5 then various temperature treatments were imposed until R8 (maturity). Seed fill was lowest for the cool temperature regime (64°F during day and 55°F during night), which also resulted in the smallest seeds and delayed maturity. The greatest seed growth rate was under 80/72°F regime with good seed sizes and no delay in maturity. As previously mentioned, the cascading effects of cool temperatures on photosynthetic capacity would certainly influence the rates of pod elongation and seed fill. Slow growth rates can start to become an issue as we progress to autumn with shorter and shorter days (and temperatures continue to decrease). The past week has been much warmer with a supply of water. Soybeans will respond to the shift in weather with more emphasis on growth of pods and seeds than development of new flowers or pods. Again, soybean can compensate for the shortcomings that occurred in many fields during early to mid-reproduction provided the warmer weather continues and the soils have water to supply. Extended periods of cool temperatures during late stages of development (R5 to R6) will certainly influence seed fill and most likely yield. References HPRCC 2014. Midwest average temperatures for July 1 to 31, 2014. <http://www.hprcc2.unl.edu/~sorensen/u2umaps/Last1mTDataU2U.png>.![]()
Symptoms of SDS are expressed as interveinal yellowing and necrosis (Figures 1 and 2). Veins of symptomatic leaves will remain green. Leaflets will curl or shrivel and drop off with only the petiole remaining. The disease brown stem rot (BSR) has also been identified in Indiana. Foliar symptoms of this disease can resemble foliar symptoms of SDS and it is important to split the lower stem of symptomatic plants to determine which fungal disease is present. BSR can cause internal stem browning, resulting in a dark brown discoloration of the pith at the lower nodes of the plant. The pith of plants affected by SDS will remain white, while the tissue below the epidermis will have brown to gray discoloration present. 
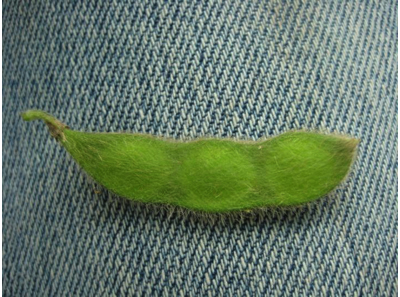
Count the number of pods in 1/10,000th of acre. Yes, 1/10,000th of acre! Nearly 90% of our Indiana soybean acres are planted in 30-, 15-, or 7.5-in rows, so just remember 21. You will count the number of pods in 1 row for 30-in width, 2 rows for 15-in width, or 4 rows for 7.5-in width to equal 1/10,000th acre (Figure 1). Each one of these counts will be 21 inches in length.

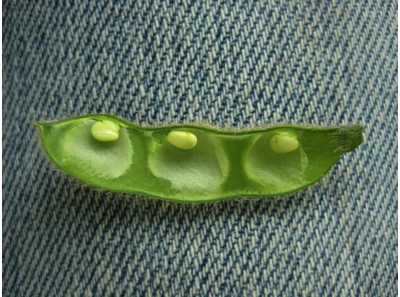
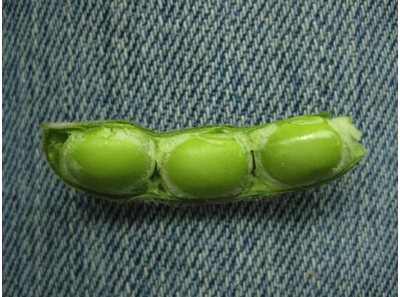
Step 2 – Seeds Per Pod
Step 3 – Seed Size Factor
The starting point is seed size factor 18, which equals a fairly representative seed size of 3,000 seeds per pound. If you expect larger seeds (maybe from late season rains) you will use a smaller seed size factor such as 15 (2,500 seeds per pound). Similarly if seed fill will be limited (i.e., small seeds) due to lack of water or other late season stresses, you should use a larger seed size factor like 21 (3,500 seeds per pound).
Table 1. Seed Size Factors.
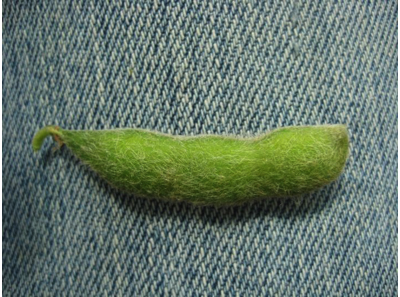
Good soybean growth, good pod retention, and adequate late season moisture.
![]()
This growing season has been anything, but normal or perhaps, that is normal. The abnormally cool temperatures have been the characterizing feature until the past few days. The average temperatures in July were 4 to 6°F cooler than normal with pockets that were 6 to 8°F below normal across Indiana and Illinois. The northern half of Indiana averaged 66 to 70°F in July while the southern half averaged a couple degrees warmer (Fig. 1). We personally enjoyed this cooler weather, but questions arise regarding the effects to our crops. Corn tends to respond more favorable to warm day and cool nights (overall growth and development, pollination, etc.) than soybean. 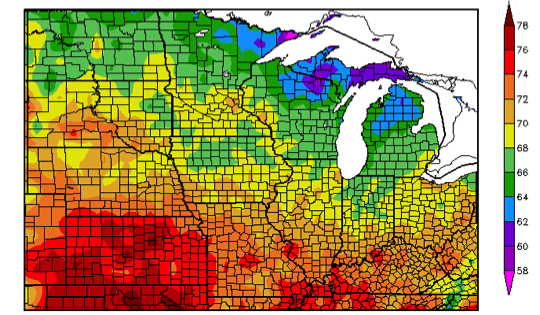

Musser, R.L., S.A. Thomas, J.F. Thomas, and P.J. Kramer. 1983. Effects of shoot chilling during floral initiation and development of “Ransom” soybeans. Plant Physiol. Suppl. 72:43.
Purcell, L.C., D.A. Ashley, and H.R. Boerma. 1987. Effects of chilling on photosynthetic capacity, leaf carbohydrate, and nitrogen status of soybean. Crop Sci, 27:90-95.
Egli, D.B. and I.F. Wardlaw. 1980. Temperature response of seed growth characteristics of soybeans. Agron. J. 72:560-564.
![]()
![]()