
USDA-NIFA Extension IPM Grant
Pest & Crop Newsletter, Entomology Extension, Purdue University
Corn Stalk Nitrate – Research Update – (Jim Camberato) –
The cornstalk nitrate test (CSNT) is recommended as an end-of-season assessment of an N management program (N source, timing, placement, and rate). For this diagnostic test, 15 or more 8-inch stalk segments (beginning 6 inches above the soil surface) are taken from representative areas of a field within a few weeks after blacklayer and analyzed for nitrate-nitrogen (NO3-N). Accumulation of NO3-N in the lower corn stalk results from N availability exceeding crop N utilization. More details on the test can be found in Extension Bulletin AY-322-W.1
The CSNT was developed at Iowa State University in the late 1980’s and the interpretation of cornstalk NO3-N concentrations used in Iowa differs very little from that used in Indiana. Iowa State Univ. considers less than 250 parts per million (ppm) NO3-N to be low, 250 to 700 ppm to be marginal, 700 to 2,000 ppm to be optimal, and greater than 2,000 ppm to be excessive.2 Previous research conducted in Indiana in 1996 and 1997 concluded that NO3-N concentrations between 450 and 2,000 ppm were associated with optimal N availability while concentrations greater than 2,000 ppm NO3-N indicated N availability was excessive.1
The relationship between cornstalk NO3-N and relative yield from the most recent Indiana N response trials (23 location-years conducted in 2007-2009 and 2011-2012) (Fig. 1) are quite similar to the earlier findings in both Iowa and Indiana (despite 30+ years of hybrid improvement) suggesting similar interpretations are relevant today. Most of these studies were conducted with at-planting or sidedress N application as 28% urea-ammonium nitrate. Although the timing and form of N were not found to alter the relationship between cornstalk NO3-N in earlier Iowa and Indiana research recent research conducted by the On-farm Network, Iowa Soybean Association suggests the fall application of manure may need to be evaluated differently (more on this later).

Figure 1. Stalk nitrate-N relationship to relative yield for 23 location-years of N trials conducted in Indiana from 20070-2009 and 2011-2012. Within each location and year the yield of an individual N rate treatment was related to the predicted maximum yield at that location in that year.
The recent Indiana data was categorized by cornstalk NO3-N and for each category the average relative yield and the average difference in fertilizer N rate relative to the N rate needed to maximize yield was determined. Seventy-two percent of cornstalk samples had NO3-N concentrations below 250 ppm (Table 1). Relative yield in this NO3-N category ranged from 25 to 110% of maximum yield (Figure 1), averaging 82%. All relative yields less than 80% of maximum yield were associated with cornstalk NO3-N concentrations less than 250 ppm (Figure 1). However, many N rate treatments producing maximum yield also had less than 250 ppm cornstalk NO3-N. Therefore, a low level of cornstalk NO3-N does not necessarily mean the crop was short of N.
| Table 1. Relative yield (as % of predicted maximum yield within each of 23 location-years) and N rate deficit (-) or excess (+) (relative to the N rate needed to maximize yield in that location-year) for various categories of end-of-season corn stalk NO3-N. Individual data points are shown in Fig. 1. | |||
| Category of corn stalk NO3-N, ppm | Number of observations | Average % of predicted maximum yield | N deficit (-) or excess (+), pounds per acre |
| ≤250 | 490 | 82 | -90 |
| 250 - 500 | 33 | 98 | -21 |
| 501 - 1,000 | 35 | 98 | -31 |
| 1,001 - 1,500 | 19 | 98 | -25 |
| 1,501 - 2,000 | 25 | 98 | 2 |
| 2,001 - 2,500 | 34 | 100 | 29 |
| 2,501 - 3,000 | 23 | 100 | 31 |
| 3,001 - 4,000 | 12 | 100 | 25 |
| ≥4,000 | 7 | 101 | 74 |
Cornstalk NO3-N concentrations between 250 and 2,000 ppm were associated with relative yields greater than 80% of maximum yield (Figure 1) and an average relative yield of 98% for each category in this range of cornstalk NO3-N (Table 1). Nitrogen rate deficits for cornstalk NO3-N categories between 250 and 1,500 ppm ranged from 21-31 pounds of N per acre (Table 1). Adequate N (<2 pounds per acre excess) was associated with cornstalk NO3-N of 1,501-2,000 ppm (Table 1).
One-hundred percent of maximum yield and an excess N application of 25-31 pounds of N per acre were associated with cornstalk NO3-N concentrations between 2,001-4,000 ppm (Table 1). Only 7 cornstalk samples had NO3-N greater than 4,000 ppm. The average excess N application was 74 pounds of N per acre for this category.
Using the end-of-season cornstalk nitrate test to adjust fertilizer-based N management programs
Multiple seasons of CSNT evaluation are warranted before altering an N management program because the optimum N rate varies from season to season. Many factors affect the optimum N rate; including differences in soil N supply, loss of N from the rootzone, hybrid differences in N use, pest and weed impacts on N use, and the interaction of these and other factors. The average correct N rate for maximizing profit over the long term3 is almost certainly wrong in any one season – either too much or too little. Thus the evaluation of a N management system with the CSNT (or any other N assessment tool) on any given field in a single season is interesting, but not particularly useful in making management decisions for future years. Unfortunately, there is no concrete guidance on how many years the CSNT should be conducted, but I would suggest three or more seasons to be reasonable.
Although it would be great to have applied the optimum N rate every year it is not likely to be possible. Unfortunately there is no concrete guidance on what level of N excess should trigger a reduction in N application rate. In my opinion plus or minus 20-30 lb N/acre is normal variation in optimum N rate from year to year for a particular cropping system. Based on the most recent Indiana research a NO3-N concentrations in excess of 4,000 ppm might represent excessive N application rates (74 lb N/acre excess). Unfortunately this estimate of excess N is based on only 7 samples. Ongoing research will hopefully add to this analysis after harvest this season.
If end-of-season cornstalk NO3-N concentrations are consistently less than 250 ppm or more than 4,000 ppm one might consider conducting N response strip trials, rather than rely solely on the CSNT to evaluate the current N management program. Guidelines on conducting suitable N response trials can be found at: <http://www.agry.purdue.edu/ext/ofr/protocols/PurdueNTrialProtocol.pdf>.
Using the end-of-season cornstalk nitrate test to adjust manure-based N management programs
Recent research conducted by the On-farm Network, Iowa Soybean Association suggests the current Iowa and Indiana interpretations of optimal and excessive N may be incorrect when fall-applied manure is the N source. Results of 52 trials with fall-applied manure showed that when cornstalk NO3-N was 3,500 ppm or less there was a greater than 50% probability of having had a profitable response to additional N.4 Conducting strip trials to assess N response in manure-based N management programs would definitely be encouraged in light of these findings. Interestingly the Iowa Soybean Association research with fall, spring, or sidedress fertilizer applications found a 50% probability of a response to additional N occurred at 500 ppm - well within the current interpretation used in Iowa and Indiana.
References Cited
1Cornstalk testing to evaluate the nitrogen status of mature corn: Nitrogen management assurance. Sylvie M. Brouder. Purdue University Coop. Ext. Ser. AY-322-W. <http://www.agry.purdue.edu/ext/pubs/AY-322-W.pdf>.
2Cornstalk testing to evaluate nitrogen management. A.M. Blackmer and A.P. Mallarino. Dep. Agronomy, Iowa State Univ. PM1584. <http://www.extension.iastate.edu/Publications/PM1584.pdf>.
3Nitrogen management guidelines for corn in Indiana. J. Camberato, R.L. Nielsen, and B. Joern. <http://www.agry.purdue.edu/ext/corn/news/timeless/NitrogenMgmt.pdf>.
44R management: Differentiating nitrogen management categories on corn in Iowa. Peter M. Kyveryga and Tracy M. Blackmer. Better Crops/Vol. 97 (2013, No. 1, p. 4-6). <http://www.ipni.net/publication/bettercrops.nsf/0/862AC3550E6594C385257B18005B7
A41/$FILE/4.pdf>.
![]()
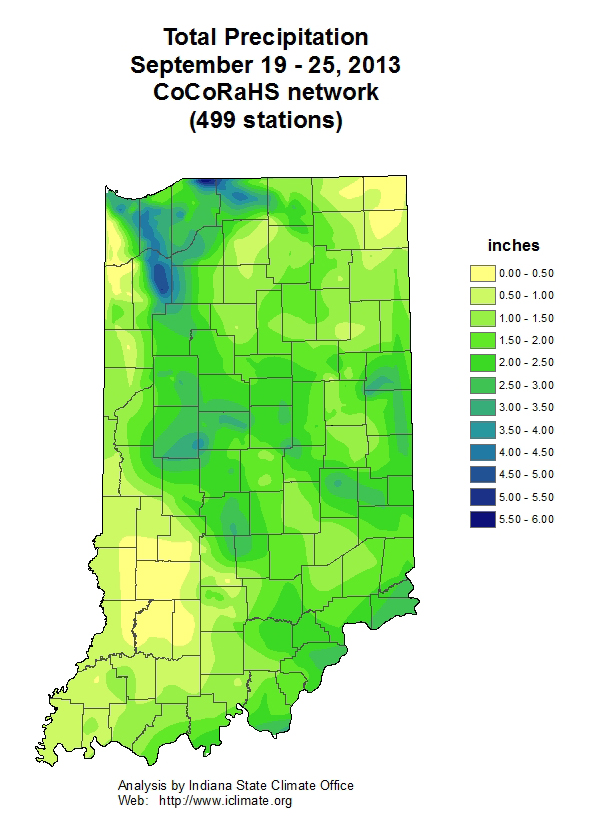
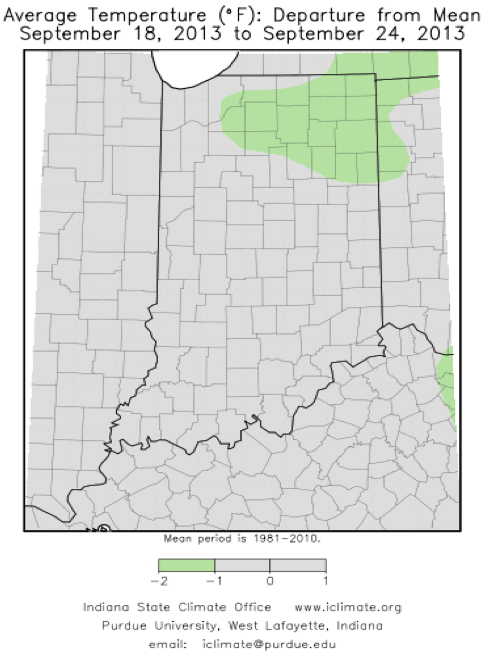
The weather pattern has trended back toward normal after the hot and dry spell of August and early September.
Temperatures into the first week of October will run slightly above normal. At the same time weather systems have become progressive again which will give us a few rain chances over the next 2 weeks but rainfall totals will not be too far from normal so field work should be able to proceed. The next rain system will occur for the second half of the weekend. Another system should arrive late next week or the first weekend of October. Again, rainfall will be close to normal into early October.
There are some indications rainfall will go to above normal starting around mid October possibly lasting into November. The more crops are harvested as early as possible probably the better. The latest 16-day rainfall totals from the NOAA/NWS Ohio River Forecast Center can be found here:
<http://www.erh.noaa.gov/ohrfc/HAS/images/NAEFS16day.pdf>.
![]()
![]()