
USDA-NIFA Extension IPM Grant
Pest & Crop Newsletter, Entomology Extension, Purdue University
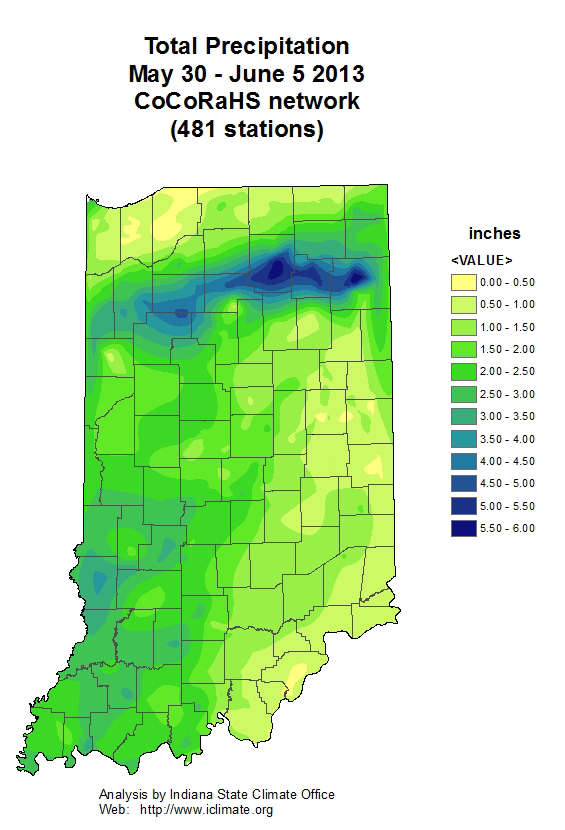
Corn Rootworm Hatch Has “Officially” Begun in West Central Indiana - (Christian Krupke, John Obermeyer, and Larry Bledsoe)
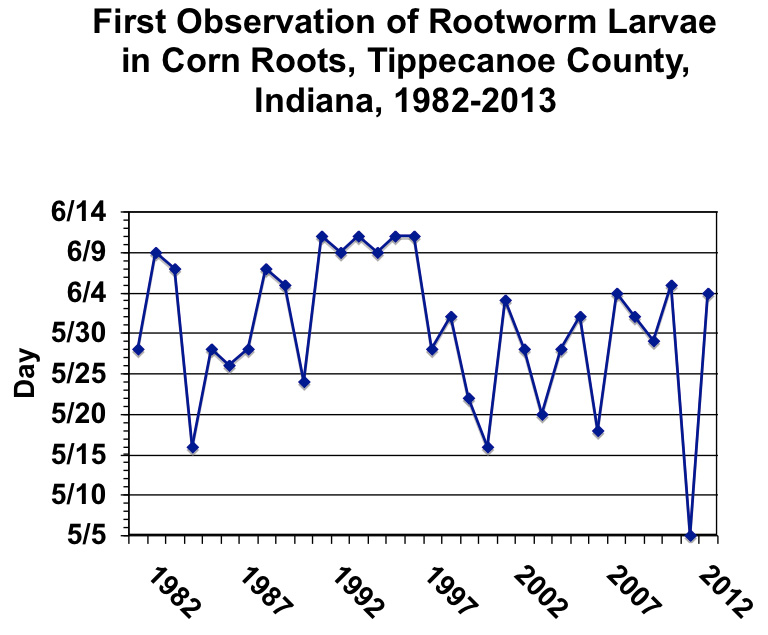
• Hatch of rootworm in west-central Indiana occurred
on or around June 4.
• Rootworms will continue to hatch for several weeks.
After searching through many hundreds of seedling roots from last year’s rootworm trap crop area (late-planted corn in 2012), the first larva was found on Thursday, June 6th. Judging by its size, it emerged earlier in the week, likely Tuesday the 4th. This date is just the beginning of hatch, and really has little significance to producers it just reassures us that rootworms are still here and we’re not planting our research plots for nothing. Rootworm egg hatch period is very prolonged, partially because eggs are laid at a variety of depths/temperatures. This year, the peak (highest activity) hatch will likely occur in late June.
The biggest question is what potential risk for rootworm damage exists this year. As explained many times, rootworm eggs are very durable and generally over-winter quite well…no matter how cold or wet they get. In contrast, newly-hatched larvae are the vulnerable stage in the biology of this pest. They are especially susceptible to drowning in wet soils and starvation if they cannot orient to find growing corn roots in saturated soils. They need to feed within 24 hours after hatching, so this period is critical. With 2012 being an exception, several springs before that were notoriously wet during the late weeks of May and early weeks of June, when most larvae were hatching. That translates into lower pressure, good news for Indiana corn producers. Obviously this story will be played out further during the next several weeks. Please keep us informed of your observations.
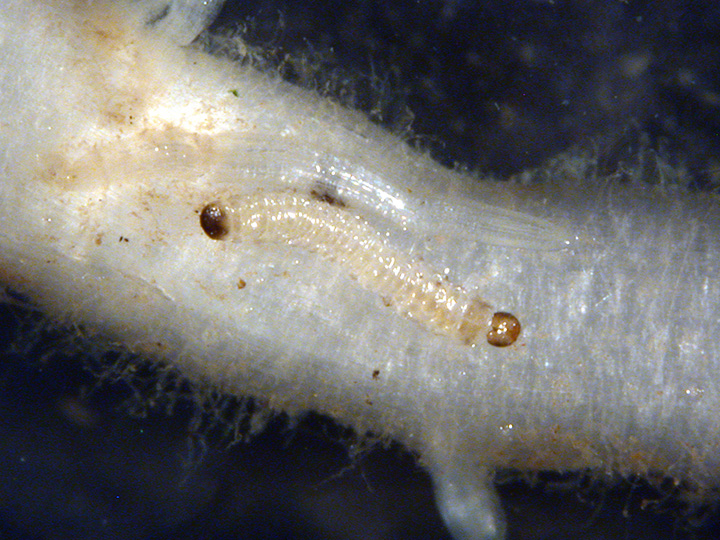
Recently hatched rootworm on root exterior
![]()
Smattering of Insect Damage Reports – (Christian Krupke and John Obermeyer)
We always appreciate “bug” reports from pest managers that are walking the fields. Fortunately for producers, so far this year, it has been rather quiet. However, there are some isolated areas fighting various secondary, or infrequent, pests. This years’ list includes Asiatic garden beetle grubs, armyworms, and slugs. However, with this week’s good growing conditions, young plants will not be susceptible to these early season pests much longer. Thanks to those that have kept us informed…Happy Scouting!
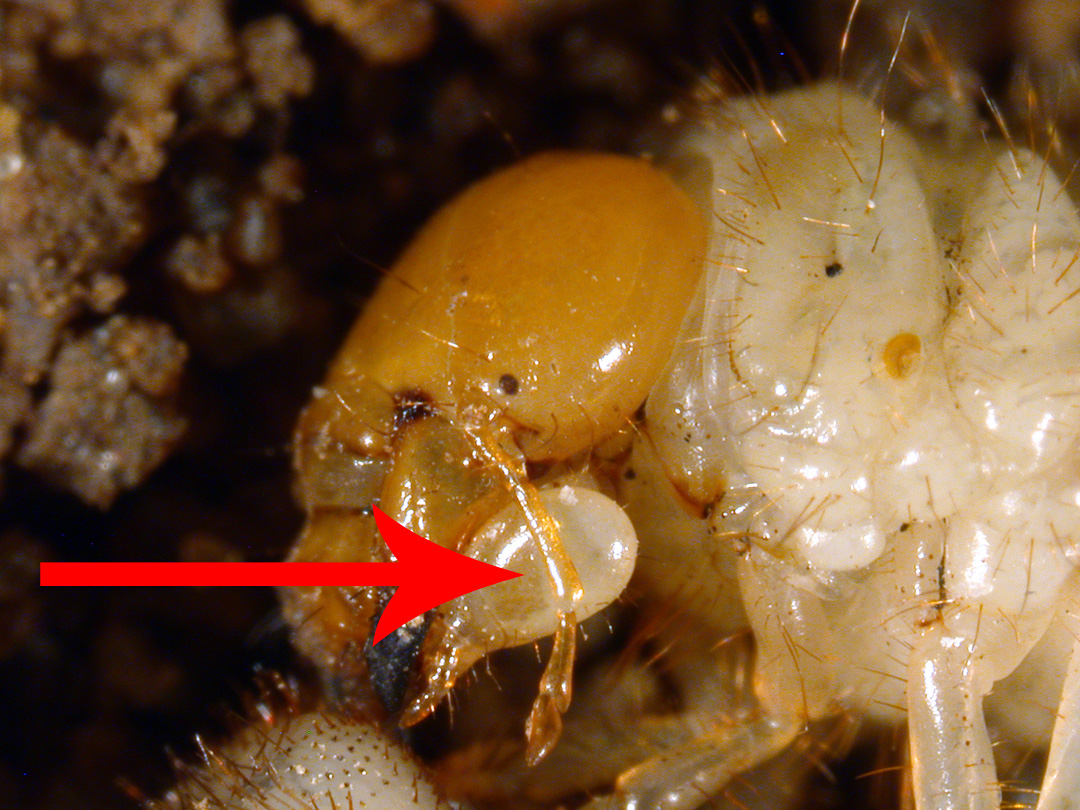
A key characteristic of the Asiatic garden beetle grub, enlarged maxillary palps
![]()
Click here to see the Black Light Trap Catch Report
![]()
Distinguishing Spots on Corn: Holcus Leaf Spot vs. Gramoxone Drift – (Kiersten Wise, Travis Legleiter, and Gail Ruhl)
Round, pale, necrotic lesions have been reported on corn in Indiana. Two issues can cause this type of symptom: a disease called Holcus leaf spot, and herbicide drift.
Symptoms of Holcus leaf spot, a disease caused by the bacterium Pseudomonas syringae pv. syringae, are characterized by round, discrete lesions that are initially pale yellow to white and then enlarge and turn gray or brown. Lesions have a water-soaked halo and on certain hybrids, the margin of the lesion may appear brown or purple (Figure 1). Lesions are typically distributed from the center to the tips of leaves (Figure 2). Gramoxone injury will produce similar symptoms on plants (Figures 3 and 4). To determine if it is Holcus leaf spot or drift, the following questions must be answered:
1. Is there a field nearby that received a burndown herbicide application?
Gramoxone is a broad-spectrum contact herbicide, meaning that it has efficacy on all plant species and only affects the parts of the plant that are contacted by the spray solution. Gramoxone can only be used as a burndown product in agronomic crops because of the broad-spectrum activity, so producers need to first look around at neighboring fields to determine where a burndown herbicide application may have been applied.
2. Is there an obvious pattern to the symptoms observed in the affected field?
If a field with a recent burndown application is identified, and a drift event is suspected, symptoms in the affected field should appear in a gradient of severity from the edge of the field moving inward. The highest density of symptomatic plants should be observed closest to the target site (field with the burndown application) and symptoms will decline in frequency and density as you move away from the target site. The pattern should also follow the same direction as the prevailing winds on the day of the drift event. In a drift event, necrotic lesions should also be observed on all plants present in ditches, road banks, and fence rows between the target site and the cornfield in question.
If symptoms do not follow a gradient across the field, and plants surrounding the field are not affected, it is possible that the symptoms are caused by the Holcus leaf spot bacterium. Plants diagnosed with Holcus leaf spot will be randomly scattered throughout the field, and severity may vary across the field and within a plant.
There is no concern of symptom spread from Holcus leaf spot or gramoxone drift. In a gramoxone drift event, only the parts of the plants that were exposed at the time of drift will be affected. Leaves emerging after the drift event will not exhibit symptoms. With Holcus Spot, the bacterium that causes the leaf spot enters the plant through wounds or through stomates during warm, rainy and windy weather. The bacterium will overwinter in infected residue, and also on other grass species, including weeds. It is not known to spread from infected leaves to healthy leaves.
Holcus leaf spot is seen sporadically in Indiana, and is not known to limit yield. Although the disease may cause concern based on symptom appearance, no in-season treatment is available or necessary. Fungicide applications will not have efficacy against this bacterial disease.
Samples may be submitted to the Purdue Plant and Pest Diagnostic Lab (PPDL) <http://www.ppdl.purdue.edu/contacts.html> for assistance with diagnosis.

Figure 1. Yellow and white lesions with a water-soaked halo are indicative of holcus leaf spot in corn.

Figure 2. Holcus leaf spot observed on centers and tips of leaves.
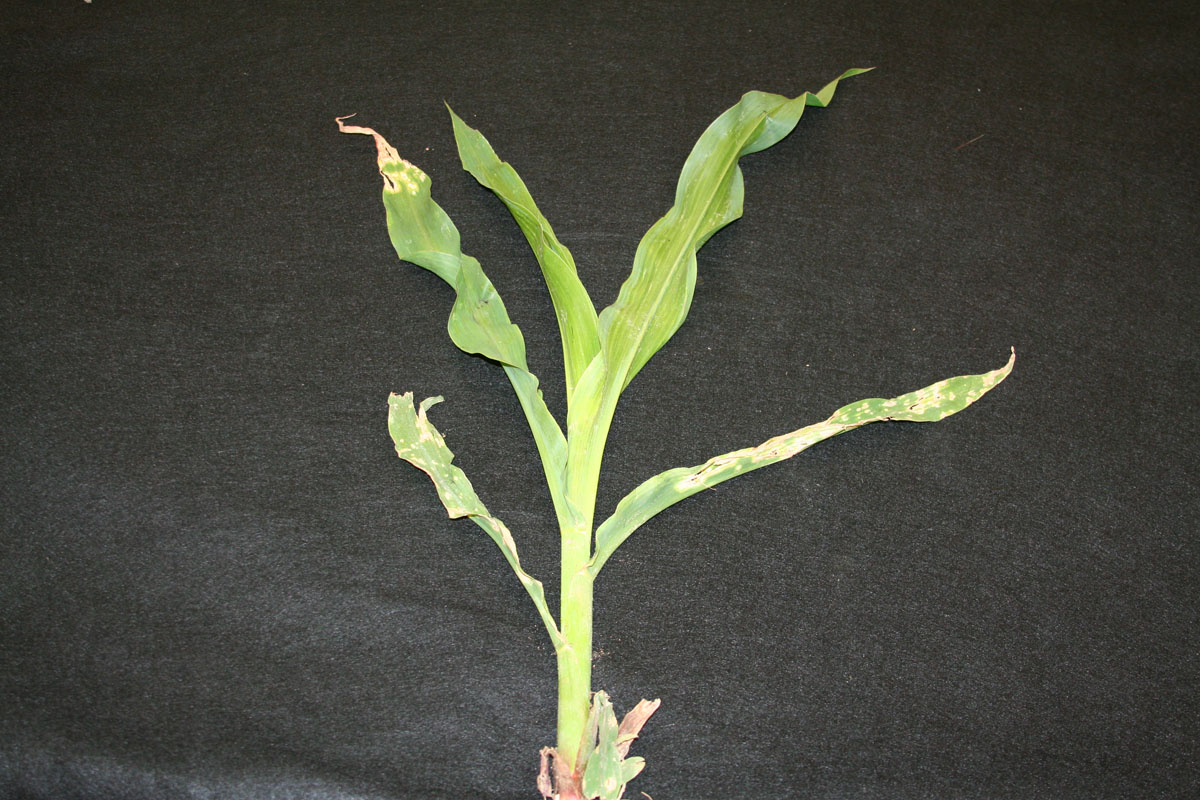
Figure 3. A corn plant with pale necrotic spots on older leaves and tips of newer leaves that were exposed to paraquat drift.
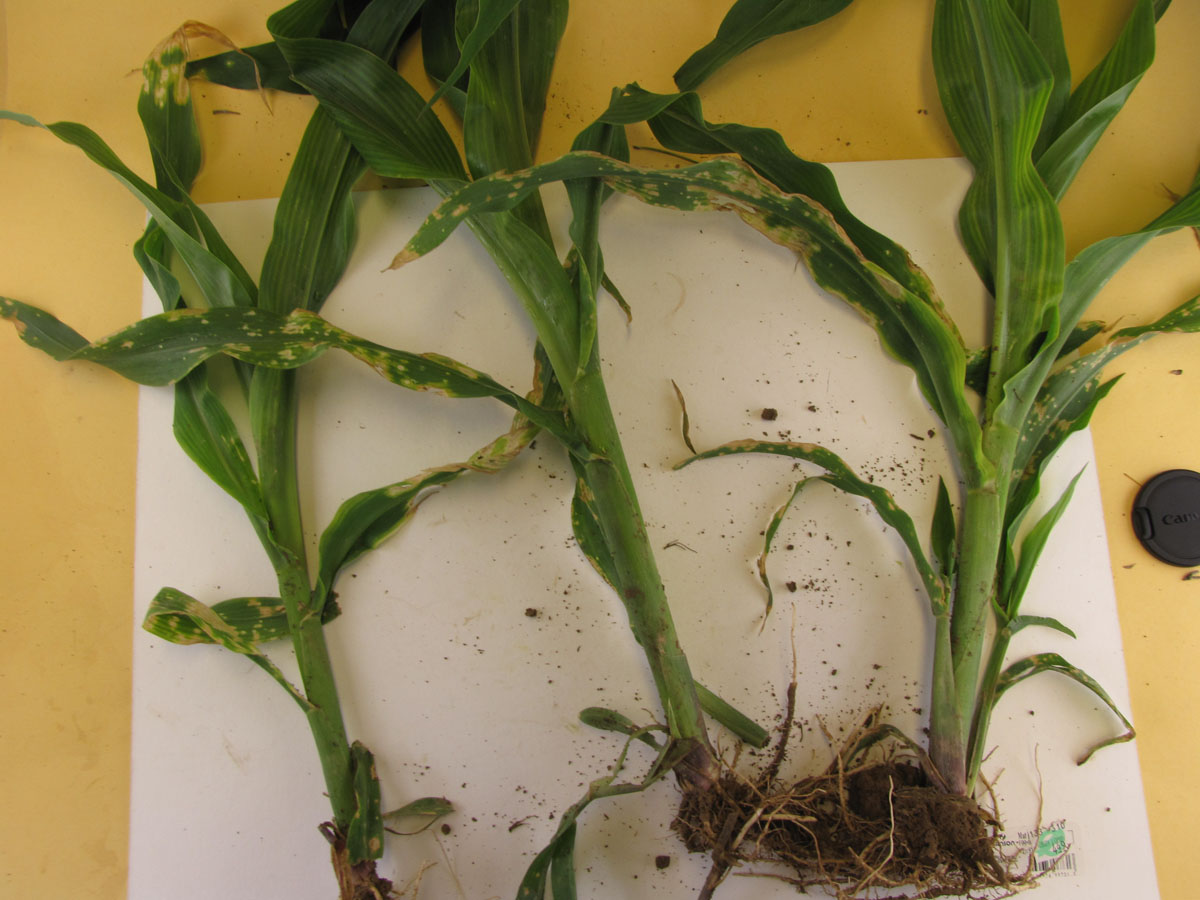
Figure 4. Corn plants with pale necrotic spots from exposure to paraquat drift.
![]()
Sulfur Deficiency in Corn – (Jim Camberato, Stephen Maloney, and Shaun Casteel)
Sulfur (S) deficiency has been diagnosed in corn and wheat in Indiana in recent years (see ref. 1). More than half the corn S deficiency experiments conducted in northeast Iowa since 2005 have responded to fertilizer S (see ref. 2). It is wise to consider S deficiency when troubleshooting corn growth problems.
Factors Affecting Sulfur Deficiency
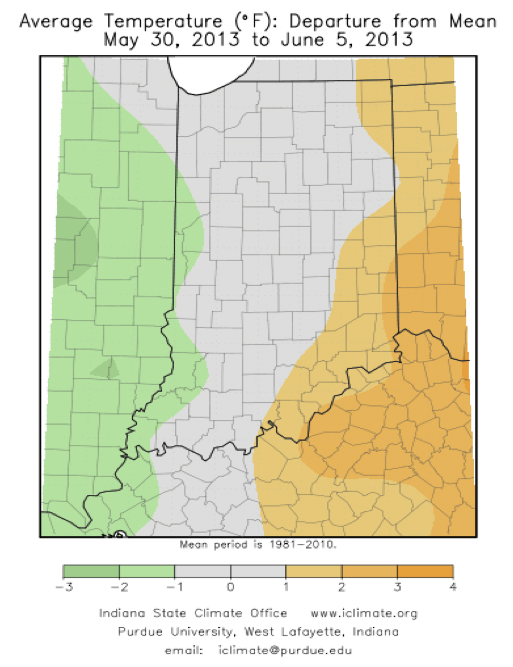
Sulfur deficiency of corn and other crops may be becoming more prevalent because less S is deposited from the atmosphere to the soil due to reductions in power plant S emissions (Fig. 1). In addition, increased yields over time result in greater crop S removal from the field. Corn grain contains about 0.5 pound of S for every 10 bushels of grain, so about 10 pounds of S per acre is removed by corn that yields 200 bushel per acre. Additionally, less incidental S applications in fertilizers and pesticides may contribute to more S deficiency. Increases in no-till, early planting, and heavy residue from high yields have also been implicated in increasing the occurrence of S deficiency.
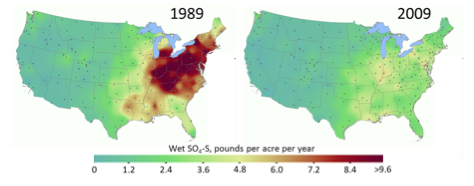
Fig. 1 The amount of sulfate (SO42-) deposited on the land in rainfall has been greatly reduced since 1989. Red colors indicate high deposition and green low deposition. Data from :<http://epa.gov/castnet/javaweb/wetdep.html>. (URL accessed April 2012).
Soil Factors Resulting in Sulfur Deficiency
The main source of S in most soils is organic S. Each percent organic matter in the plow layer contains about 100 pounds of sulfur per acre. Organic S must be mineralized to sulfate-S (SO4-S) to be taken up by crop plants, in much the same way that organic N is made available to crop plants. Therefore the lower the organic matter content of the soil the more likely S deficiency is to occur.
Since mineralization is a process carried out by microorganisms, soil temperature and moisture largely determine when and how much of the organic S is made available to the crop. Cold and excessively wet or dry conditions reduce microbial activity and reduce S availability from soil organic matter and crop residues. Thus, corn is more likely to be S deficient in the early spring before soil temperatures warm substantially, particularly with minimum tillage which results in colder soils.
Soybean and corn residues contain relatively low concentrations of S. In Stephen Maloney’s research at Vincennes the 1.5 tons of standing soybean stover dry matter at harvest arising from a 40 bushel per acre crop contained less than 3 pounds of S per acre, a concentration about 0.08% S. In Eric Miller’s recent research a 200+ bushel corn crop produced about 4.7 tons of stover dry matter per acre at 0.07% S, equivalent to less than 7 pounds of S in the stover. During the decomposition of crop residues which are low in S, inorganic S from the soil may be preferentially utilized by the microorganisms making it temporarily unavailable to the crop – a process called immobilization. Thus S deficiency may occur more frequently with large amounts of crop residue early in the growing season.
Sulfate-S is relatively mobile in most soils (similar to nitrate) because it has a double negative charge and is repelled by the negative charge of the soil, unlike nutrients such as potassium, calcium, or magnesium. Although SO4-S can bind to iron and aluminum in the soil, these elements are much more likely to bind phosphate at the exclusion of SO4-S. As a result, SO4-S is easily leached from soils, especially sandy soils.
At the field level the occurrence of S deficiency may be highly variable since soil S availability varies considerably with soil organic matter and texture. Sulfur deficiency is often seen in sandier, lower organic matter, and higher elevation areas of a field while lower lying, higher organic matter, and heavier textured areas typically have sufficient S.
Soil testing methods measure the SO4-S form of S. Unfortunately soil testing is not particularly useful for predicting S deficiency because it does not take into account the organic S component that might become available to the crop. The SO4-S component that is actually measured may also be leached from the soil between the time of sampling and the time of crop need. Sulfur deficiencies are notoriously transient because as the season progresses crops often access S deeper in the soil profile and warmer temperatures result in S mineralization from OM and crop residues.
Identifying Sulfur Deficiency in Corn
Sulfur deficient corn typically has an overall yellow appearance (see Fig. 2) similar to N deficiency. However S is not as mobile in the plant as N, so lower leaves do not show more severe deficiency symptoms than the upper leaves. If a S deficiency is misdiagnosed as a N deficiency the application of fertilizer N will make the S deficiency worse, so tissue sampling is recommended to positively identify which nutrient is deficient. In corn, S deficiency may also cause leaf striping (see Fig. 2) which is easily confused with magnesium, manganese, and zinc deficiency.
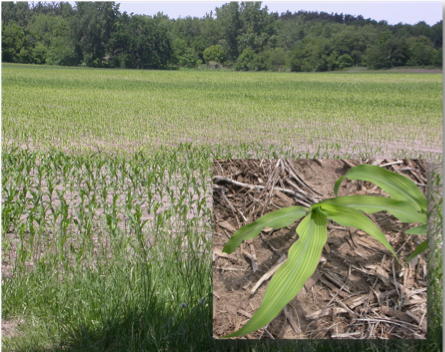
Figure 2. Areas of sulfur deficiency (pale green) and sufficiency (dark green) in an Indiana corn field caused by variations in soil properties. Young corn that is sulfur deficient may show striping as well as an overall yellow color. (Photos courtesy of Jeff Nagel)
Tissue Sampling
The best way to identify a S deficiency is by tissue sampling from the area suspected of deficiency and a healthy area of the field for comparison. In plants less than 4 leaf collars, sample the whole plant beginning about ½” above the soil surface and collect 15 to 20 plants to represent each area. For larger plants, sample the youngest collared leaf (also referred to as the most recently matured leaf) and collect 10 to 15 leaves to represent the areas. Wash soil from the tissue samples with distilled or deionized water. If samples are contaminated by soil they can be rinsed quickly in cold distilled water, but do not overdo it because some nutrients, especially potassium, may be leached out of the tissue. Wet samples should be air-dried before shipping to the laboratory in paper bags.
In the plant, S is a component of two amino acids and occurs in protein in a ratio of 1 part S to about 15 parts N. Therefore, the N:S ratio of plant tissue as well as the S concentration are used to identify S deficiency. The lower the S concentration and the higher the N:S ratio the more likely S is deficient in the plant. Tissue S less than 0.12% and N:S ratio greater than 20:1 are most likely S deficient. Sulfur is most likely adequate when tissue S is greater than 0.20% and N:S ratio is less than 12:1. Tissue S and N:S values in between these levels can go either way – deficient or adequate.
A soil analysis is always helpful for distinguishing among possible nutrient deficiencies. One should keep in mind that the soil test for sulfate-S is not the most accurate, because of the mobility of SO4-S in the soil and the release of S from soil organic matter. The results of a soil analysis might be most useful for ruling out the possibility of other nutrient deficiencies, than identifying S deficiency.
Correcting Sulfur Deficiency in Corn
Sulfur fertilizer should be applied as close to crop need as possible to reduce the chance it will be lost from the root zone by leaching. Often including S in a fertilizer program to avoid S deficiency is more efficient and less costly than correcting a S deficiency once it occurs. If S Table 1. Sulfur-containing fertilizers and their approximate composition (see ref. 3).deficiency is anticipated, an application rate of 15 pounds of SO4-S per acre is recommended on fine-textured soils and a rate of 25 pounds of SO4-S per acre is recommended on coarse-textured soils, based on the most recent research conducted in Iowa (see ref. 2). Although some carryover of S may occur in silt loam soils it likely will be necessary to make applications of S every year on sandy soils, particularly if irrigated and high yielding.
Fertilizer Materials
There are several fertilizers available for correcting a S deficiency (Table 1). Adding ammonium thiosulfate to urea-ammonium nitrate solutions or blending ammonium sulfate with urea are convenient and cost effective ways to provide S in a timely manner. Sulfate-of-potash-magnesia (sul-po-mag or K-mag) or potassium sulfate can be blended with muriate of potash to provide S and K. The inclusion of magnesium in sul-po-mag may be an extra benefit compared to potassium sulfate if soil magnesium levels are low. Generally these fertilizers are spread prior to planting therefore the SO4-S might be lost from sandy soils before the time of crop need.
Naturally-occurring mined gypsum and several by-product sources of gypsum can be applied to provide S as well. Gypsum if pelletized can be blended with other fertilizers or if ground, applied with a lime spreader. Unless pelletized, however, higher than necessary rates of S will be applied with gypsum which is difficult to spread at rates less than 500 to 1000 pounds per acre (85 to 170 pounds of S per acre assuming 17% S). If carryover of S occurs, the S will be utilized in later years. However, in sandy soils, where leaching is likely, the benefit in future years may be minimal.
Elemental S must be oxidized by soil bacteria to SO4 before becoming plant available. Warm temperatures and good moisture and aeration are required for S-oxidizing bacteria to function. Sulfur oxidation is minimal at soil temperatures less than 50°F. Even at 75°F the oxidation rate of S is about 15% of that at 85°F, so peak rates of S oxidation do not occur until late spring. Since the availability of elemental S may be minimal in early spring, a fertilizer containing some SO4 in addition to elemental S is preferred over a fertilizer with elemental S alone.
| Table 1. Sulfur-containing fertilizers and their approximate composition (see ref. 3). | ||||||
| Fertilizer | %N | %P2O5 | %K2O | %S | %Mg | %Ca |
| Ammonium sulfate | 21 | 0 | 0 | 24 | 0 | 0 |
| Ammonium thiosulfate | 12 | 0 | 0 | 26 | 0 | 0 |
| Elemental sulfur | 0 | 0 | 0 | >90 | 0 | 0 |
| Gypsum | 0 | 0 | 0 | 17 | 0 | 22 |
| Potassium magnesium sulfate | 0 | 0 | 22 | 23 | 11 | 0 |
| Potassium sulfate | 0 | 0 | 50 | 18 | 0 | 0 |
Effects of Sulfur Containing Fertilizers on Soil pH
Soil pH is lowered by elemental S, ammonium thiosulfate, and ammonium sulfate. The oxidation of elemental or chemically reduced S (thio-S for example) creates acidity which lowers soil pH. However, no acidity arises from the sulfate in any of the fertilizer materials including ammonium sulfate. With ammonium sulfate the conversion of ammonium to nitrate is the component that generates the acidity. When used to provide less than 30 pounds S per acre, the amount of acidity generated by each of these acid-producing fertilizers is equivalent to less than 100 pounds of limestone per acre. None of the S containing fertilizers in Table 1 increase soil pH.
References Used in This Article:
(1) Camberato, Jim and Shaun Casteel. 2010. Keep an eye open for sulfur deficiency in wheat. Purdue University Department of Agronomy, Soil Fertility Update. Available at: <http://www.agry.purdue.edu/ext/soybean/Arrivals/04-13-10_JC_SC_Sulfur_deficiency.pdf>. (URL accessed June 2013).
(2) Sawyer, J.E., B. Lang, and D.W. Barker. 2012. Sulfur fertilization response in Iowa corn and soybean production. Proc. of the 2012 Wisconsin Crop Manage Conf. 51:39-48. <http://www.soils.wisc.edu/extension/wcmc/2012/pap/Sawyer_1.pdf>. (URL accessed June 2013).
(3) Zublena, J.P., J.V. Baird, and J.P. Lilly. 1991. Nutrient content of fertilizer and organic materials. <http://www.soil.ncsu.edu/publications/Soilfacts/AG-439-18/AG-439-18.pdf>. (URL accessed June 2013).
Delayed in Planting Soybean? - (Shaun N. Casteel) -
The 2013 planting season started off completely opposite of 2012. Prolonged cold temperatures from the winter and abundant rainfall delayed planting across the Midwest. The needle for planting corn really did not move until the first week of May instead of the first week of April. Several weeks of fast-paced planting of corn brought Indiana to the 5-year average by late May. Indiana soybeans were also behind the eight ball initially, but recovered over the middle few weeks of May (Figure 1). Unfortunately, rain cycles over the past couple of weeks have kept many out of the fields. As of Monday (June 3), soybean planting progress reached 89% for Ohio, 76% for Indiana, 49% for Illinois, and 40% for Iowa (USDA-NASS, 2013). The delayed planting pattern has certainly been worse for our neighboring states to the west, but we do have areas of Indiana that are in the same holding pattern.
We need to set the stage for the best possible return on late plantings of soybean. If you are in the situation of planting soybeans in June, you need to consider your seeding rates, row width, and maturity group. Soybeans trip their reproductive trigger (flowering) as the day length shortens, which occurs much quicker with delayed plantings.
SEEDING RATE – Planting in the first weeks of June require 10 to 20% increase in seeding rates to facilitate quicker row closure and higher pod height with fewer days to flowering. Increased seeding rates will also be needed in those fields that have heavy corn residue and weed biomass. For instance if you typically plant 140,000 seeds/acre in 15-inch rows, you need to bump the seeding rate to ~160,000 seeds/acre.
ROW WIDTH – If you plant 30-inch rows, you need to look into the possibility of planting narrower rows with the limited time to flowering. We typically see a yield advantage of 5 to 10% for soybeans planted in narrow rows (15 inches or less) compared to 30-inch rows, and this difference will be even more prominent in late planting situations. Wide rows (30-inch) take nearly 25 days longer and 40 days longer to canopy compared to 15-inch and 7.5-inch rows, respectively. This delay will certainly decrease the yield potential as canopy closure would occur well after reproductive initiation.
MATURITY GROUP – Full-season varieties for your respective regions should be planted until June 15 for the northern quarter, June 20 for the central half, and June 25 for the southern quarter of Indiana. Varieties should be dropped a half maturity group after these dates and planted for another two weeks before we consider other alternatives. If you are in a very late planting situation, I suggest back-dating 90 days from the typical fall freeze in your region to determine if you have enough growing season to mature a soybean crop. My hope is that you will not need to make that determination. Figure 1. Soybean planting progress of Indiana in 2013, 2012, 5-year average, 2011, and 1996. Planting in 2012 was one of the fastest; whereas, 2011 and 1996 were among of the slowest. (USDA-NASS, 2013).
References:
USDA-NASS. 2013. Crop Progress and Condition. USDA, National Agricultural Statistics Service. [On-line]. Available at <http://www.nass.usda.gov/Statistics_by_State/Indiana/Publications/Crop_Progress_&_
Condition/2013/index13.asp> [URL accessed June 2013].
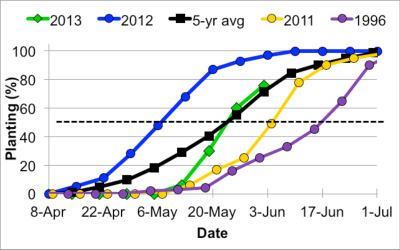
Fig. 1. Soybean planting progress of Indiana in 2013, 2012, 5-year average, 2011 and 1996. Planting in 2012 was one of the fastest; whereas, 2011 and 1996 were among the slowest (USDA-NASS, 2013).
![]()
Weather Outlook by NWS OHRFC – (Jim Noel, NOAA/NWS/Ohio River Forecast Center) –
The weather pattern for the rest of June is shaping up to have near normal temperatures with the focus being on a few days above normal followed by a few days below normal as the weather pattern remains progressive in nature. Rainfall looks to stay in the normal to slightly above normal range. Expect rain systems about every 3-4 days. This may continue to present some issues with things such as hay. With corn beginning to really grow and abundant soil moisture, this will likely lead to elevated humidity levels as we go through summer, humid conditions. This could lead to some issues in the agricultural areas and will need to be monitored.
The latest 2 week rain totals average 2-3 inches across Indiana as can be seen at this link:
<http://www.erh.noaa.gov/ohrfc/HAS/images/NAEFS16day.pdf>.

![]()
![]()