
- Armyworm and Black Cutworm Moth Flights, Something to Consider!
- Alfalfa Weevil Management Guidelines
- Handy Bt Trait Table
- Black Cutworm Adult Pheromone Trap Report
- New Online Tool Helps Indiana Farmers Select Cover Crops
- Fine-Tune Soybean Seeding Rates During Chilly and Wet Spring
- Corn Planting Date is Important, But...
Armyworm and Black Cutworm Moth Flights, Something to Consider! - (Christian Krupke, John Obermeyer, and Larry Bledsoe)
• Kentucky reporting large numbers of armyworm moths.
• Traps in Indiana are catching inordinate numbers of black cutworm moths.
• Crop scouting will be emphasized in the next couple weeks!
Armyworm pheromone traps monitored by the University of Kentucky have been catching an impressive early moth flight for several weeks. Doug Johnson, UK Extension Entomologist, has been helpful in disseminating this information to alert of the potential impact this may have on hay, small grain, and corn crops. Very soon, grassy crops in extreme southern Indiana should be monitored for leaf defoliation and small armyworm larvae hiding under the soil surface residues during the day. This is especially true where grass-hay and wheat are thick and lush, this presents a favorite egg-laying location for moths. Our black light trapping at the Purdue Agricultural Research Centers, which began this week, will soon give us an indication of moth activity in Indiana, we’ll have those updates in following Pest&Crop issues.
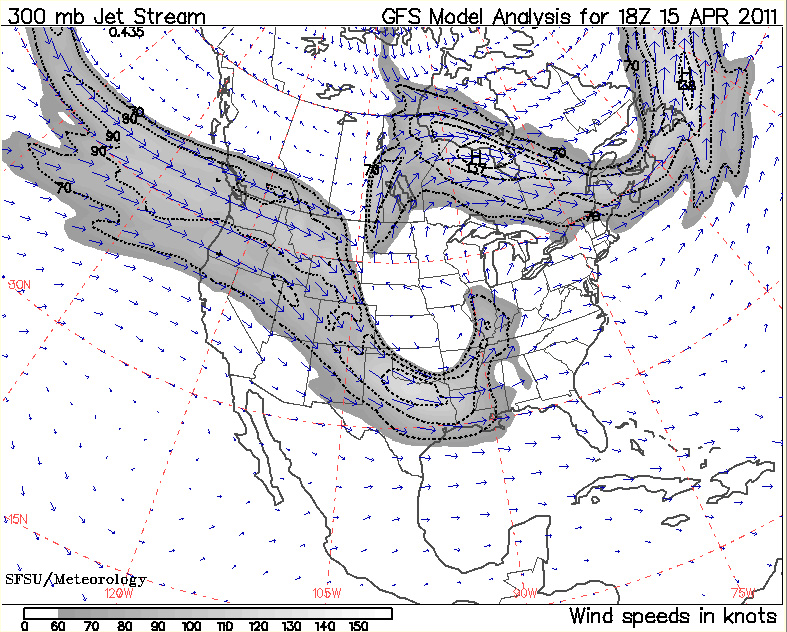
Jet stream shown pushing upward inot the Midwest, April 15, 2011 (NOAA)
As mentioned in the last Pest&Crop, our pheromone trap cooperators throughout the state were just beginning to catch a few black cutworm moths. However, this past week there have been multiple intensive captures (9 or more moths captured in 2 consecutive nights) which has signaled the beginning of heat unit accumulations to predict the beginning of cutting, see the “Black Cutworm Adult Pheromone Trap Report” on the following page. Most of the significant catches occurred just after a major front moved from the Gulf States, spawning innumerous tornados, then took aim for the Midwest. The following weather maps, compliments of NOAA, depict how powerful this system was…both the jet stream and surface maps showing the storm direction on Friday, April 15. This was a “perfect storm” for picking up black cutworm moths in the south region of the US and depositing them into Indiana. What this means to our crops, most yet to be planted, will unfold in the next several weeks. However, all the green and weedy fields out there, combined with large numbers of migrating moths could combine to make life interesting. Stay tuned and happy scouting!
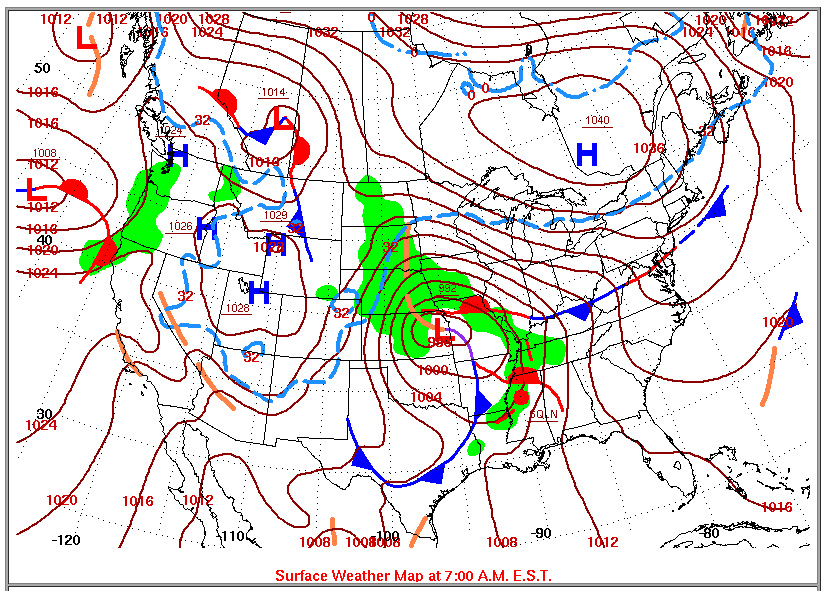
Surface winds, as influenced by the powerful jet stream on April 15, is “flinging” black cutworm moths into the Midwest ( NOAA).
![]()
Alfalfa Weevil Management Guidelines – (Christian Krupke, John Obermeyer and Larry Bledsoe)
Pest managers in southern Indiana should now be scouting their alfalfa for leaf feeding from weevil larva. This pest is often overlooked during the early spring planting season.
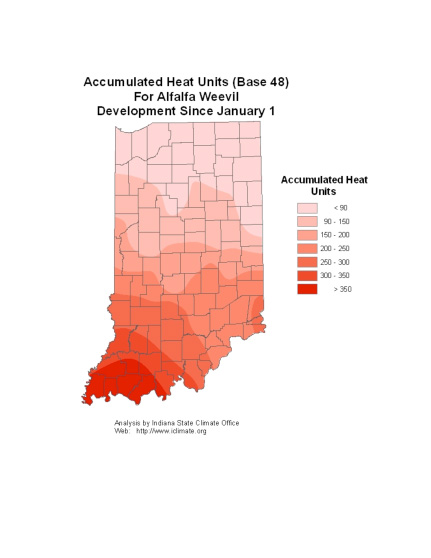
Producers can manage this pest most effectively by utilizing heat unit accumulations data (base 48°F) to determine when sampling should begin and when an action should be taken, The management guidelines listed below should be used to determine when alfalfa weevil should be controlled in southern Indiana. Refer to the following map for alfalfa weevil development in your area.
| Alfalfa Weevil Management Guidelines | ||
| Heat Units | % Tip Feeding | Advisory |
| 200 | Begin sampling. South facing sandy soils should be monitored earlier. | |
| 300 | 25 | Re-evaluate in 7-10 days using the appropriate HU or treat immediately with a residual insecticide if 3 or more larvae are noted per stem and % tip feeding is above 50% |
| 400 | 50 | Treat immediately with a residual insecticide |
| 500 | 75 | Treat immediately |
| 600 | 75+ | If cutting delayed more than 5 days, treat immediately |
| 750 | If harvested or harvesting shortly, return to the field in 4-5 days after cutting and spray if 1) there is no regrowth and weevil larvae are present OR 2) feeding damage is apparent on 50% of the stubble and weevil larvae are present. | |
![]()
Handy Bt Trait Table - (Bob Nielsen)
Chris DiFonzo, Michigan State University and Eileen Cullen, University of Wisconsin have revised their helpful table of hybrid corn Bt traits. This is a great reference that nicely summarizes the many combinations of Bt traits in the marketplace, including which insects they control and how they differ for refuge area requirements. Please check out this website for more information: <http://www.entomology.wisc.edu/cullenlab/extension/xtras/PDFs/
Handy%20Bt%20Trait%20Table.pdf>.
![]()
Click here to see the Black Cutworm Adult Pheromone Trap Report
![]() Marestail Control Essential to Protect Soybean Yields – (Jennifer Stewart, Ag Answers)
Marestail Control Essential to Protect Soybean Yields – (Jennifer Stewart, Ag Answers)
No-till practices save soil and offer many other benefits, but soybean producers know there’s at least one big disadvantage: Not tilling gives weeds, particularly problematic marestail, a chance to thrive.
“The biggest challenge we have in no-till soybeans across Ohio and surrounding states is control of glyphosate-resistant marestail in the spring,” said Ohio State University Extension weed specialist Mark Loux.
Marestail emerges in fields from late March through June, and again in late summer through fall. Spring-emerging marestail competes with soybeans throughout the growing season, eventually bolting to a height of 3 to 6 feet -- enough to interfere with harvest. It’s more of a problem in the southern two-thirds of the state, though it’s moving north, Loux said.
Loux said a one-two punch is necessary for marestail control in no-till fields: An effective burndown herbicide treatment to ensure planting is done in weed-free fields, and a residual treatment controlling the growth of any new weeds until early to mid-June, when the leaves of the soybean plants are large enough to form a canopy that provides plenty of control.
In a 2010 marestail study, Loux found soybean yields were severely affected when marestail wasn’t controlled:
• In fields where a burndown treatment failed to control marestail, yields averaged 51 bushels per acre.
• In fields where the burndown treatment was effective, but no residual herbicide was applied, yields averaged 57 bushels per acre.
• In fields where both burndown treatment was effective and residual herbicides were used, yields averaged 65 bushels per acre.
This spring, it should be easier for farmers to make an effective burndown application, Loux said. Because last fall was so dry, most of the marestail that emerged at that point -- which is normally difficult to eradicate from fields in the spring -- didn’t thrive. But a burndown treatment is still needed for spring-emerging weeds, he said.
Timing of the burndown application is an important factor, Loux said. Cold temperatures can reduce herbicides’ effectiveness. Don’t apply treatments when nighttime temperatures could get down to 35 or 40 degrees -- wait until conditions warm up and nighttime temperatures are steadily 40 or 50 degrees, he said.
Weed problems are also an issue in no-till corn fields, Loux said, but farmers generally have a wider array of effective herbicides to handle those problems.
“For soybeans, the choices are fewer as to what will actually control the vegetation that’s out there, and you have to use the right rates and the right combinations to really get control,” he said.
Specific recommendations for both burndown herbicide treatments and residual control are listed in an updated fact sheet, “Control of Marestail in No-Till Soybeans,” by Loux and Purdue University weed specialists Bill Johnson and Glenn Nice. It is available on OSU Extension’s Agronomic Crops Team website, <http://agcrops.osu.edu/specialists/weeds>.
Additional information is available in the 192-page “Weed Control Guide for Ohio and Indiana, 2011,” available at county Extension offices and on OSU Extension’s e-Store, at <http://estore.osu-extension.org/searchproducts.cfm>.
In addition, the CORN (Crop Observation and Recommendation Network) newsletter offers weekly updates at <http://corn.osu.edu>. Watch and listen as Loux talks about marestail at <http://go.osu.edu/marestail>.
![]()
New Online Tool Helps Indiana Farmers Select Cover Crops – (Keith Robinson, Ag Communications)
A new online tool to help farmers decide which cover crops will benefit their row crop rotation is now available in Indiana.
Purdue University and the Midwest Cover Crops Council teamed up to release the MCCC Cover Crop Decision Tool, which uses consolidated cover crop information by state or province to assist farmers in making cover crop selections at the county level.
Developing information for each state or province were university researchers, Extension educators, Natural Resources Conservation Service personnel, state departments of agriculture personnel, crop advisers, seed suppliers and farmers. Purdue agronomy professors Eileen Kladivko and Keith Johnson contributed to the project.
“The MCCC hopes the cover crop selector tool will encourage the adoption of cover crops by providing the information and decision-making help necessary for farmers to successfully integrate cover crops into their cropping systems,” Kladivko said.
Users of the tool select their state or province and county. They also can give information on their cash crops, including planting and harvest dates, field information such as the soil drainage class, artificial drainage or flooding, and desired cover crop benefits.
Designed to be user-friendly, the tool allows users to immediately see how their input changes their cover crop options. Users can generate an information sheet for a selected cover crop that provides additional information and references relevant to application within the state or province.
The tool also has been completed for Michigan and Ohio, while other states and provinces are developing their information. When completed, Illinois, Iowa, Wisconsin, Minnesota and Ontario will be added to the Web-based system.
A Natural Resources Conservation Service Innovation Grant, Michigan State University’s Project GREEEN -Generating Research and Extension to meet Economic and Environmental Needs - and the Great Lakes Regional Water Program fund the project.
The tool is available at <http://mccc.msu.edu/SelectorTool/2011CCSelectorTool.pdf>
![]()
Fine-Tune Soybean Seeding Rates During Chilly and Wet Spring – (Shaun Casteel)
April 2011 is a stark contrast to April 2010 where many wore short-sleeve shirts (even shorts) and basked on the tractor during the 75° days. At this time last year, ~50% of the corn and ~10% of the soybean was planted (a record pace for both crops). April 2011 has been much cooler and wetter, which we can take advantage for final tune-ups of our planting equipment. I want to remind us that soybean planting should be based on soil and environmental conditions. Planting dates are a good reference, but they should not override the field conditions. Planting soybean into a cold and wet soil can cause a several problems such as sidewall compaction in the seed furrow, emergence issues from cold temperatures to seedling diseases, and favorable conditions for SDS (Fusarium virguliforme) infection during early growth.
As you tune-up your planters, drills, and air-seeders, you should consider your soybean seeding rates for 2011. The seed is in the shed ready to be loaded and planted, but the seed lots this year will be different from last year. Many soybean lots planted in 2010 were large seeds (2200 seeds/lb and I even heard of one lot at 1900 seeds/lb). Soybean seeding rates need to be adjusted by seed size rather than weight. Planter settings used last year will probably drop more seeds per acre with this year’s seed lots. Germination scores fluctuate as well.
My soybean seeding rates start around 130 to 150 thousand viable seeds per acre with adjustments for field conditions and planting equipment. The total seeding rate is calculated by dividing the viable seeding rate by the germination percent. For example, seeding at 140,000 viable seeds for a variety with 90% germination would require 155,000 total seeds (viable + nonviable) per acre. This same variety at 3100 seeds/lb would require 50 lb/acre; whereas, at 2500 seeds/lb would require 62 lb/acre. More difficult conditions for planting and seedling establishment will push the seeding rate higher. A general rule of thumb is to estimate that 85 to 95% of the viable seeds planted will emerge and establish a stand depending on accuracy of seed placement, residue issues, and other field conditions. This brings us to the overall goal for plant populations for soybean rather than just seeding rates.
Our small plot research has demonstrated that harvest stands near 100 to 120 thousand plants per acre optimize yield. In other words, soybean yields do not effectively increase with plant stands above 120,000 plants at harvest. This is lower than traditional thoughts of soybean plant stands and certainly lower than the target of many farmers. We initiated on-farm research trials in 2010 to address this topic at a larger scale, both in the field and across the state. The yield response to plant stand across the state was similar to our small plots. Harvest plant stands of 90,000 plants/acre yielded 95% of the maximum and 120,000 plants/acre yielded 100% of the maximum (Figure 1). Three of the six on-farm sites in 2010 were not responsive to plant populations with a range of 45 to 175 thousand plants, which may be due to lower yield environment, soil productivity, soil moisture (too much or too little) or others. We are continuing the on-farm research efforts in 2011 to fine-tune the state (and possibly region/soil specific) plant population recommendations. Please visit <http://www.agry.purdue.edu/ext/ofr/> or the local Extension office if you are interested in participating in this on-farm research. Here is hoping for some warmer and drier days!

Figure 1. 2010 Soybean yield response to plant populations at harvest based on six on-farm research trials across in Indiana
![]()
Corn Planting Date is Important, But.... – (Bob Nielsen)
• Early planting favors higher yields, but does not guarantee higher yields.
• Statewide averages for planting date and yield are not strongly related.
• Planting date is but one of many yield influencing factors.
Conventional wisdom says that the prime planting window to maximize corn yields in much of Indiana opens about April 20 and closes about May 10. This “window” typically opens about one week later across the northern tier of Indiana counties (later warmup) and about one week earlier across the southern tier of Indiana counties (earlier warmup).
Very little corn, if any, has been planted in Indiana yet this spring as of 17 April. By itself, this is not much cause for concern because typically only a very small percentage of acres are ever planted by this date in Indiana. However, the specter of delayed planting is clearly on the horizon because little other spring fieldwork has been completed due to the frequent and sometimes excessive rainfall in recent weeks. For some growers, tillage operations, herbicide applications, and nitrogen fertilizer applications must be completed first before they can consider planting their crops.
What are the consequences of a delayed start to planting? How important a predictor of statewide corn yield is planting date anyway? Does late planting in and of itself guarantee lower than normal yields? Interestingly, the planting date effect on statewide average corn yield is not clearcut.
If one reviews USDA-NASS crop progress reports for the past 20 years (USDA-NASS, 2011), there is NOT a strong relationship between planting date and yield on a statewide basis for Indiana. Specifically, departures from annual trend yields are not strongly related to corn planting progress. Figures 1 through 3 illustrate this relationship for three measures of planting progress; percent acres planted by April 30, by May 15, and by May 31. Even though one can statistically define a mathematical relationship between departure from trend yield and planting progress by April 30 or May 15, the relationship only accounts for 11 to 12% of the variability in yield trend departures from year to year (Fig’s 1 & 2). In other words, a number of yield influencing factors (YIFs) other than planting date also affect the ultimate maximum yield for a given year.
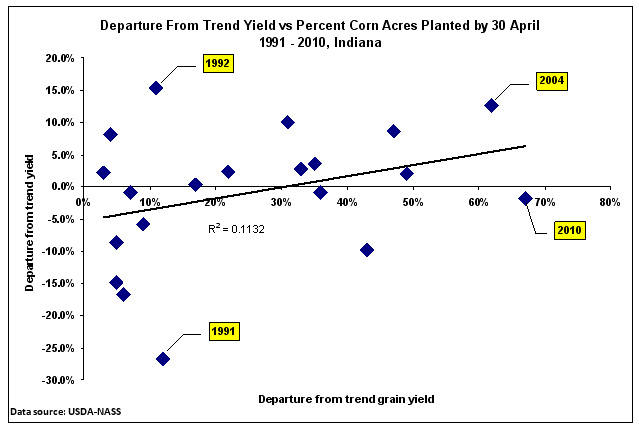
Figure 1. Percent departure from trend yield versus percent of corn acres planted by April 30 in Indiana, 1991-2008.

Figure 2. Percent departure from trend yield versus percent of corn acres planted by May 15 in Indiana, 1991-2008.
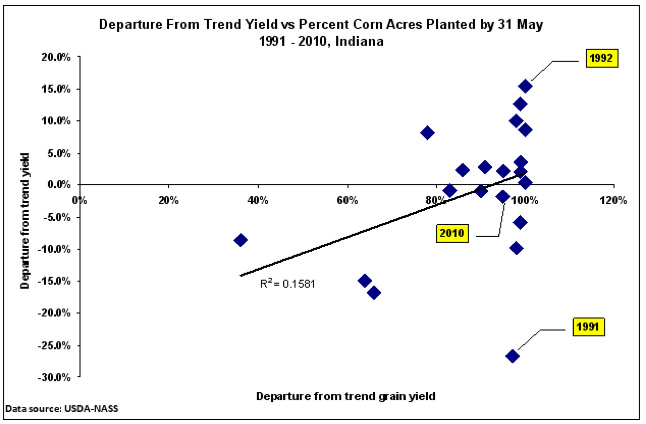
Figure 3. Percent departure from trend yield versus percent of corn acres planted by May 31 in Indiana, 1991-2008.
So what’s the deal? Why is it that every corn agronomist known to man preaches about the importance of timely planting and yet the statewide statistical data suggest that planting date accounts for only 12% of the variability in statewide yields from year to year? Let’s look more closely about this seeming paradox.
It is true that corn grain yield potential does indeed decline with delayed planting after about May 1 (Nafziger, 2008). The estimated yield loss per day varies from about 1 bu/ac/day early in May to nearly 2 bu/ac/day by the end of May. Yield potential goes down with delayed planting because of a number of factors, including a shorter growing season, insect & disease pressure, and moisture stress during pollination.
However, the good news is that planting date is but one of many YIFs for corn. What is important to understand is that yield loss to delayed planting is relative to the maximum yield possible in a given year. In other words, if all the other YIFs work together to determine that the maximum possible yield this year is 200 bu/ac, then the consequence of a 10-day planting delay beyond May 1 (at 1 bu/ac/day) would be a yield potential of 190 bu/ac (i.e., 200 bu/ac potential minus 10 bu/ac due to delayed planting). However, if all the other YIFs work together to determine that the maximum possible yield this year is only 160 bu/ac, then the consequence of a 10-day planting delay beyond May 1 (at 1 bu/ac/day) would be a yield potential of 150 bu/ac (i.e., 160 bu/ac potential minus 10 bu/ac due to delayed planting). Make sense?
Consequently, it is possible for early-planted corn in one year to yield more than, less than, or equal to later-planted corn in another year depending on the exact combination of YIFs for each year. That is the reason why statewide average corn grain yields frequently vary by plus or minus 10% from the expected trend yield from year to year.
For example, the crop years 1997 and 2009 represent early and late planting dates in Indiana (Fig. 2). About 80% of the state’s crop was planted by May 15 in 1997, but only 20% of the crop was planted by May 15 of 2009. Yet, the earlier planted 1997 crop yielded 8.3% BELOW trend yield for that year and the later planted 2009 crop yielded 8.1% ABOVE trend yield. Why? Important differences in YIFs between the years other than simply planting date.
Bottom Line
Let’s not succumb quite yet to fearmongering triggered by the prospects of a delayed start to corn planting in 2011. “Mudding in” a crop early to avoid planting late will almost always end up being an unwise decision. While important, planting date is only one of many yield-influencing factors for corn.
Another reason that it is probably too early to fearmonger about the anticipated late start to planting is that growers have the machinery capacity to “catch up” quickly once the weather and soil conditions become favorable for planting. The 1992 planting season began as one of the slowest (Fig. 1) but quickly recovered within two weeks to a respectable pace (Fig. 2) and finished the season with the largest POSITIVE departure from trend yield in the past 18 years. We also know from past years’ experiences that, on average, 50% of the state’s corn crop is typically planted over about an 21-day period (Fig. 5). Furthermore, it is not unheard of for growers to plant 45 to 50% of the state’s crop in a single week given good working conditions (Fig. 6).

Figure 4. Percent departure from trend yield versus the date when at least 50% of Indiana's corn crop was planted, 1983-2010.
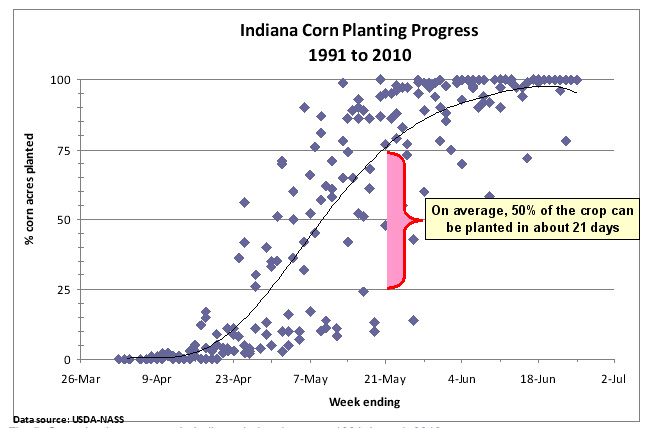
Figure 5.Corn planting progress in Indiana during the years 1991 through 2010.
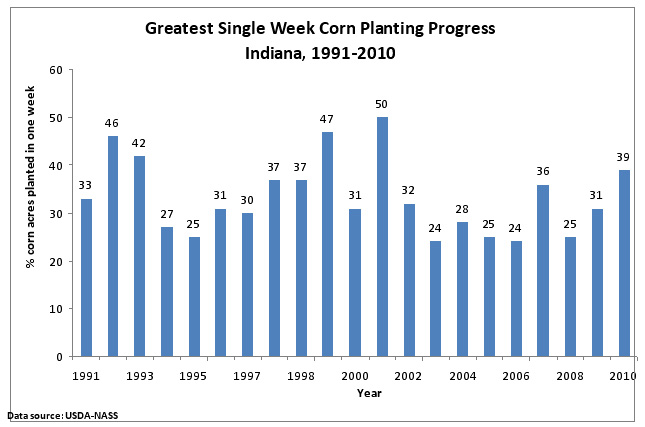
Figure 6. The fastest single week of corn planting progress in Indiana for individual years from 1991 through 2010.
References
Nafziger, Emerson. 2008. Thinking About Corn Planting Date and Population. The Bulletin (No. 2, Article 7, April 4), Univ. of Illinois Extension. [On-line]. Available at <http://www.ipm.uiuc.edu/bulletin/article.php?id=890>. [URL accessed Apr 2011].
USDA-NASS. 2011. Crop Progress and Condition. USDA, National Agricultural Statistics Service. [On-line]. Available at <http://usda.mannlib.cornell.edu/MannUsda/viewDocumentInfo.do?documentID=1048>. [URL accessed Apr 2011].
![]()