
phpESP/public/survey.php?name
=2011pestcrop
Test Weight Issues in Corn- (Bob Nielsen)
Among the top 10 most discussed (and cussed) topics at hometown cafes during harvest season is the test weight of the grain being reported from corn fields in the neighborhood. Test weight is measured in the U.S. in terms of pounds of grain per volumetric bushel. In practice, test weight measurements are based on the weight of grain that fills a quart container (32 qts to a bushel) that meets the specifications of the USDA-FGIS (GIPSA) for official inspection (Fig. 1). Certain electronic moisture meters, like the Dickey-John GAC, estimate test weight based on a smaller-volume cup. These test weight estimates are reasonably accurate but are not accepted for official grain trading purposes.
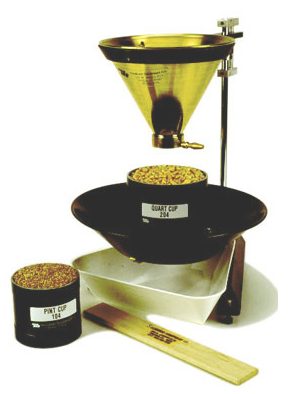
Figure 1. A standard filling hopper and stand for the accurate filling of quart or pint cups for grain test weight determination (Image: http://www.seedburo.com)
The official minimum allowable test weight in the U.S. for No. 1 yellow corn is 56 lbs/bu and for No. 2 yellow corn is 54 lbs/bu (USDA-GIPSA, 1996). Corn grain in the U.S. is marketed on the basis of a 56-lb "bushel" regardless of test weight. Even though grain moisture is not part of the U.S. standards for corn, grain buyers pay on the basis of "dry" bushels (15 to 15.5% grain moisture content) or discount the purchase price to account for the drying expenses they will incur with corn grain wetter than 15 or 15.5% moisture.
Growers worry about low test weight because local grain buyers often discount their offered price to farmers for low test weight grain. In addition, growers are naturally disappointed when they deliver a 1000-bu semi-load of grain with an average 52-lb test weight because they only get paid for 929 56-lb "market" bushels (52,000 lbs ÷ 56 lbs/bu).
On the other hand, high test weight grain makes growers feel good when they deliver a 1000 bushel semi-load of grain with an average 60 lb test weight because they will get paid for 1071 56-lb "market" bushels (60,000 lbs ÷ 56 lbs/bu). These emotions encourage a belief that high test weight grain is associated with high grain yields (lbs. of dry matter per acre) and vice versa. However, there is little evidence in the research literature that corn test weight is strongly correlated with grain yield.
Hybrid variability exists for grain test weight, but also does not necessarily correspond to differences in genetic yield potential. Test weight for a given hybrid can vary from field to field or year to year, but does not necessarily correspond to the yield level of an environment. The graph in Fig. 2 illustrates the absence of a strong correlation between relative grain yield and test weight for two hybrids grown in our nitrogen rate trials over multiple site-years in Indiana.
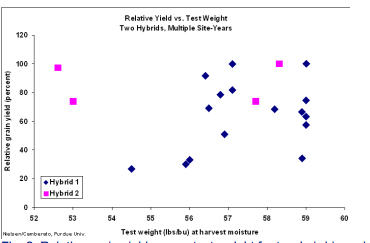
Fig. 2. Relative grain yield versus test weight for two hybrids and multiple site-years in Indiana, 2006-2009 (Nielsen & Camberato, Purdue Univ.).
Conventional dogma suggests that low test weight corn grain results in lower processor efficiency and quality of processed end-use products like corn starch, though the research literature does not consistently support this belief. Similarly, low test corn grain is often thought to be inferior for animal feed quality, though again the research literature is not in agreement on this. Whether or not low test weight grain is inferior to higher test weight grain may depend on the cause of the low test weight in the first place.
Common Causes of Low Test Weight Corn
Back in the 2009 harvest season in Indiana, there were more reports of low test weight corn grain than good or above average test weights. There were primarily six factors that account for most of the low test weight grain in 2009 and four shared a common overarching effect.
First and foremost, growers should understand that test weight and grain moisture are inversely related. The higher the grain moisture, the lower the test weight. As grain dries in the field or in the dryer, test weight naturally increases as long as kernel integrity remains intact. Test weight increases as grain dries partly because kernel volume tends to shrink with drying and so more kernels pack into a volume bushel and partly because drier grain is slicker which tends to encourage kernels to pack more tightly in a volume bushel.
Therefore in a year like 2009 with many of the initial harvest reports of grain moisture ranging from 25 to 30% instead of the usual starting moisture levels of about 20 to 23%, it should not be surprising that test weights were lower than expected. Hellevang (1995) offered a simple formula for estimating the increase in test weight with grain drying. In its simplest form, the equation is (A/B) x C; where A = 100 - dry moisture content, B = 100 - wet moisture content, and C = test weight at wet moisture content. The author does not say, but I suspect this simple formula is most applicable within a "normal" range of harvest moistures; up to moistures in the mid- to high 20's.
Example: Dry moisture = 15%, Wet moisture = 25%, Test weight at 25% = 52 lbs/bu.
Test weight at 15% moisture = ((100 - 15) / (100 - 25)) x 52 = (85/75) x 52 = 58.9 lbs/bu
An older reference (Hall & Hill, 1974) offers an alternative suggestion for adjusting test weight for harvest moisture that also accounts for the level of kernel damage in the harvested grain (Table 1). The table values are based on the premise that kernel damage itself lowers test weight to begin with and that further drying of damaged grain results in less of an increase in test weight that what occurs in undamaged grain. Compared to the results from using Hellevang›s simple formula, adjustments to test weight using these tabular values tend to result in smaller adjustments to test weight for high moisture grain at harvest, but larger adjustments for drier grain at harvest.
| Table 1. Adjustment added to the wet-harvest test weight to obtain an expected test weight level after drying to 15.5 percent moisture. | ||||||||
| Percent damage | Grain moisture at harvest (percent) | |||||||
| 30 | 28 | 26 | 24 | 22 | 20 | 18 | 16 | |
| 45 | 0.3 | |||||||
| 40 | 0.7 | 0.2 | ||||||
| 35 | 1.3 | 0.7 | ||||||
| 30 | 1.8 | 1.3 | 0.8 | |||||
| 25 | 2.4 | 1.9 | 1.4 | 0.9 | 0.3 | |||
| 20 | 3.1 | 2.6 | 2.0 | 1.5 | 1.0 | 0.5 | ||
| 15 | 3.8 | 3.2 | 2.7 | 2.2 | 1.7 | 1.2 | 0.6 | 0.2 |
| 10 | 4.5 | 4.0 | 3.5 | 2.9 | 2.2 | 1.9 | 1.4 | 0.8 |
| 5 | 5.3 | 4.7 | 4.2 | 3.7 | 3.0 | 2.7 | 2/1 | 1.6 |
| 0 | 6.1 | 5.6 | 5.0 | 4.5 | 4.0 | 3.5 | 2.9 | 2.4 |
| Source: Hall & Hill, 1974 | ||||||||
Secondly, thirdly, and fourthly; drought stress, late-season foliar leaf diseases (primarily gray leaf spot and northern corn leaf blight), and below normal temperatures throughout September of 2009 all resulted in a significant deterioration of the crops photosynthetic machinery beginning in early to mid-September that «pulled the rug out from beneaththe successful completion of the grain filling period in some fields; resulting in less than optimum starch deposition in the kernels. Fifthly, early October frost/freeze damage to late-developing, immature fields resulted in leaf or whole plant death that effectively put an end to the grain-filling process with the same negative effect on test weight.
Finally, there were widespread reports of ear rots (diplodia, gibberella, etc.) throughout many areas of Indiana in 2009. Kernel damage by these fungal pathogens results in light-weight, chaffy grain that also results in low test weight diseased grain, broken kernels, and excessive levels of foreign material. This cause of low test weight grain obviously results in inferior (if not toxic) animal feed quality grain, unacceptable end-use processing consequences (ethanol yield, DDGS quality, starch yield and quality, etc.), and difficulties in storing the damaged grain without further deterioration.
Related References
Bern, Carl and Thomas Brumm. 2010. Grain Test Weight Deception. Iowa State Extension Publication PMR-1005. [online] http://www.extension.iastate.edu/Publications/PMR1005.pdf. [URL accessed Oct 2011].
Bradley, Carl. 2009. Diplodia Ear Rot Causing Problems in Corn Across the State. The Bulletin, Univ of Illinois Extension. [online]. http://ipm.illinois.edu/bulletin/article.php?id=1233. [URL accessed Oct 2011].
Hall, Glenn and Lowell Hill. 1974. Test Weight Adjustment Based on Moisture Content and Mechanical Damage of Corn Kernels. Trans. ASAE 17:578-579.
Hellevang, Kenneth. 1995. Grain Moisture Content Effects and Management. North Dakota State Extension Publication AE-905. [online]. http://www.ag.ndsu.edu/extension-aben/documents/ae905.pdf. [URL accessed Oct 2011].
Hicks, D.R. and H.A. Cloud. 1991. Calculating Grain Weight Shrinkage in Corn Due to Mechanical Drying. Purdue Extension Publication NCH-61 [online].
http://www.ces.purdue.edu/extmedia/nch/nch-61.html [URL accessed Oct 2011].
Hill, Lowell D. 1990. Grain Grades and Standards: Historical Issues Shaping the Future. Univ. of Illinois Press, Champaign, IL.
Hurburgh, Charles and Roger Elmore. 2008. Corn Quality Issues in 2008 - Moisture and Test Weight. Integrated Crop Management News, Iowa State Univ. Extension. [online]. http://www.extension.iastate.edu/CropNews/2008/1023hurburghrobertsonelmore1.htm. [URL accessed Oct 2011].
Hurburgh, Charles and Roger Elmore. 2008. Corn Quality Issues in 2008 – Storage Management. Integrated Crop Management News, Iowa State Univ. Extension. [online]. http://www.extension.iastate.edu/CropNews/2008/1023hurburghrobertson.htm. [URL accessed Oct 2011].
Nafziger, Emerson. 2003. Test Weight and Yield: A Connection? The Bulletin, Univ of Illinois Extension. [online]. http://ipm.illinois.edu/bulletin/pastpest/articles/200323h.html. [URL accessed Oct 2011].
USDA-GIPSA. United States Standards for Corn. 1996. USDA Grain Inspection, Packers and Stockyards Administration (GIPSA). [online] http://archive.gipsa.usda.gov/reference-library/standards/810corn.pdf. [URL accessed Oct 2011].
Wise, Kiersten and Charles Woloshuk. 2009. Dealing With Diplodia Ear Rot. Pest & Crop Newsletter, Purdue Extension. [online]. http://extension.entm.purdue.edu/pestcrop/2009/issue24/index.html. [URL accessed Oct 2011].
![]()
Harvesting, Drying, and Storing the 2011 Corn Crop – (Matt Roberts and Richard Stroshine, Agricultural and Biological Engineering Dept.)
High temperatures and lack of rain this past summer have taken a toll on a portion of Indiana's 2011 corn crop. Some regions of the state are reporting that corn is more susceptible to lodging than usual and there are also reports of poor kernel fill and small kernels. Higher moistures and poor kernel development can mean lighter test weight corn and/or grain storage challenges for some farmers and elevators. More detailed information on drying low test weight corn and properly managing foreign material can be found on Purdue's Grain Quality website http://www.grainquality.org under the Extension Publications tab on the left side of the screen (for example, see GQFS-27 found under Extension Publications, Grain Drying, Conditioning and Aeration). Below is a summary of basic principles along with some references to specific publications.
Lodged corn typically means more stalk material passing through the combine and ultimately more foreign material in grain tanks. Threshing may be more aggressive in attempts to remove poorly developed kernels from cobs which can result in higher percentages of damaged or broken kernels and also pieces of cob in the grain. Low test weight corn is often more susceptible to kernel breakage during harvesting and handling than is high test weight corn. For more information on combine adjustment there is a link posted on http://www.grainquality.org under the News and Information link to "Corn Harvest – Minimizing Foreign Material in the Combine's Grain Tank". It is the first link under the heading "Informative Articles and PDF Publications from Previous Years".
The presence of broken kernels, stalks, and cobs in a bin can restrict airflow. Even with state of the art grain spreaders, broken kernels and foreign material tends to accumulate in the center of bins. This will reduce airflow in the center of the bin. Ideally grain should be cooled to at least 50°F or cooler to control insects and mold growth. If the grain in the center of the bin is not cooled thoroughly mold and insects can begin to grow there and eventually spread to other regions of the bin. Bins should be cored after they are filled in order to remove the accumulation of broken kernels and foreign material. Coring can be accomplished by removing several loads of grain from the bin. It will also help to level the top of the grain mass. Air finds the path of least resistance and the coring and leveling should eliminate or reduce the higher airflow resistance in the center of the bin. Therefore, the bin will be aerated more evenly.
To help reduce the amount of broken kernels, cobs, and stalks the grower should make sure their combine is set properly and adjusted regularly as crop conditions change. Screening equipment should be used to remove as many of the broken kernels and as much of the plant material as possible from the grain before it is placed into storage. Even if great care is taken to properly set combines and clean the grain, bins should still be cored in order to ensure even airflow.
Besides creating airflow problems in the grain mass, broken and damaged kernels can act as an excellent host for mold and insect growth. Special attention should also be paid to the drying process to mitigate additional kernel damage. Low test weight kernels and kernels damaged during harvest are more likely to be further damaged when dried. Managers using high temperature dryers need to be especially careful since these systems are particularly hard on kernels. Extreme swings in kernel temperature like those that can occur during high temperature drying and rapid cooling can increase the extent and severity of kernel stress cracking which will eventually lead to increased breakage. The kernel temperature of corn in high temperature dryers should not exceed 140 degrees. Samples should be taken throughout the day to monitor for cracking and breakage and dryer temperature should be closely monitored and lowered if these types of kernel damage are found.
![]()