
Pest & Crop Newsletter
Winter Conditions and Insect Survival – (John Obermeyer and Larry Bledsoe)
- Temperature is just one factor that impacts an insect’s winter survival.
- Spring temperatures and moisture often have a greater influence on insect numbers and subsequent crop damage.
- Production practices, such as date of planting, tillage type, and herbicide application have a large influence on populations as well.
We have all heard a great deal about climate change for some time. While there is little doubt that this phenomenon is occurring, it may not have seemed like it over the last few months in Indiana. For example, the past winter has given us extremes in both temperatures and forms of precipitation. What will this mean for insects and subsequent crop damage this coming season? As you probably already guessed…it depends on the insect. The following information on insect/environment/crop interactions that might clear the picture somewhat.
Overwintering insects utilize various behavioral and physiological mechanisms to keep them from dying during the long winter months. Survival tactics include, but are not limited to: lowering metabolic rates, reducing water content in essential tissues, and finding protected microenvironments. Predictive models for some many overwintering insects exist, but it is impossible to measure all of the environmental variables that individual insects are subjected to in their overwintering locations. The graph below compares ambient air and 4”soil depth temperatures with snowfall recorded at the Agronomy Research Center in West Lafayette for fourteen winters. This depicts how soil temperatures tend to follow air temperature trends. However, as snowfall amounts decrease, the temperature differential is less between the air and soil (e.g., 2002, 1998). It comes as no surprise that snow cover provides an insulating blanket for overwintering insects at or below ground level. Though the differences may seem minor to us, to a small, cold-blooded insect, it may make the difference between life and death.
One common misconception is that a single “hard freeze” will wipe out many of the insects or eggs during the winter season. In fact, it often takes much more than this to make a difference to insect populations. For example, our key corn pest, the Western corn rootworm, which overwinters in the egg stage, requires a total of 35 days at or below 14ºF for large-scale egg mortality to occur. In Indiana, we did not see anywhere near these accumulations of cold. Other insects are not quite this hardy, but the point to keep in mind here is that a single cold event can often be survivable for most of our key pests. It generally takes substantially more to kill enough insects to make a difference.

![]()
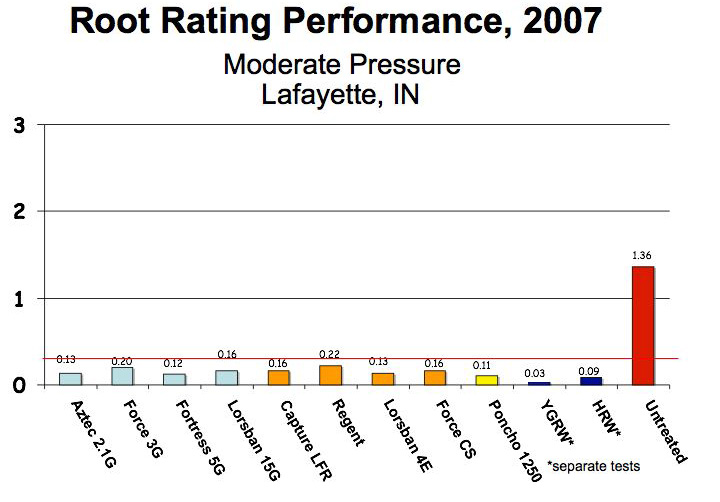
Comparison of Rootworm Product Performance Under Low to High Pressure - (John Obermeyer and Larry Bledsoe)
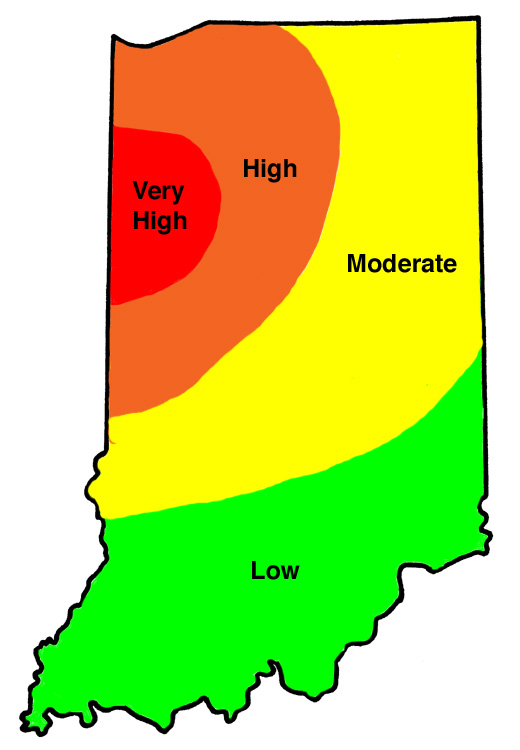
The following bar charts help compare the efficacy of rootworm control products by application methods (granular, liquid, seed-applied, and Bt) under varying rootworm pressure. Refer to the “Perceived First-Year Corn Rootworm Risk Area” map. Farms in the low to moderate risk areas may experience the pressure associated with the first chart. Those located in the higher risk areas are more likely to see greater rootworm pressure as depicted in the second graph.
The left side of the graphs represents the Node Injury Scale 0-3, where 0 indicates little to no rootworm feeding, and a value of 3 indicates few roots remaining. Damage greater than 0.25 (one-quarter of 1 node of roots, indicated by horizontal black line across graph) indicates where yield losses may begin to occur. However, keep in mind that the relationship between damage and yield when roots are evaluated (late July) is often not strong. The amount and distribution of rainfall throughout the remaining months of ear development will have a large effect on yield. Use the charts below to tell you how well the different products hold up to rootworm pressure, bearing mind the amount of risk you will accept. Do not use the charts as a direct predictor of yield protection.

Perceived First-Year Corn Rootworm Risk Areas
Identifying Wheat Growth Stages - (Gregory Shaner, Charles Mansfield, and Bill Johnson)
For effective management of wheat, it is important to recognize the stages of growth as the crop develops. Heading date is a common indicator of relative maturity, but it’s important to recognize other growth stages for judging the progress of the crop and for making management decisions, such as application of fertilizer, herbicides, or fungicides, and for predicting the consequences of disease or injury to the crop. The Feekes and Decimal (Zadoks) scales are the most common growth stage systems for wheat. The Feekes scale is older and has been used widely since the early 1950s. The Decimal scale is designed to make finer distinctions among stages of crop growth, and is probably used more in Europe than in the U.S., although pesticide labels in the U.S. are starting to use both scales.
The Feekes scale divides growth stages into 11 major categories. Head emergence, flowering, and grain filling (Feekes Growth Stages 10 and 11) are further subdivided. The Feekes Growth Stage scale is presented below in Table 1, with a description of the crop development stage that corresponds to each number. The Decimal scale has 9 major divisions (1-9), with 10 possible subdivisions (0-9) for each major division. For example, a 2 denotes tillering stage in the Decimal scale, and the second digit indicates the number of tillers per plant, e.g., stage 23 means there are 3 tillers in addition to the main stem. The Feekes scale simply notes whether tillers have begun forming (FGS 2), or whether tillering is essentially complete (FGS 3), without requiring the counting of tillers, although tiller number per plant could be appended after the “2”, e.g. FGS 2.4.
The most difficult task in describing crop growth stage is determining leaf number and tiller number. Accurate determination of leaf and tiller number requires that plants be dug up and carefully separated. To determine leaf number, position the plant so that the first true leaf is on the left. Because wheat has a 2-ranked leaf arrangement the next leaf will be on the right side of the plant. The leaf above that will be back on the left side, and so forth. By spring, the first 2 leaves may have died and withered, so the plant needs to be inspected carefully to find the remnants of these leaves. The topmost leaf is counted only if it is at least one-half the length of the leaf just below. Continue counting leaves up the stem until the total number of leaves is determined. It is important that tillers be differentiated from leaves and counted separately. To distinguish tillers from a leaf look for the presence of an independent sheath, called a prophyll, which is located at the base of each tiller. Unlike leaves, tillers are counted as soon as they emerge. Once leaf number and tiller number have been determined, the subsequent key characteristics to be noted are node formation, flag leaf emergence, boot stage, head emergence, flowering, and finally grain development.
In winter wheat, the period from beginning of tillering to completion of tillering may extend for a considerable time, from autumn into the following spring. Likewise, the precise limits of FGS 4 and 5 are not clear. Depending on planting date, variety, and weather in the fall, plants may reach the pseudo stem erection stage in the fall, or only in the spring as the crop comes out of dormancy.
Jointing (FGS 6, DC 31) can be clearly determined. The original Feekes scale simply defined stage 6 as when the first node was visible at the base of the shoot. The Decimal scale provides a more precise definition for this stage, namely when the distance between the crown and the first stem node is at least 1 cm (0.4 in.). When the second above ground node is at least 2 cm (0.8 in.) above the first node, the plant has reached FGS 7 or DC 32. The ability to recognize FGS 6 is important because it’s the cutoff for many herbicides, especially those that contain 2,4-D, Axial, dicamba (Banvel, Clarity), MCPA, Olympus, Osprey, and Aim. Application of these products after jointing can result in malformed heads, sterility, and reduced yield. For a visual description of the cutoff date for various wheat herbicides, see page 151 in the 2008 Weed Control Guide for Ohio and Indiana or this link <http://www.btny.purdue.edu/Pubs/WS/WS-16/WheatTiming.pdf>.
The stage when the flag leaf first appears (FGS 8, DC 37) is important for application of a foliar fungicide. Stems of soft red winter wheat in Indiana typically have 4 above ground nodes when fully developed. The sheath of the uppermost leaf (flag leaf, F) arises from the top node. The leaf below the flag leaf (F-1) arises from the next node down, etc. Thus, leaf F-3 arises from the lowest above ground node. The lowest above ground node is near the ground when it first appears, but will move upward as the stem elongates. At FGS 8, there are usually two clearly differentiated nodes on the stem. The lower node will average about 7 cm (2-3/4 in.) above the soil line. The second node (from which leaf F-2 arises) will be about 15 cm (6 in.) above ground. The third node will usually be visible, but because it is only about 1 cm (0.4 in.) above node 2, it is not counted. As the wheat continues to grow, the distance between nodes increases, and the fourth node becomes evident. Feekes 8 (DC 37) is the cutoff for Harmony Extra, and Harmony GT, two products that are commonly used for control of wild garlic, and Express, commonly used for control of dandelion, chickweed, Canada thistle, and other winter annuals. Feekes growth stage 9 (DC 39) is the cutoff for Stinger, Starane, Widematch, and Buctril. Stinger is commonly used for control of Canada thistle, dandelion, and marestail; Buctril is commonly used for control of mustards, lambsquarters, ragweeds, and smartweeds.
Once the flag leaf blade has fully emerged, the flag leaf sheath extends. By this time, the head enclosed in this leaf sheath is swelling, and the plant enters the boot stage (FGS 10). The heads of all plants in a field will not emerge from the boot synchronously. Stages 10.1 through 10.5 are assigned according to when heads on about half the plants have reached the indicated degree of emergence.
Flowering in wheat begins roughly in the middle of the head and progresses both upward and downward. Flowering at a given position in the head can be judged by the presence of extruded anthers.
Ripening is judged by removing developing kernels from the center of several heads and determining whether the contents are watery, milky, or at the soft or hard dough stages.
By the time wheat has reached FGS 8, leaves F-5 and below are usually withered, from infection by Septoria, Stagonospora, and other fungi. The next leaf up (F-4) usually withers about the time heads have fully emerged. In the absence of Septoria and Stagonospora blotches, powdery mildew, or other foliar diseases, leaves F-3 through F should remain green until the wheat approaches maturity. Often, however, disease destroys leaves at each layer of the canopy prematurely. Fungicide control is aimed at maintaining these leaves, particularly F and F-1, in a healthy condition.
If a grower is planning to apply a fungicide at flag leaf emergence (FGS 8), it would be helpful to know when that stage will be reached, relative to some earlier, easily determined growth stage. The jointing (FGS 6) and 2-node (FGS 7) stages can be accurately determined if a wheat field is monitored frequently. The time required for a plant to progress from either of these stages to FGS 8 is not constant. It depends on weather, particularly temperature. Over many years, we monitored wheat crop development in various field trials, and the following observations can give some guidelines for the time required for plants to progress from one growth stage to another. It takes about a week to progress from FGS 6 to FGS 7, and another 8 days to go from FGS 7 to FGS 8 (with a range of 5 to 10 days). It can take from 3 to 8 days for the flag leaf blade to fully expand (going from FGS 8 to FGS 9). It can take from 9 to 16 days to progress from FGS 9 to full head emergence (FGS 10.5) or the beginning of flowering (FGS 10.5.1).
To correctly determine crop growth stage, identify the following characteristics in order. Refer to Table 1 for the corresponding numerical assignment.
Count the leaves on the main shoot
Count the tillers
Count the nodes
Flag leaf emergence
Boot stage initiated
Head emergence
Flowering or anthesis
Grain developmental stage
Table 1. Soft Red Winter Wheat Crop Growth Stages |
||
Visual Description |
Decimal |
Feekes |
Germination |
||
Dry seed State of imbibition Imbibition complete Emerged radicle Emerged coleoptile Leaf at coleoptile tip |
00 01 03 03 07 09 |
|
Seedling Growth |
||
| First true leaf first leaf unfolded 2 leaves unfolded 3 leaves unfolded 4 leaves unfolded 5 leaves unfolded 6 leaves unfolded 7 leaves unfolded 8 leaves unfolded 9 or more leaves |
10 11 12 13 14 15 16 17 18 19 |
1 1 |
Tillering |
||
| Main shoot only Main shoot and 1 tiller Main shoot and 2 tillers Main shoot and 3 tillers Main shoot and 4 tillers Main shoot and X tillers |
20 21 22 23 24 2X |
2 2 3 |
Stem Elongation |
||
| Pseudo stem erection 1st detectable node (1st internode >1 cm) 2nd detectable node (2nd internode >2 cm) 3rd detectable node 4th detectable node Xth detectable node Flag leaf visible Flag leaf ligule and collar visible |
30 31 32 33 34 3X 37 39 |
4-5 6 7 8 |
Booting |
||
Flag leaf sheath extendng Boot swollen Flag leaf sheath opening First visible awns |
41 45 47 49 |
10 |
Head Emergence |
||
First spikelet visible 1/4 of head visible 1/2 of head visible 3/4 of head visible Head completely emerged |
50 53 55 57 59 |
10.1 10.2 10.3 10.4 10.5 |
Anthesis |
||
Anthesis begins 1/2 of anthesis complete Anthesis complete |
60 65 69 |
10.51 10.52 10.53 |
Milk Development |
||
| Kernel watery ripe Early milk Medium milk Late milk |
71 73 75 77 |
10.54 11.1 |
Dough Development |
||
Early dough Soft dough Hard dough |
83 85 87 |
11.2 |
Ripening |
||
| Kernel hard (difficult to split by thumbnail) Kernel hard (cannot be dented by thumbnail) Kernel loosening in daytime Overripe Seed dormant Viable seed has 50% germination Seed not dormant Secondary dormancy Secondary dormancy lost |
91 |
11.3 11.4 |
| Adapted from Strauss R. 1994. Compendium of growth stage identification keys for mono- and dicotyledoneus plants. Basel, Switzerland: Ciba-Geigy AG. | ||
![]()
Fungicides for Wheat - (Gregory Shaner)
- Choose products and application timing based on target diseases.
Some fungicides have been labeled for use on wheat for many years. Recently, several additional products have been registered. In addition to the older products--maneb and mancozeb (sold under many brand names) and propiconazole (Tilt, PropiMax, and Bumper), growers can now use Headline, Quadris, Stratego, Quilt, and Proline. The table below is based table prepared by members of the North Central region wheat disease committee, and provides relative efficacy information for commonly used fungicides.
All products work quite well against leaf blotch and leaf rust, but they differ in efficacy toward powdery mildew. The efficacy ratings toward stripe rust are not shown in this table because they are the same as against leaf rust (except that Stratego is rated VG against stripe rust) and because stripe rust has not been a problem in Indiana. Fusarium head blight (scab) is where we see real differentiation among products. Proline is the only registered product that works well against scab. Folicur is listed in the table because it has been available in past years under a Section 18 Emergency Exemption. However, that exemption has expired and will not be renewed. It is possible that Folicur will receive full registration this spring, but we don’t know if this will occur in time for use on wheat in Indiana this year. If Folicur does not receive a full registration for wheat, do not use it. Products that contain a strobilurin (pyraclostrobin, azoxystrobin, or trifloxystrobin) should not be used against scab. In some trials, application of these products has resulted in higher levels of DON, the toxin produced in grain by the fungus, than in untreated wheat.
What about the timing of fungicide application on wheat? The traditional timing for control of foliar diseases has been around the time of flag leaf emergence to early boot, Feekes growth stages 8 to 10 (see companion article on wheat growth stages). This year, a couple of fungicide manufacturers are promoting application of reduced rates of fungicide at the tillering (Feekes GS 3) to jointing (Feekes GS 6) stages of growth. The idea is to control Septoria/Stagonospora, powdery mildew, or stripe rust when these begin to develop early in the season. The manufacturers point out that a second application of fungicide may be necessary to provide disease control throughout the time wheat is vulnerable. These recommendations have stimulated a lot of discussion among wheat pathologists over the past couple of weeks (and which continue). The upshot appears to be that early applications are only justified under special circumstances, such as when wheat is grown after wheat and tan spot develops or when stripe rust shows up early in the season. Neither of these conditions is very likely in Indiana. Powdery mildew can develop early in the season in thick canopies, so this would likely be the only circumstance in which an early application would be justified.
Weather and susceptibility of the wheat variety have a big influence on development of all of the diseases listed in the table. If a variety is resistant to a disease, a fungicide is not likely to provide additional benefit. Even if a variety is susceptible to any of these diseases, it is impossible at this time to predict how favorable weather will be this spring and summer. As the season progresses, articles in Pest&Crop will provide updates on disease risk.
Management of Small Grain Diseases (NCERA-184) - Fungicide Efficacy for Control of Wheat Diseases
The North Central Regional Committee on Management of Small Grain Diseases has developed the following information on fungicide efficacy for control of certain foliar diseases of wheat for use by the grain production industry in the U. S. Efficacy ratings for each fungicide listed in the following table were determined by field testing the materials over multiple years and locations by the members of the committee. Efficacy is based on proper application timing to achieve optimum effectiveness of the fungicide as determined by labeled instructions and overall level of disease in the field at the time of application. Differences in efficacy among fungicide products were determined by direct comparisons among products in field tests and are based on a single application of the labeled rate as listed in the table below.
| Efficacy of Fungicides for Wheat Disease Control Based on Appropriate Application Timing | ||||||
Product |
Fungicide(s) |
Rate/A |
Powdery Mildew |
Stagonosporal Septoria Leaf/Glume Blotch |
Leaf Rust |
Head Scab |
| Headline 2.09 EC | Pyraclostrobin 23.5% | 6.0 to 9.0 |
G1 |
VG |
E |
NR |
| Quadris 2.08 SC | Azoxystrobin 22.9% | 6.2 to 10.8 |
F(G)2 |
VG |
E |
NR |
| Proline 480 SC | Prothioconazole 41% | 5.0 to 5.7 |
--3 |
VG |
VG |
G(VG)3 |
| PropiMax 3.6 EC | Propiconazole 41.8% | 4.0 |
VG |
VG |
VG |
F |
| Tilt 3.6 EC | Propiconazole 41.8% | 4.0 |
VG |
VG |
VG |
F |
| Quilt 200 SC | Azoxystrobin 7.0% |
14.0 |
VG |
VG |
E |
NR |
| Stratego 250 EC | Propiconazole 11.4% Trifloxystrobin 11.4% |
10.0 |
G |
VG |
G |
NR |
| Folicur 3.6F4 | Tebuconazole 38.7% | 4.0 |
G |
VG |
E |
G |
1Efficacy categories: NR = Not Recommended; F = Fair; G = Good; VG = Very Good; E = Excellent. This information is provided only as a guide. It is the responsibility of the pesticide applicator by law to read and follow all current label directions. No endorsement is intended for products listed, nor is criticism meant for products not listed. Members of NCR-184 assume no liablity resulting from the use of these products. |
||||||
![]()
Foliar Fungicides on Corn - (Gregory Shaner)
- Whey do they pay?
It’s late March and there is no corn even planted yet in Indiana (at least I hope not), so why am I writing about application of foliar fungicides? Many farmers who are contemplating applying a fungicide to their corn in July need to lock in the application now. Disease pressure on corn always varies from year to year in Indiana so no one can really say what problems will develop this summer. Is it possible to make any predictions or educated guesses now about disease risk next summer?
Three conditions determine whether a disease will develop on corn (or on any other crop). These are the susceptibility of the hybrid, the abundance and virulence of the pathogen, and weather. The interactions among these three factors give rise to the disease triangle metaphor that plant pathologists are so fond of. The host side of the triangle is the most knowable at this time. Corn hybrids differ in their resistance to various diseases. Seed companies provide information about resistance on their Web sites and in seed catalogs. Growers should check the resistance ratings for important diseases in the hybrids they will plant, preferably before selecting a hybrid, but at least in hindsight, to assess disease risk. There is no standard in the industry for reporting resistance ratings. Some companies provide scores on each of a large number of diseases. At the other end of the spectrum, some companies simply provide a statement such as “good plant health package”. A grower should talk to a seed company representative about what the ratings mean for a particular hybrid, taking into account the grower’s field conditions and production practices.
It is also possible to make some educated guesses about the pathogen side of the triangle at this time. Except for the two rust fungi that infect corn, fungal pathogens survive locally. Many of these fungi survive in residue of plants they infected last summer. Although residue from last year’s corn crop has been dead for months, the pathogens in it are alive and well. As temperatures rise, these fungi produce spores on the residue. Wind will disperse spores from the residue and some will land on next summer’s corn to start a new disease cycle. A downside of conservation tillage has been an increase in disease pressure. Leaving corn residue on the soil surface allows pathogens to survive in much greater number compared to the days when moldboard plowing was common. If corn is grown in rotation with soybean, and the ground is worked enough to provide a clean seedbed for corn, then inoculum (spores of the fungal pathogens) won’t be abundant in that field. These clean fields aren’t without risk, however. Wind can carry spores from adjacent fields where corn residue is on the soil surface. Risk of disease is probably greater in a conservation tillage system or where corn is grown after corn. In these systems there may be corn residue in the cornfield itself. Other conditions being equal, disease is likely to get started earlier in a field where corn residue is present than in a clean field.
University trials are beginning to yield data on fungicide efficacy in hybrid corn. In five trials we conducted in Indiana last year we saw no statistically significant increase in yield as a result of fungicide application. This is not surprising because disease pressure was very light at all locations. In a summary of 89 university trials from the Atlantic Coast to the Great Plains, Headline fungicide applied at 6 fl oz/A resulted in yield responses that ranged from a negative 18 bu/A to a positive 23 bu/A. The average yield response over all trials was 4.1 bu/A (Note: I single out Headline because it was included in all trials. Other fungicides were tested in some, but not all trials. Results for these were similar). In 54% of the trials the yield response was 5 bu/A or greater. For trials in which the hybrid was susceptible or moderately susceptible to gray leaf spot the average response to fungicide application was 6 bu/A. For trials in which the hybrid was moderately resistant or resistant to gray leaf spot, the average yield response to fungicide application was only 3 bu/A.
A grower who is considering an application of a foliar fungicide to corn should first determine the hybrid’s degree of resistance to gray leaf spot, northern corn leaf blight, anthracnose, and common rust. If the hybrid has poor resistance to any of these, that would be a reason to consider a fungicide. Second, the grower should assess inoculum pressure (the abundance of corn pathogens). Corn after corn or reduced tillage systems will probably result in more inoculum than rotation corn with some tillage prior to planting. High inoculum pressure would be another reason, along with a susceptible hybrid, to consider a fungicide.
The big uncertainty is weather. Even if a grower has a susceptible hybrid and abundant residue in the field or nearby, weather must be favorable for disease. The dry summer in much of Indiana last year prevented spore production and infection and we saw little leaf disease. It’s impossible to say now what the weather will be like next July and August (with apologies to the meteorologists). Assuming we don’t have a drought this year, a grower’s experience may indicate that some fields are more likely to have disease problems than others. Humidity is often higher and dew heavier and more persistent in bottomlands or fields that are bordered by woods compared to fields in wide-open spaces. Long dew periods and high humidity favor production of spores and give spores that land on corn leaves time to germinate, infect, and establish new infections.
Spraying a thousand acres or more of corn is a huge investment. Given all the uncertainties about economic return, I would encourage anyone who uses a fungicide to leave at least two, preferably three, untreated strips in a field. If application is by air, the grower will need to get an accurate map that shows where these strips are. Then, the farmer can compare yield in the treated and untreated areas. It’s also a good idea to walk treated and untreated areas in late August to see if there are differences in leaf health, and in late September or October to check effects of treatment on stalk health. Fungicides may improve stalk health even if they don’t increase yield per se. This is probably an indirect result of protection of green leaf area. If there are harvest delays, healthy stalks are less likely to lodge. This allows faster harvest with less grain loss from ears too low for the combine to pick up.
![]()