
Pest & Crop Newsletter, Entomology Extension, Purdue University
- Nitrate-Nitrogen: Here Today Gone Tomorrow
- Crappy Stands of Corn
- Thin Soybean Stands- Should I Replant, Fill In, or Leave it Alone?
- Is it Time to Plant an Earlier Maturity Group Soybean?
It’s a Zoo Out There – (John Obermeyer, Christian Krupke, and Larry Bledsoe)
- Numerous pest and non-pests are being found in poor emerging/growing fields.
- Some animals are feeding on dead/decaying plant material.
- A plethora of pests are being reported, even where seed-insecticides have been used.
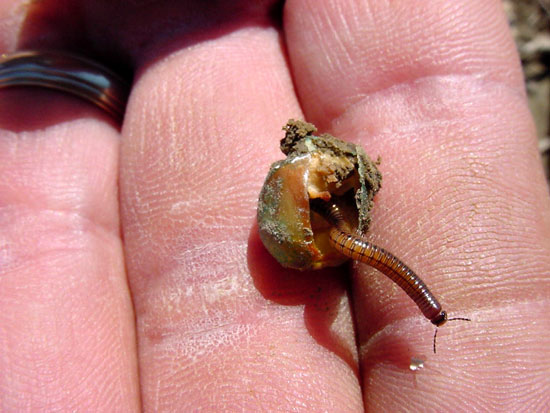
Rotting kernel hollowed out by a millipede.
Finally the sun is out, fields are drying, and temperatures are increasing. As pest managers inspect crops that have been subjected to an extended period of poor growing conditions, a multitude of critters are being found in the soil. Some are known pests and several are being falsely accused of causing stand reductions.
It’s not a wireworm: Millipedes are wireworm-like arthropods (like insects, they belong to the Phylum Arthropoda-means “jointed foot”), having two pair of legs per body segment that move quickly above and below the ground. They have become more prevalent since the advent of no-till. When found, their numbers are often high. Millipedes typically feed as scavengers, feeding on dead or decaying materials often associated with seedling blights. They have rarely been documented as pests of corn. Several pest managers have reported numerous millipedes in and around corn kernels/sprouts that have been in the ground for two or more weeks. The opportunistic millipedes were hollowing out these “blank” kernels that were in early stages of decay.
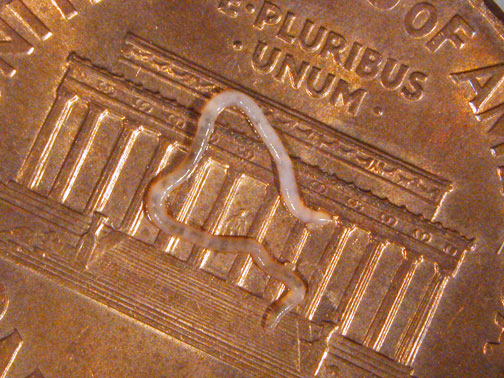
Potworm on a penny
It’s not a nematode: Juvenile (“baby”) earthworms and potworms are closely related and common animals found in soils. They are small, colorless, and often less than 1/4 inch long (taxonomic Phylum containing segmented worms). As you would expect, these worms feed on damaged and decaying plant remains, not live tissue. Therefore they are closely associated with the decaying plant parts and surrounding soil and often wrongly accused of damaging seedlings. Pest managers should keep an open mind when diagnosing field problems. As one submitter confessed, he was so convinced that it was an insect problem and therefore looked for anything moving when he couldn’t find grubs or wireworms.
The real McCoy’s of early-season damage: grubs, wireworms, seedcorn maggots, cutworms, and armyworm are all being reported from throughout the state with varying degrees of damage. This doesn’t come as a surprise, considering once again the growing conditions for the last two weeks. One message that has been repeated is that the low rates of seed-applied insecticides (i.e., Cruiser and Poncho) are not preventing economic stand losses from grubs, wireworms and cutworms. The product label specifies “protection,” from these early season pests. The problem is that these systemic insecticides require a vigorously growing plant for uptake, yet they are most needed when the environment is not conducive to growth. This paradox will no doubt be remembered and discussed after this growing season.
![]()
Armyworm, Don’t Go Away - (John Obermeyer)
Reports from Brad Shelton, Washington County CES, and Betsy Smith-Bower, Grower’s Co-op in western Indiana Counties indicate that armyworm haven’t gone away for the 2006 season. All damage found was in corn and worms ranged from 3/8 to 3/4 inch long, smaller than anticipated for this time in May. Refer to Pest&Crop #7, May 12, 2006, for scouting and threshold levels. Armyworm this small indicate that much of the feeding has yet to occur. Inspect high-risk crops!
![]()
Click for Table.
Black Light Catch Report.
![]()
Herbicide Rotation Restrictions and Application Times – (Glenn Nice, Bill Johnson, and Tom Bauman)
- Numerous pest and non-pests are being found in poor emerging/growing fields.
- Some animals are feeding on dead/decaying plant material.
- A plethora of pests are being reported, even where seed-insecticides have been used.
Due to the recent cold, wet weather, we will likely run into situations where crops are short, butphysiologically advanced in terms of their growth stages. It would be prudent to properly stage crops before applying post emergence herbicides and use the information in the following tables to determine if the product is labeled for application to a crop at the specific growth stage. It is the response and physiological properties of the plants we use as crops that allow us to use some herbicides but not others at various times. Knowing when the development of the wheat head is occurring often leads to a cut off time for the use of growth regulators.
We have received a few inquiries about wheat injured by growth regulator herbicides. In these cases the growth regulators were applied in the fall or in the spring after the joint stage. Our previous research has shown a pretty consistent yield reduction in wheat when these applications are made in the fall or after the joint stage in the spring. As we move into the postemergence herbicide application season in corn, it would be wise to understand the growth stage limitations of the products you will be using. The questions might be asked why can we not apply Accent over the top of corn at the 6 collar leaf stage? At about this time the twelfth node is being developed in the corn plant, it is approximately that node that will eventually produce the ear of corn. Accent, a sulfonylurea herbicide, can interfere with the development of that ear if an over the top application deposits the herbicide in the whorl at that time. So the correct timing of use of a herbicides is essential to limit injury. The following tables provide a diagram of application timing for several of the corn, soybean, and wheat herbicides. These were takenfrom the following article “Herbicide Application Timing for Corn, Soybean, and Wheat” http://www.btny.purdue.edu/weedscience/2003/Articles/herbtiming03.pdf.
Also, keep in mind that you may have some places in a field where the crop is more advanced than in other places. In some cases we are tricked by spots in a field where plants may be further along than other areas of the field due to accumulations of resources or nutrients. It would be a good idea to scout all of the low spots and high spots to accurately determine crop growth stage before applying postemergence herbicides in corn.
Table 1. Corn
Table 2. Soybean
Table 3. Wheat
![]()
Nitrate-Nitrogen: Here Today Gone Tomorrow? - (Jim Camberato and Brad Joern)
- Leaching of nitrate on sandy soils in southwestern Indiana has likely been substantial this spring unless early season fertilizer applications utilized a nitrification inhibitor.
- Some of the nitrate applied to sandy soils in northern Indiana has probably been lost from the rootzone as well. However, fertilizer added as ammonium in cold northern Indiana soils was likely still in the ammonium form when the rains came and most of the applied ammonium likely still remains in the rootzone.
- Loss of nitrate via denitrification in poorly-drained soils has probably been minimal in northern Indiana and low in central to southern Indiana.
- Although warm soil temperatures promoted conversion of ammonium to nitrate in late April and early May in central and southern Indiana, these soils were relatively cold (<55 °F) during the rainy periods and this likely limited the amount of denitrification that occurred.
Nitrogen (N) is often the most limiting nutrient for corn production and many factors must be considered when determining the right amount of N to apply for optimum economic yields. One factor is how much N has been lost before the crop can accumulate it. Spring rainfall in particular can reduce the amount of N remaining in the rootzone from pre-plant and at-planting fertilizer applications. The recent rains have many folks wondering how much N has been lost from these applications. While we can not give you field-specific estimates of N loss, we can offer some guidelines to help you estimate these losses based on regional soil temperatures and rainfall
Nitrogen form determines susceptibility to N loss
The form of N present in the soil determines its susceptibility to loss. Nitrogen in the ammonium (NH4+) form is attracted to the soil cation exchange sites so it does not leach below the rootzone. Nor is NH4+ subject to a process called denitrification [when nitrate nitrogen (NO3-) is changed into various gas forms and lost to the atmosphere]. If N stayed in the NH4+ form then N losses would be minimal no matter how much it rained. Unfortunately that is not the case. Ammonium is normally converted to NO3- by soil bacteria and NO3- is both leachable in sandy soils and subject to denitrification in poorly drained soils. The amount of N lost from soils depends on when the NH4+ changes to NO3-, how much rainfall occurs after the NO3- is formed, the water holding characteristics of the soil, the soil temperature when the soil is saturated and the length of time the soil remains saturated.
Although we know the amount of N we already have applied, when it was applied, and what form it was in, we only can make educated guesses on how fast the NH4+ changed to NO3-and how much NO3- has been lost.
Conversion of NH4+ to NO3 - the first step in N loss
Nitrogen applied as anhydrous ammonia is all NH4+ once it dissolves in the soil water. Anhydrous is toxic to the NH4+-converting bacteria in the injection zone and it takes about 2 weeks for them to repopulate the application zone soil and begin converting NH4+ to NO3-. Urea ammonium nitrate (UAN) solutions are more susceptible to leaching and denitrification than anhydrous because 25% of the N at application is already in the NO3- form. Also, the conversion of NH4+ to NO3- begins immediately after application if temperatures are warm because the UAN does not reduce soil bacteria populations. Conversion of NH4+ to NO3- from urea is the same as that from UAN.
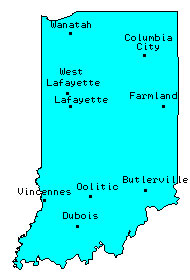
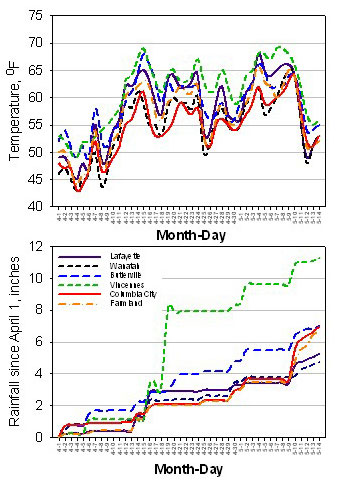
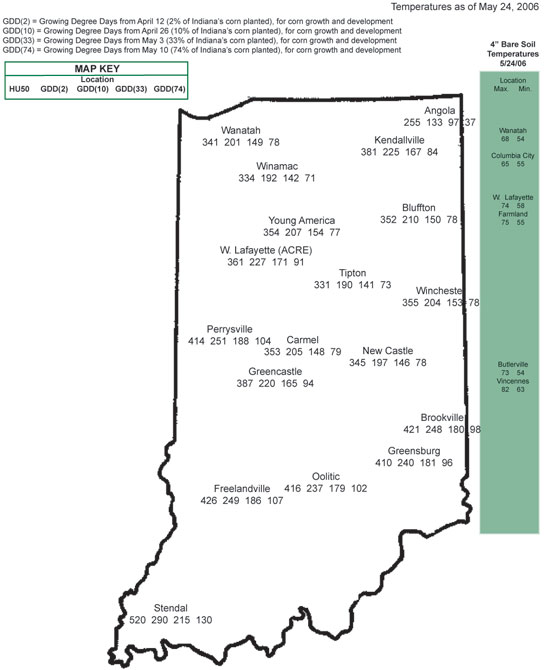
Figure 1. (a) Daily average soil temperature at a 4" depth and (b) cumulative rainfall for Purdue Agriculture Centers. The legend for locations is given in (b) and on the map.
Conversion rates of NH4+ to NO3- are highly dependent on soil temperature. Little conversion occurs when soils are below 50°F. At temperatures near 60°F complete conversion is estimated to take less than 14 days and at greater than 70°F, less than 7 days. Soil temperatures in southern and central Indiana have been above 60°F on a regular basis since April 15th (Figure 1a). Average soil temperatures at the 4” depth this spring were greater than 60°F on 29, 21, 21, and 18 days at the Purdue Agricultural Centers (PACs) in Vincennes, Butlerville, Lafayette, and Farmland, respectively. Thus, significant amount of N have been converted to NO3- in these areas already. In northern Indiana at the PACs in Wanatah and Columbia City there have been only 8 and 6 days with average soil temperatures above 60°F so much of the N applied as NH4+may still be in the NH4+ form.
Nitrification inhibitors, such as nitrapyrin, dicyandiamide, and ammonium thiosulfate, slow the conversion of NH4+to NO3- by affecting the soil bacteria. Conversion of NH4+to NO3- is limited for approximately 4-6 weeks after application with nitrapyrin or dicyandiamide. Ammonium thiosulfate may also slow conversion about 2-3 weeks.
At the time of these last rains at the end of the 2nd week of May, most of the NH4+ applied in northern Indiana was probably still in the NH4+ form and not subject to leaching or denitrification. Because of warmer soil temperatures in central and southern Indiana, a significant amount of the N applied as NH4+ without a nitrification inhibitor had likely been converted to NO3- and has a high potential for leaching and denitrification losses. Ammonium-N applied in April or later with an inhibitor is likely still in the NH4+ form.
And then the rains come - the second step in N loss
Leaching from sandy soils
Once NO3- is present in the soil its leaching is not temperature dependent. How deep in the soil profile the NO3- moves depends on the water holding capacity of the soil, how wet the soil is when it begins raining, and the amount of rainfall. A typical sandy soil in Indiana holds about 1-2 inches of rain in each foot of soil. Therefore the movement of NO3- downward is approximately 6 to 12 inches per inch of rainfall if the soil is at field capacity when it begins raining.
Rainfall since the beginning of April has likely caused significant leaching in sandy soils in northwest and southwest Indiana where sandy soils are prevalent (Figure 1b). In southwest Indiana, the Vincennes area has had nearly 12 inches of rainfall. Nitrate in sandy soils in this region was probably leached beyond the maximum rootzone of corn – 3 feet or more. The 4.7 inches of rain at Wanatah in northwest Indiana is likely to have caused substantial NO3- leaching from the rootzone as well.
Denitrification in poorly-drained soils
Spring rainfall has been sufficient to saturate poorly-drained soils in most of Indiana. Denitrification will take place in saturated soils if NO3- is present and soil temperatures are warm enough. Denitrification is negligible below 50°F but increases to as much as 5% of the NO3-N per day of saturation at soil temperatures of 70°F.
Temperatures in southern and central Indiana have been high enough to result in some denitrification in poorly-drained soils, but substantial NO3- losses are unlikely because soil temperatures at most locations were around 55°F or lower when the rainy period began on May 1 and 11.
Using soil testing to measure NO3-
One way to get a somewhat better estimate of soil N supply is to take a soil sample and have it analyzed for NO3. The later in the season this is done the better. Standard recommendations suggest sampling when corn is at the 4- to 6-leaf stage; hence it is called the pre-sidedress soil NO3- test or PSNT. The best situation to utilize this procedure is when manure has been broadcast in the fall or early spring. Specific recommendations for preplant N have not been developed and use of the procedure with banded manure or fertilizers is difficult because of sampling issues. Because of the variability in soil N across fields a sampling area of no more than 10 uniform acres is recommended and each sample should consist of 15-25 cores taken 1 foot deep. You should dry the sample before mailing to a soil testing laboratory so your results will reflect the soil condition when it was sampled.
Results of the soil NO3- test are typically reported in parts per million (ppm) or milligrams per kilogram (mg/kg) which are equivalent in value. If more than 25 ppm NO3-N is found in the sample then no additional N is recommended. This amount of NO3- is unlikely unless a high rate of preplant fertilizer or manure has been applied. At lower levels of NO3-N, adjustments can be made to sidedress N rates. If little NO3- is found it might indicate that NH4+ had not yet been converted to NO3- as well as indicating loss of NO3- from the rootzone so some interpretation of the results is needed. More information on the PSNT can be obtained at: http://www.agry.purdue.edu/ext/pubs/AY-314-W.pdf.
How do we stand on early-season N loss?
Leaching of NO3- on sandy soils in southwestern Indiana has likely been substantial this spring unless early season fertilizer applications utilized a nitrification inhibitor. Some of the NO3- applied to sandy soils in northern Indiana has probably been lost from the rootzone as well. However, fertilizer added as NH4+ in cold northern Indiana soils was likely still in the NH4+ form when the rains came and most of the applied NH4+ likely still remains in the rootzone.
Loss of NO3- via denitrification in poorly-drained soils has probably been minimal in northern Indiana and low in central to southern Indiana. Although warm soil temperatures promoted conversion of NH4+ to NO3- in late April and early May in central and southern Indiana, these soils were relatively cold (<55°F) during the rainy periods and this likely limited the amount of denitrification that occurred.![]()
Crappy Stands of Corn – (R.L. (Bob) Nielsen)
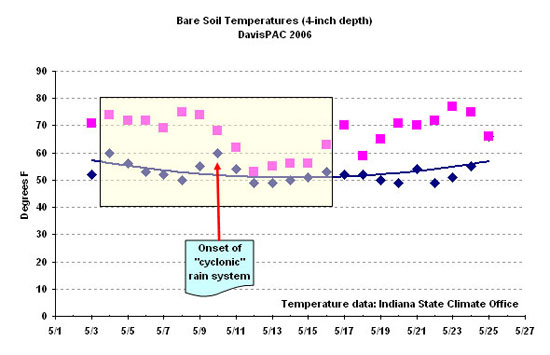
If you’ve been walking your fields lately, it is no surprise that much of what planted during the 5 days or so before the onset of nearly 10 days of cyclonic rain quite honestly looks like crap (my favorite technical term that describes a generally poor appearance of a corn crop). Corn planted nearly two weeks ago around the state is just now beginning to emerge and doing so very erratically. As I fearmongered two weeks ago (Nielsen, 12 May 2006), the causes of the problems are multiple and include dense soil surface crusts restricting coleoptile emergence, seed rots, seedling blight, chilling injury, stress from saturated soils, and some soil-borne insect damage.
It is likely that corn planted just prior to the decrease in soil temperatures experienced varying degrees of chilling injury (Saab & Butzen, 2006) during the initial stages of the germination process due not just to the drop in soil temperature itself, but the fact that the sub-optimal temperatures lingered for nearly a week after many of these fields were planted. The accompanying figure illustrates the approximate 10 degree (F) drop in both daily maximum and minimum soil temperatures for nearly six days at the Davis-Purdue Ag. Center in eastern Indiana (Randolph Co.). Chilling injury can result in seeds swollen but not germinated, deformed growth of the mesocotyl (corkscrewing), or visibly damaged areas of the mesocotyl or coleoptile.
Two of the more interesting symptoms being reported are the loss of either the radical root or mesocotyl + coleoptile. By “loss”, I mean the fact that these plant parts are sometimes completely absent or are present but easily broken off due to severe deterioration of the plant tissue at the point where they connect to the embryo of the kernel. It is not clear whether the cause is simply disease or possibly chilling injury or both. What is interesting is that initial appearance of the plant parts does not immediately signal a problem, but subsequent handling of the seedling often results in the breakage of the plant part from the seedling. The loss of the radical root does not necessarily mean death to the seedling, but loss of the mesocotyl + coleoptile is obviously lethal.
Additionally, the lengthy period of saturated soils during the early stages of germination and emergence likely stressed the seedlings by virtue of oxygen deprivation. Seed and/or seedling diseases were likely not an issue initially due to the protection afforded by the fungicidal seed treatments, but as their activity deteriorates the “door is opening” for soil-borne diseases to attack the kernels, seed roots, and mesocotyls.
Similar to parts of Indiana in 2005, severe soil crusting has added to the woes of an emerging corn crop. The impact of a soil crust on emergence is most evident when it develops prior to the initial elongation of the “spike” or mesocotyl + coleoptile. Rotary hoes have already been in use across the region with varying degrees of success in breaking up the crust. Some folks have taken the planters back to the field and run them shallowly over the existing furrow to break the crust. Of course, the challenge with this strategy is to balance the benefit of breaking the crust while avoiding damage to the emerging seedlings.
Many growers are faced with the challenge of accurately assessing the extent and health of surviving stands in order to make a reasoned replant decision (Nielsen, 15 May 2006). The challenge lies in the fact that germination and emergence have been so very slow in response to the dramatic cooling down of soils that occurred with the arrival of the rains on 10 May.
Growers should also remember that slow germination and emergence by itself does not automatically translate to a failed stand. The number of heat units (GDDs) from planting to emergence typically ranges from 100 to 125 (modified 86/50 cutoff method). Corn planted on 8 May in eastern Indiana, for example, only just reached that GDD range by about 22 May (GDDs based on soil temperature). IF (note the emphasis on “if”) such delayed seedlings are otherwise healthy, they will likely develop into normal plants.
The bottom line is that until emergence is complete, it is nearly impossible to accurately estimate effective (healthy and vigorous) plant populations across entire fields. With the current warming trend, growers should be in a better position by the end of this week (Memorial Day weekend) to make these important stand assessments.
Related References
Nielsen, RL (Bob). 12 May 2006. Take Time to Evaluate Corn Stand Establishment. Corny News Network, Purdue Univ. Online at http://www.kingcorn.org/news/articles.06/CornStandEval-0512.html [URL verified 5/25/06].
Nielsen, RL (Bob). 15 May 2006. Corn Replant Decision-Making. Corny News Network, Purdue Univ. Online at http://www.kingcorn.org/news/articles.06/Replant-0515.html [URL verified 5/25/06].
Nielsen, RL (Bob). 16 May 2006. Late Planting/Replanting & Relative Hybrid Maturity. Corny News Network, Purdue Univ. Online at http://www.kingcorn.org/news/articles.06/HybridMaturity-0516.html [URL verified 5/25/06].
Saab, Imad and Steve Butzen. 2006. Diagnosing Chilling and Flooding Injury to Corn Prior to Emergence. Pioneer Hi-Bred Int’l. Online at https://www.pioneer.com/growingpoint/agronomy/library_corn/crop_injury/flooding_injury.jsp [URL verified 5/25/06, but requires free online registration to view].
Don’t forget, this and other timely information about corn can be viewed at the Chat ‘n Chew Café on the Web at http://www.kingcorn.org/cafe. For other information about corn, take a look at the Corn Growers’ Guidebook on the Web at http://www.kingcorn.org.
![]()
Bug Scout
This is one of Nielsen's "crappy corn stands"!
![]()
Thin Soybean Stands – Should I Replant, Fill In, or Leave it Alone? - (Shawn P. Conley)
A significant number of soybean acres where planted just prior to a cool, rainy period that began May 10th. From May 10th to the 22nd there were only 56 GDU (base 50°, Lafayette) accumulated, compared to 163 GDU during this same time last year. As weather conditions improve and soybeans begin to emerge, questions may arise concerning replanting thin stands caused by poor emergence, crusting, and seedling diseases. Prior to replanting it is essential that an accurate estimate of soybean stand is determined. Our data indicate that a relatively uniform stand of 100,000 plants per acre in drilled and 15 inch rows and 80,000 plants in 30 inch rows will yield 100%. Our data also indicates that a stand of 50,000 plants per acre will yield only 13% less than the maximum yield (for additional yield loss based on plant population please refer to the 2006 Purdue University Corn and Soybean Field Guide ID-179 p. 111) In a normal year when soybeans were planted early and growers could replant for less than a 13% yield loss than that may be the appropriate decision. Unfortunately we are rapidly approaching the end of the optimal planting date window (90% change that yield is maximized). This optimal window for the upper 1/2 to 2/3 of Indiana is between April 20th and May 26th. In some years this window can stretch into the first two weeks of June however the risk of yield loss is increased once we get past May 26th. As we approach that date growers must now factor in decreased yield potential into the replant decision. If soybean stands are only thin in certain areas of a field it is a common practice to fill in those areas with a 30” row planter. Our data suggests that there is no advantage to filling in a thin stand (66,000 plants per acre) with rowed beans (Figure 1). The damage done to the original thin stand coupled with decreased yield potential from the supplemental seeding (late planting date and competition from original stand) will yield the same as if the grower did nothing. Totally replanting this thin stand would significantly reduce yield. The main grower concern with leaving a thin stand alone is weed control. Our data suggests that the weed control technology that we have available today minimizes that concern. A grower should consider the economics of seed input cost (~$31.50 per unit) versus the potential for another pass for weed control ($10.50 per acre (1 qt. glyphosate + application cost)). There is less than a 50% chance that an additional weed control pass will be needed in the thin areas as compared to the normal stands unless this is a wet area that consistently has high weed pressure to begin with.
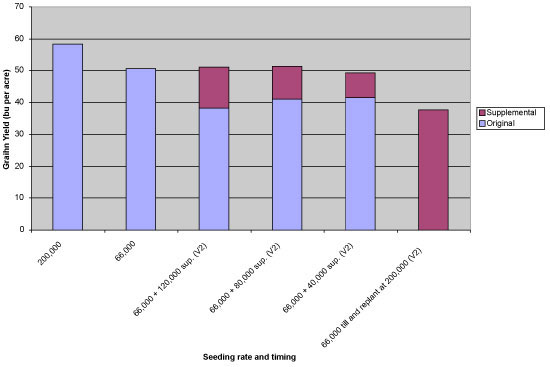
Figure 1. Effect of filling in a thin soybean stand (7.5" rows) with a 30" row planter at V2 soybean. (Semmel and Christmas, 2002)
![]()
Is it Time to Plant an Earlier Maturity Group Soybean? - (Shawn P. Conley and Greg Shaner, State Soybean Extension Specialist and Extension Pathologist)
As weather conditions continue to keep growers out of the field, questions begin to arise concerning the effect of the delayed planting date on maturity and yield. The main question is “Should I trade in my full season soybean variety for an earlier maturing variety”? Our data suggests only a 2% difference in yield between an adapted full-season variety and a mid-season variety through June 10th (Table 1). This difference slightly increases to 4% once we hit June 20th. It is not recommended that a full-season variety is planted past June 30th. This data suggests that it is not critical to begin switching soybean maturity groups until we get into mid-June or later. The reason for this recommendation is heat related. Assuming water is not limiting, the growth and development of a soybean plant is temperature driven. When comparing maturity groups 2.6 through 3.6 at W. Lafayette a month difference in planting date equated to only a 2 week difference in physiological maturity (R7 soybean) (Table 2). Once the soybean crop reaches the R7 growth stage the effect of stress on yield is minimal.
| Prior to November 2004 the main concern with delayed soybean maturity was frost damage. In 2006 we must also consider the risk of soybean rust. Though it is still unclear the impact this disease will have on Midwest soybean production, a delayed planting date will push the window when the crop is susceptible to this disease later into the season. Fungicide labels implicitly state that foliar fungicides can be applied up to R6 soybean. In 2005 a 3.6 maturity group soybean reached R6 on 8/13 when planted on 4/29/06 (Table 2). When planted on 6/02/05 the soybean did not reach R6 soybean until 8/26. This suggests that scouting may be extended later into the season and that continuous monitoring of the sentinel plot program will prove beneficial. |
|
|||||||||||||||||||||||||||
| Table 2. Effect of Planting Date on the Development and ield of Various Soybean Maturity Groups at W. Lafayette, IN, in 2005 | ||||||||||
Maturity Group |
Planting Date |
Date Growth Stage Was Initiated |
||||||||
R1 |
R2 |
R3 |
R4 |
R5 |
R6 |
R7 |
R8 |
Yield |
||
| 2.6 (1) | 4/29/2005 5/19/2005 6/02/2005 |
6/28 7/4 7/15 |
7/1 7/8 7/20 |
7/10 7/19 8/1 |
7/19 7/28 8/7 |
7/27 8/5 8/7 |
8/4 8/13 8/21 |
9/2 9/5 9/18 |
9/9 9/16 9/30 |
43.4 43.5 44.6 |
| 2.9 | 4/29/2005 5/19/2005 6/02/2005 |
6/28 7/6 7/11 |
7/1 7/9 7/20 |
7/10 7/22 8/4 |
7/20 7/31 8/10 |
8/1 8/10 8/15 |
8/11 8/19 8/24 |
9/4 9/7 9/18 |
9/11 9/18 9/28 |
50.6 46.5 43.7 |
| 3.1 | 4/29/2005 5/19/2005 6/02/2005 |
6/27 7/3 7/14 |
6/30 7/7 7/20 |
7/12 7/20 8/4 |
7/22 7/30 8/9 |
8/2 8/7 8/17 |
8/12 8/16 8/25 |
9/5 9/8 9/18 |
9/12 9/16 9/26 |
55.3 49.0 46.5 |
| 3.4 | 4/29/2005 5/19/2005 6/02/2005 |
6/28 7/5 7/14 |
7/1 7/8 7/20 |
7/16 7/22 8/7 |
7/28 8/3 8/14 |
8/7 8/10 8/20 |
8/17 9/1 8/29 |
9/6 9/12 9/21 |
9/16 9/22 9/30 |
48.8 42.9 44.8 |
| 3.6 | 4/29/2008 5/19/2005 6/02/2005 |
6/28 7/6 7/14 |
7/1 7/10 7/22 |
7/11 7/23 8/2 |
7/25 8/1 8/7 |
8/4 8/10 8/15 |
8/13 8/18 8/16 |
9/7 9/12 9/20 |
9/16 9/21 9/30 |
57.7 49.7 49.0 |
| 3.9 | 4/29/2005 5/19/2005 6/02/2005 |
6/29 7/6 7/15 |
7/1 7/10 7/23 |
7/12 7/29 8/4 |
7/26 8/5 8/9 |
8/7 8/11 8/18 |
8/16 8/21 8/28 |
9/10 9/17 10/2 |
9/23 9/28 * |
50.9 43.7 45.0 |
| (1) Only one variety was used for each maturity group. | ||||||||||
![]()
![]()
![]()