
Pest & Crop Newsletter
|
||||||||||||||||||||||||||||||||||||||||||||||||||||||||||||||||||||||||||||||||||||||||||||||||||||||||||||||||||||||||||||||||||||||||||||||||||||||||||||||||||||||||||||||||||||||||||||||||||||||||||||||||||||||||||||||||||||||||||||||||||||||||||||||||||||||||||||||||||||||||||||||||||||||||||||||||||||||
Soybean Insects and Defoliation– (John Obermeyer and Larry Bledsoe)
According to the Indiana Agricultural Statistics Service, as of July 18, twenty-two percent of the state’s soybean crop is setting pods (15% is the 5-year average). Pod development and fill are critical stages for the soybean crop, certainly a time when stress is undesirable. Bean leaf beetle, Japanese beetle, grasshoppers, and green cloverworm all feed-on soybean leaves. And even though soybeans have the amazing ability to withstand damage from defoliation, yield losses can occur. The best management guidelines for soybean defoliators involve identifying the insect pests and then characterizing the level of defoliation and growth stage of the beans. Then, management decisions will depend on anticipated market price of the soybeans, cost of treatment, the level of damage, the growth stage of the soybean, and potential yield. At mid pod fill, consider treatment when defoliation exceeds approximately 15 to 20% and the defoliator(s) is still present and actively feeding. Refer to the following table for treatment thresholds for insect defoliated soybeans. Japanese beetle develop from grubs that fed on organic matter and/or the roots of plants last fall and this spring. Therefore it seems logical that killing adult beetles this year should prevent grub damage in 2005. However it simply doesn’t work that way. Researchers’ attempts to draw in beetles to encourage them to lay eggs for subsequent grub damage in research plots have generally failed. Entomologists for years have been trying to understand this fickle creature. Basically, the adults feed, mate, and lay eggs when and where they want to. The grubs are just as unpredictable. Research attempts to correlate grub presence to crop damage have usually shown insignificant differences. Damage does occur, but we are just not usually able to predict when or assess how much. Consider that each beetle mates and lays eggs several times during its oviposition period. To prevent egg-laying in a field, one would need to treat multiple times during July and August.
Corn Blotch Leafminer, Again– (John Obermeyer and Lary Bledsoe)
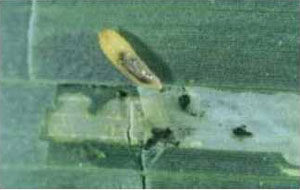
The following article is being reprinted, with slight updates, from last year’s Pest&Crop. Several calls from northern Indiana on this little-understood insect have necessitated this repeat. Besides, we have nothing else to add. Corn blotch leafminer, Agromyza parvicornis, is a leaf-feeding insect normally considered “occasional or non-economic.” The adult is a gray to brown fly 1/4 inch in length. In the early spring, adults insert eggs in either the upper or lower leaf surface of corn. The larva, or maggot, is yellowish and about 1/4 inch long when full grown. The larva pupates in a damaged leaf, or in the soil. Although there are several generations in a season, damage to only certain corn leaves indicates that infestations occur once per season. Larvae eat out the leaf interior leaving a transparent area or “mine.” Often many mines appear and sometimes merge on a single leaf. This can be quite an eye catcher, as leaves may appear completely bleached resembling herbicide damage.
There are no sampling methods or economic thresholds for corn blotch leafminer. The damage from this pest is believed to be of little economic importance as only a few leaves per plant are usually damaged. It has been suggested by colleagues at the University of Nebraska that the hail adjuster’s charts can be used to estimate potential losses from the leafminer damage. This data is available on pages 34-35 of the Corn and Soybean Field Guide, 2004 Edition (ID 179). From this chart, in order to expect a 5% yield loss, it would require 70% leaf defoliation (mining) in 7-leaf corn. In 10, 12, or 15-leaf corn it would require 45, 40, and 30% mining respectfully for a 5% yield loss. Corn in the silking to blister stage could have significant yield losses at 15-20 percent leaf defoliation. Even if a control were attempted, it would likely fail because the larvae are protected within the corn leaves. Treatments would have to target the adult flies, which would be difficult with one insecticide application. It is possible that foliar insecticides may worsen the damage. An early investigator of this insect, W. J. Phillips wrote in 1914: “With such a host of... constantly on the watch, we need not concern ourselves seriously with remedies so long as conditions continue as they are now. In the event that a combination of circumstances should occur that would restrain the parasites and give free rein to their host, the blotch miner would undoubtedly prove a pest very difficult of control. This species seems to furnish an instance in which only the barrier of parasites stands between the farmer and what may easily become temporarily at least, a very serious pest.” Speculation as to why there is an “outbreak” of corn blotch leafminer points to either unique environmental conditions, which includes many variables, or practices that are inhibiting the natural parasites (e.g., multiple broadcast pesticide applications).
Click for Table.
|
||||||||||||||||||||||||||||||||||||||||||||||||||||||||||||||||||||||||||||||||||||||||||||||||||||||||||||||||||||||||||||||||||||||||||||||||||||||||||||||||||||||||||||||||||||||||||||||||||||||||||||||||||||||||||||||||||||||||||||||||||||||||||||||||||||||||||||||||||||||||||||||||||||||||||||||||||||||
Resistant Weeds – (Glenn Nice and Bill Johnson) Resistance can be defined as a plant biotype that is able to withstand an application of herbicide that once controlled it, and that this trait can be inherited by future generations. About this time of year suspicion starts to rise concerning resistant weeds in escapes. Is a field that has a large amount of escapes mean that the weed is resistant? Resistance develops from the natural selection for biotypes that survive the use of a herbicide. Continual use of the same type of herbicide is what can drive this system leading to a dominant resistant population in a location. If the development of resistance is possible in a specific plant, the use of herbicides with different modes of action can inhibit or slow this process down. Table 1 has a list of weeds that have been reported to be resistant in Indiana and the states surrounding Indiana. For a quick reference list of herbicide mode of action please see table provided in the 2004 Weed Control Guide for Ohio and Indiana or by typing the following address into your web browser http://www.btny.purdue.edu/Pubs/WS/WS-16/HerbSiteOfAction04.pdf I have observed that in the past resistant weeds can “sneak” up on us. What may appear as the odd escape can supply the seed bank, for several years. This may give the appearance of not being a problem, especially if the specific weed germinates late in the growing season. A couple of years down the road, we get either a flooding situation that distributes seed from somewhere else or optimum germinating conditions for a specific weed and then we have a field full of the resistant biotypes of that weed. If you suspect you may have a resistant weed on your hands and would like further conformation in the way of a greenhouse trial, please send mature seed or seed heads from the plants with the completed form given at this address; http://www.btny.purdue.edu/weedscience/2003/Articles/sform9-2-03.pdf. Please be aware some seed or immature seed may not germinate well and results may not be obtainable. For more information on glyphosate resistant marestail/horseweed in Indiana, please go to the Purdue University Weed Science web site (www.btny.purdue.edu/weedscience).
|
||||||||||||||||||||||||||||||||||||||||||||||||||||||||||||||||||||||||||||||||||||||||||||||||||||||||||||||||||||||||||||||||||||||||||||||||||||||||||||||||||||||||||||||||||||||||||||||||||||||||||||||||||||||||||||||||||||||||||||||||||||||||||||||||||||||||||||||||||||||||||||||||||||||||||||||||||||||
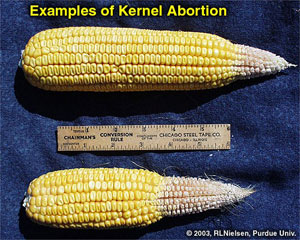
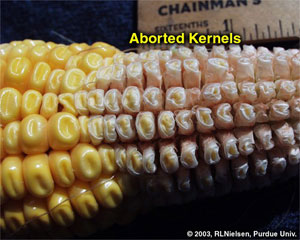
Yield Loss Potential During Grain Fill- (Bob Nielsen) Yield potential in corn is influenced at several stages of growth and development. Ear size potential (number of potential kernels) is determined quite early, from about knee-high to about shoulder-high, or from about leaf stage V6 to V15. The next influential period for the corn crop is pollination. The period following successful pollination and finishing at kernel black layer is defined as the grain filling period in corn and represents the final important yield determining time frame. Grain fill stages in corn are described in an accompanying article. Perfect conditions for ear size determination and pollinations can still be negated if severe stress occurs during the grain fill period. Yield loss during grain fill can occur from stand loss, incomplete kernel set, lightweight kernels, and premature plant death. Stand Loss During Grain Fill Incomplete Kernel Set in Corn One of the causes of incomplete kernel set is unsuccessful pollination. Unsuccessful pollination results in ovules that are never fertilized and, subsequently, ears with varying degrees and patterns of incomplete kernel set. Many factors can cause incomplete pollination and distinguishing between them can be very difficult. Certain insects like corn rootworm beetles and Japanese beetles can interfere with pollination and fertilization by their silk clipping action. These insects feed on pollen and subsequently clip silks as they feed on the pollen that has been captured by the silks. Unusually early or late pollinating fields are often particularly attractive to these insects. Drought stress may delay silk emergence until pollen shed is nearly or completely finished. During periods of high temperatures, low relative humidities, and inadequate soil moisture levels, exposed silks may also dessicate and become non-receptive to pollen germination. Unusually favorable conditions prior to pollination that favor ear size determination can result in ears with an unusually high number of potential kernels per row. Remember that silk elongation begins near the butt of the ear and progresses up toward the tip. The tip silks are typically the last to emerge from the husk leaves. If ears are unusually long (many kernels per row), the final silks from the tip of the ear may emerge after all the pollen has been shed. Another cause of incomplete kernel set is abortion of fertilized ovules. Aborted kernels are distinguished from unfertilized ovules in that aborted kernels had actually begun development. Aborted kernels will be shrunken, mostly white, often with the yellow embryo visible; compared to normal plump yellow kernels.
Kernels are most susceptible to abortion during the first 2 weeks following pollination, particularly kernels near the tip of the ear. Tip kernels are generally last to be fertilized, less vigorous than the rest, and are most susceptible to abortion. Once kernels have reached the dough stage of development, further yield losses will occur mainly from reductions in kernel dry weight accumulation. Severe drought stress that continues into the early stages of kernel development (blister and milk stages) can easily abort developing kernels. Severe nutrient deficiencies (especially nitrogen) can also abort kernels if enough of the photosynthetic “factory” is damaged. Extensive loss of green leaf tissue by certain leaf diseases, such as common rust or gray leaf spot, by the time pollination occurs may limit photosynthate production enough to cause kernel abortion. Consecutive days of heavily overcast, cloudy conditions may also reduce photosynthesis enough to cause abortion in recently fertilized ovules. Decreased Kernel Weight Once grain has reached physiological maturity, stress will have no further physiological effect on final yield, because final yield is already achieved. Stalk and ear rots, however, can continue to develop after corn has reached physiological maturity and indirectly reduce grain yield. Premature Plant Death Premature death of whole plants results in greater yield losses than if only leaves are killed. Death of all plant tissue prevents any further remobilization of stored carbohydrates to the developing ear. Whole plant death that occurs before normal black layer formation will cause premature black layer development, resulting in incomplete grain fill and lightweight, chaffy grain. Grain moisture will be greater than 35%, requiring substantial field drydown before harvest. Related References Nielsen, R.L. (Bob). 2002. Some Droughty Fields Experiencing Silk Emergence Delay. Corny News Network, Purdue Univ. Online at www.kingcorn.org/news/articles.02/SilkDelay-0726.html. (URL verified 7/5/04) Nielsen, R.L. (Bob). 2003a. Ear Initiation & Size Determination in Corn. Corny News Network, Purdue Univ. Online at www.agry.purdue.edu/ext/corn/news/articles.03/EarSize-0610.html. (URL verified 7/5/04) Nielsen, R.L. (Bob). 2003b. Silk Emergence. Corny News Network, Purdue Univ. Online at www.kingcorn.org/news/articles.03/Silks-0716.html. (URL verified 7/5/04) Nielsen, R.L. (Bob). 2003c. Tassel Emergence & Pollen Shed. Corny News Network, Purdue Univ. Online at www.kingcorn.org/news/articles.03/Tassels-0716.html. (URL verified 7/5/04) Nielsen, R.L. (Bob). 2004. Grain Fill Stages in Corn. Corny News Network, Purdue Univ. Online at www.kingcorn.org/news/articles.04/GrainFill-0705.html. (URL verified 7/5/04)
Estimating Corn Grain Yield Prior to Harvest- (Bob Nielsen) Fancy colored yield maps are fine for verifying grain yields at the end of the harvest season, but bragging rights for the highest corn yields are established earlier than that down at the Main Street Cafe, on the corner of 5th and Earl. Some patrons of the cafe begin “eyeballing” their yields as soon as their crops reach “roasting ear” stage. Some of the guys there are pretty good (or just plain lucky) at estimating yields prior to harvest, while the estimates by others are not even close to being within the proverbial ballpark. Interestingly, they all use the same procedure referred to as the Yield Component Method.
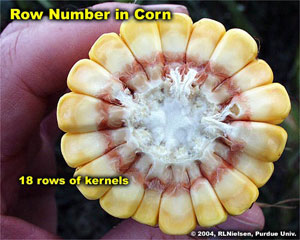
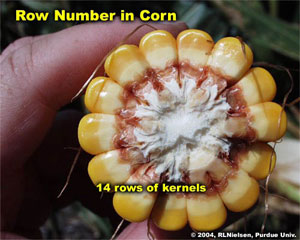
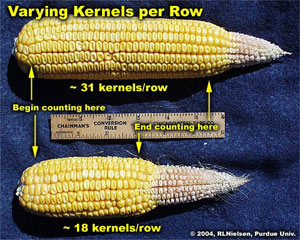
Other pre-harvest yield prediction methods exist (Lauer, 2002; Thomison, 2003), but the Yield Component Method is probably the most popular because it can be used well ahead of harvest; as early as the so-called “roasting ear” or milk (R3) stage of kernel development. Under “normal” conditions, the kernel milk stage occurs about 18 to 22 days after pollination is complete (Nielsen, 2004a). Estimates made earlier in the kernel development period risk being overly optimistic if subsequent severe stresses cause unforeseen kernel abortion (Nielsen, 2004b). The Yield Component Method is based on the premise that one can estimate grain yield from estimates of the yield components that constitute grain yield. These yield components include number of ears per acre, number of kernel rows per ear, number of kernels per row, and weight per kernel. The first three yield components (ear number, kernel rows, kernels/row) are easily measured in the field. Final weight per kernel obviously cannot be measured until the grain is mature (kernel black layer) and, realistically, at harvest moisture. Consequently, an average value for kernel weight, expressed as 90,000 kernels per 56 lb bushel, is used as a proverbial “fudge factor” in the yield estimation equation. Crop uniformity greatly influences the accuracy of any yield estimation technique. The less uniform the field, the greater the number of samples that should be taken to estimate yield for the field. There is a fine line between fairly sampling disparate areas of the field and sampling randomly within a field so as not to unfairly bias the yield estimates up or down.
TIP: For other row spacings, divide 43,560 by the row spacing (in feet) and then divide that result by 1000 (e.g., [43,560/2.5]/1000 = 17.4 ft).
TIP: Do not count dropped ears or those on severely lodged plants unless you are confident that the combine header will be able to retrieve them.
TIPS: Do not sample nubbins or obviously odd ears, unless they fairly represent the sample area. If row number changes from butt to tip (e.g., pinched ears due to stress), estimate an average row number for the ear. Don’t count the extreme butt or tip kernels, but rather begin and end where you perceive there are complete “rings” of kernels around the cob. Do not count aborted kernels. If kernel numbers are uneven among the rows of an ear, estimate an average value for kernel number per row.
EXAMPLE: For five sample ears with 480, 500, 450, 600, and 525 kernels per ear, the average number of kernels per ear would be (480 + 500 + 450 + 600 + 525) divided by 5 = 511.
TIP: Use a lower value (e.g., 80) if grain fill conditions have been excellent (larger kernels, fewer per bushel) or a larger value (e.g., 100) if grain fill conditions have been stressful (smaller kernels, more per bushel).
Example Let’s say you counted 30 harvestable ears at the first sampling site. Let’s also assume that the average number of kernels per ear, based on sampling every 5th ear in the sampling row, was 511. The estimated yield for that site would (30 x 511) divided by 90, which equals 170 bu./ac. Repeat the procedure throughout field as many times as you deem to be representative. Calculate the average yield for all the sites to estimate the yield for the field. Remember that this method for estimating pre-harvest grain yield in corn indeed provides only an estimate. Since kernel size and weight will vary depending on hybrid and environment, this yield estimator should only be used to determine “ballpark” grain yields. Yield will be overestimated in a year with poor grain fill conditions (e.g., low kernel size and weight from a drought year) and underestimated in a year with excellent grain fill conditions (e.g., larger kernel size and weight from non-stress grain fill periods). You can try to improve the yield estimation for unusual grain fill conditions by adjusting the estimation formula . For example, if you believe that kernel weight will be lower due to stress during grain fill, you may elect to replace the value of “90” in the equation with “100” to reflect the potential for smaller and lighter kernels (i.e., more kernels per 56 lb. bushel). Conversely, in a good crop year, you may elect to replace the value of “90” in the equation with “80” to reflect the potential for larger and heavier kernels (i.e., fewer kernels per 56 lb. bushel). Recognize that the Yield Component Method for estimating corn grain yield is probably only accurate within plus or minus 30 bushels of the actual yield. Obviously, the more samples you measure within a field, the more accurately you will “capture” the variability of yield throughout the field. Use the yield estimates obtained by this method for general planning purposes only. ** Thanks to Emerson Nafziger, Univ. of Illinois, for suggested revisions to the kernel number calculations. Illinois Agronomy Handbook. 2004.Estimating Corn Yields. (An Online Calculator) Univ. of Illinois. Online at http://www.ag.uiuc.edu/iah/index.php?ch=ch2/est_corn_yield.html&m=CFAR. (URL verified 7/11/04, but temporarily off-line as of 7/18/04) Lauer, Joe. 2002. Methods for Calculating Corn Yield. Agronomy Advice, Univ. of Wisconsin-Madison. Online at http://corn.agronomy.wisc.edu/AAdvice/2002/A033.pdf. (URL verified 7/11/04) Nielsen, R.L. (Bob). 2004a. Grain Fill Stages in Corn. Corny News Network, Purdue Univ. Online at http://www.kingcorn.org/news/articles.04/GrainFill-0705.html. (URL verified 7/18/04) Nielsen, R.L. (Bob). 2004b. Yield Loss Potential During Grain Fill. Corny News Network, Purdue Univ. Online at http://www.kingcorn.org/news/articles.04/GrainFillStress-0705.html. (URL verified 7/18/04) Thomison, Peter. 2003. Estimating Corn Yields Prior to Harvest. C.O.R.N. Newsletter, Ohio State Univ. Online at http://corn.osu.edu/archive/2003/aug/03-28.html#linkc. (URL verified 7/11/04).
|
||||||||||||||||||||||||||||||||||||||||||||||||||||||||||||||||||||||||||||||||||||||||||||||||||||||||||||||||||||||||||||||||||||||||||||||||||||||||||||||||||||||||||||||||||||||||||||||||||||||||||||||||||||||||||||||||||||||||||||||||||||||||||||||||||||||||||||||||||||||||||||||||||||||||||||||||||||||

![]()