Pest & Crop Newsletter
|
||||||||||||||||||||||||||||||||||||
Soybean Aphid Throughout Most of Indiana– (John Obermeyer and Larry Bledsoe)
Soybean aphid populations vary greatly not only in areas of the state, but locations in the field as well. Most calls concerning threatening populations have come from the northern counties. Recently, pest managers in central counties have begun calling with questions about aphids and control. Some significant populations have been reported as far south as Columbus (Bartholomew County). Lots of questions and few well researched answers have led to confusion on treatment guidelines. The following are our control recommendations based on current understanding of the pest the Midwest:
We are aware of at least one chemical company aggressively marketing their product in areas where aphid numbers are low with boasts of yield guarantees. Don’t be swayed by these fear factor attempts. Don’t treat just because a neighbor is treating. Instead, scout your fields and make rational, informed decisions. Soybean growth stages:
Harvest Ristrictions for Soybean Aphid Insecticides– (John Obermeyer and Larry Bledsoe) The following listing includes insecticides registered for soybean aphid control, including rate per acre and harvest restrictions. Refer to the label for specific rates and application information.
Click for Table
|
||||||||||||||||||||||||||||||||||||
Stalk Health Issues in Stressed Corn- (Bob Nielsen) Even though the current USDA corn production estimate for Indiana is remarkably optimistic (<http://www.nass.usda.gov/in/pressrel/de081203.txt>), many growers recognize that individual fields or areas within fields have been struggling against multiple stresses throughout the season. Problems resulting from stress in 2003 include root damage and lower leaf death due to soggy soils, leaf canopy yellowing and death due to nitrogen deficiency resulting from soggy soils, stunted root and canopy development due to excessively dry soil moisture conditions, limited crop canopy photosynthesis due to frequent cloudy or hazy days, and root damage from corn rootworm larva feeding.
Fields or areas within fields that have suffered one or more of these stresses will be stressed further during the grain filling period as the photosynthetic factory tries to keep up with the physiological demands of the developing ears. In some severe situations, plants that are unable to keep up with the demand, due to less than healthy root systems or crop canopies, will resort to cannibalizing stored carbohydrate reserves in the lower stalk tissue and remobilizing those reserves to the developing ears. Such remobilization of stored carbohydrates from lower stalk tissue causes an overall deterioration of lower stalk integrity and strength. More importantly, as carbohydrate concentrations decrease in the lower stalk or root tissues, their resistance to the soil complex of root- and stalk-rotting organisms also decreases. Beginning in late August or early September, growers should begin regular inspections of suspect fields that have endured multiple stresses this year and monitor the general health of the lower stalk and roots of plants. Stalk health in such fields further stressed by excessively dry soil conditions during grain filling will be particularly suspect. The simplest diagnostic technique is to push stalks away from you as you walk down rows of corn and see whether they collapse and break or “spring back” to a vertical position. Easily broken plants signal either significant cannibalization of lower stalk tissue or development of stalk rot. In either case, such fields are prime candidates for stalk lodging concerns prior to harvest. Pinching lower stalk internodes between your fingers can identify lesser degrees of stalk health concerns. If the internodes “give way” or collapse easily, that is also a signal that stalk health has been compromised. Split such stalks in half and inspect the interior for obvious disease symptoms. Root health can be monitored first by attempting to pull plants out of the soil with your hands. If this can be done easily, chances are that root health has been compromised and the field is at risk of root lodging if severe windstorms occur prior to harvest. If plants do not pull easily, then dig a few plants, wash the soil away from the root system, and inspect the roots for discoloration (red, purple, brown) that could indicate early root rot development. If fields are identified that are clearly high risk for root or stalk lodging prior to harvest, then schedule these fields for earlier than anticipated harvest to minimize the risk and consequences of severe lodging relative to potential mechanical harvest losses. Related References: Shaner, G. and D. Scott. 1998. Stalk Rots of Corn (BP-59). Purdue Univ. Coop. Extension Service, W. Lafayette, IN. Available online at <http://www.agcom.purdue.edu/AgCom/Pubs/BP/BP-59.pm65.pdf>. [URL verified 8/13/03]. Malvick, D. 2000. Corn Stalk Rots (RPD-200). Univ. of Illinois Coop. Extension Service, Urbana, IL. Available online at <http://web.aces.uiuc.edu/vista/pdf_pubs/200.PDF>. [URL verified 8/13/03]. Munkvold, G. 1996.Corn Stalk Rot in Iowa (IPM-50). Iowa State Univ. Coop. Extension Service, Ames, IA. Available online at <http://www.ag.iastate.edu/departments/plantpath/extension/corn_stalk_rot.pdf>. [URL verified 8/13/03]. Stack, J. 1999. Common Stalk Rot Diseases of Corn (G99-1385-A). Univ. of Nebraska Coop. Extension Service, Lincoln, NE. Available online at <http://ianrsearch.unl.edu/pubs/plantdisease/g1385.htm>. [URL verified 8/13/03]. Vincelli, P. and D.E. Hershman. Corn Stalk Rots (PPA-26). Univ. of Kentucky Coop. Extension Service, Lexington, KY. Available online at <http://www.ca.uky.edu/agc/pubs/ppa/ppa26/ppa26.htm>. [URL verified 8/13/03].
Blunt Ear Syndrome in Corn- (Bob Nielsen) Blunt Ear Syndrome (BES) in corn, sometimes also referred to as “Beer Can Ear” Syndrome, is a curious oddity that occurs from time to time throughout the corn growing areas of the U.S. The major symptom of BES, unusually short ears, is the consequence of arrested ear development that likely occurs during the ear size determination period prior to pollination. Researchers at Colorado State University have devoted the most energy to investigating this problem, but the causes of the arrested ear development have not been conclusively identified (Pearson, 1998; Pearson & Brown, 1999; Pearson, 2000).
The cob of a “beer can” ear is remarkably short and the tip inch or so is often barren. Interestingly, kernel row number at the butt end of these ears appears to be reasonably normal. Part way up the ear, however, cob and kernel row development simply cease. Compared to a fairly typical 35 to 40 kernels per row, BES ears exhibit about half that length in terms of ovule number per row and often only 12 to 16 developed kernels per row. Silk balling, that occurs when the final silks do not successfully elongate through the remainder of the normal length husk leaves, causes the lack of kernels at the tips of BES cobs. More severe forms of BES occur from time to time, leaving one with what looks like a corny hand grenade. The tip of a BES cob sometimes exhibits a tassel branch-like appendage, while other ears exhibit an apparent remnant ear initial similar to that visible by dissection of ear shoots at about leaf stage V9 (nine visible leaf collars). The latter symptom suggests that development of the ear initial was interrupted or arrested between the time ear initiation occurred (about V5) and kernel row number was finalized (about V12). The half-length size of the cobs suggests that ear development was stopped at approximately leaf stages V8 to V9. Another possible cause of such a dramatic termination of ear development is chilling injury. Indeed, research reported from Belgium (Bechoux et al., 2000; Lejeune and Bernier, 1996) documented that chilling injury at the time of ear and tassel initiation (about V5) could prevent ear initiation altogether or reduce tassel branch and spikelet formation. Perhaps chilling injury to the developing ear at somewhat later leaf stages could similarly arrest further ear development? The term “chilling injury” does not necessarily translate simply to frost events. Temperatures in the high 40’s to low 50’s may be sufficient to injure meristematic regions of the corn plant, especially if temperatures during the days preceding the chilling injury were warm to excessively warm. Secondly, a new Ph.D. student working with me has begun a research project to investigate the possible link of chilling injury with the development of BES symptoms in corn. Briefly, the project involves the use of controlled environment growth chambers to “cold shock” young corn plants at several selected pre-pollination leaf stages. The plants will subsequently be evaluated for evidence of arrested ear development. Needless to say, this student is also very much interested in documenting background information about “real world” occurrences of this phenomenon if they arise this year. Toward that end, we would appreciate hearing about any instances of BES that are discovered this growing season. If our calendars permit, we would love to visit fields where BES is reported in order to document the background information associated with the field and cultural practices. If we cannot visit the field(s) ourselves, we would appreciate anyone who identifies fields with BES symptoms to send us digital images and/or complete a brief field information form that is downloadable at <http://www.kingcorn.org/research/beercan/FieldInfoform.pdf>. Lejeune, P. and G. Bernier. 1996. Effect of environment on the early steps of ear initiation in maize (Zea mays L.). Plant, Cell & Environment. 19:217-224. Nielsen, R.L. (Bob). 2001. “Beer Can Ear” Syndrome – 2001. Purdue Univ. Corny News Network. Available online at <http://www.agry.purdue.edu/ext/corn/news/articles.01/Beer_Cans-0907.html>. [URL verified 8/12/03]. Nielsen, R.L. (Bob). 2003. Ear Initiation & Size Determination in Corn. Purdue Univ. Corny News Network. Available online at <http://www.kingcorn.org/news/articles.03/EarSize-0610.html>. [URL verified 8/12/03]. Nielsen, R.L. (Bob). 2000. Scrambled Silks, Anyone? Purdue Univ. Corny News Network. Available online at <http://www.kingcorn.org/news/articles.00/SilkBalling-0718.html>. [URL verified 8/12/03]. Pearson, Calvin. 1998. Evaluation of Golden Harvest Corn Hybrids for Blunt Ear Syndrome. Western Colorado Research Center 1998 Annual Report. Colorado State Univ., Fruita, CO. Available online at <http://www.colostate.edu/programs/wcrc/annrpt/98/bluntear.pdf>. [URL verified 8/12/03]. Pearson, Calvin and William E. Brown. 1999. Effect of Methyl Bromide and Golden Harvest and Pioneer Corn Hybrids under Two Irrigation Managements on Blunt Ear Syndrome at Fruita, Colorado 1999. Western Colorado Research Center 1999Annual Report. Colorado State Univ., Fruita, CO. Available online at <http://www.colostate.edu/programs/wcrc/annrpt/99/BES99.htm>. [URL verified 8/12/03]. Pearson, Calvin. 2000. How Blunt Ear Syndrome of Corn is Affected by Hybrid and Irrigation at Fruita, Colorado 2000. Western Colorado Research Center 2000Annual Report. Colorado State Univ., Fruita, CO. Available online at <http://www.colostate.edu/programs/wcrc/annrpt/00/Pearson_BluntEarSyndrome.html>. [URL verified 8/12/03]. Don’t forget, this and other timely information about corn can be viewed at the Chat ‘n Chew CafÈ on the Web at <http://www.kingcorn.org/cafe>. For other information about corn, take a look at the Corn Growers’ Guidebook on the Web at <http://www.kingcorn.org>.
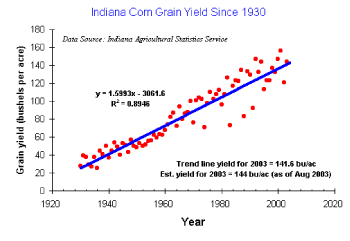
Corn Yield Trends for Indiana 1930-2003- (Bob Nielsen) Historical grain yields provide us with a glimpse of yields yet to come, although like the stock markets, past performance is no guarantee of the future. State average corn grain yield in Indiana has increased at a fairly constant 1.6 bushels per acre per year since 1930 primarily due to improved genetics and production technology (Fig. 1).
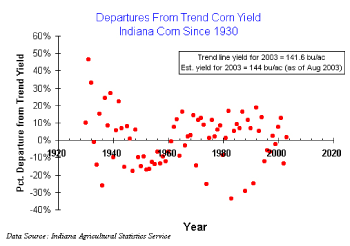
Since 1990, Indiana’s corn crop yield has split even, with half of those years below trend and half above. The current USDA estimate for 2003 puts the Indiana corn crop at 144 bushels per acre, or about 1.7 percent above the 2003 trend line yield of 141.6 bushels per acre (Fig 1). By comparison, recent years’ departures from trend yield (Fig. 2) were 2002 (-13.6 %), 2001 (+12.7 %), 2000 (+7.5 %) and 1999 (-2.4 %). August corn production estimates for each crop reporting district in Indiana are available in text or graphical formats.
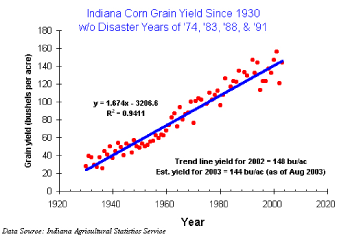
Because the departures from trend for these four years are so dramatic, it is of some interest to calculate the trend line for corn grain yield without their inclusion. In so doing, the annual rate of yield increase is slightly greater (1.67 versus 1.6 bu/ac/yr) and the estimated trend yield for 2003 changes from 141.6 to 148.0 bushels per acre (Fig. 3). Such values may be more true estimates of statewide yield potential in “normal” years.
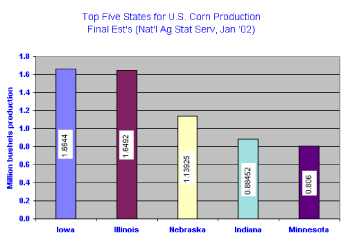
The top five U.S. corn grain producing states are Iowa, Illinois, Nebraska, Indiana and Minnesota (Fig. 4). As of the January 2003 final production estimates, these five states (6.08 million bushels) accounted for nearly 68 % of the total estimated grain yield for the U.S. in 2002 (9.01 million bushels).
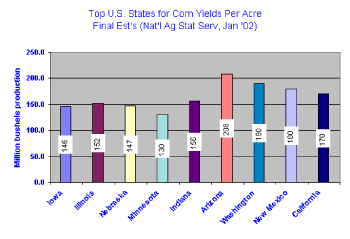
Interestingly, the trophy for top statewide yields per acre does not belong to any of these Midwestern states. Bragging rights for highest U.S. corn yields per acre belong to states farther to the west (Fig. 5). A few reasons for this include a) fewer cloudy and hazy days, b) less rainfall and humidity contributing to less disease, c) availability of irrigation, and d) fewer stressful hot nights during grainfill.
For More Information... For more statistics about Indiana agricultural production, “surf” on over to the home page of the Indiana Agricultural Statistics Service at <http://www.nass.usda.gov/in/>. For more statistics on U.S. national crop production estimates, look at the National Agricultural Statistics Service Crop Production page on the Web. This article is updated monthly and can be viewed at this same web address <http://www.kingcorn.org/news/articles.03/CornYldTrend2003.html>.
|
||||||||||||||||||||||||||||||||||||


