Pest & Crop

Pest & Crop Newsletter

Purdue Cooperative Extension Service
February 26, 2001 - Issue 1
In This Issue

Insects, Mites, and Nematodes
Agronomy Tips
  • Criteria for Treating First-Year Corn for Rotoworm, 2001
  • Soybean Seed Quality for 2001 Planting
  • Optimizing Nitrogen Fertilizer Decisions
  • Status of Indiana Wheat Crop
Weeds Bits & Pieces
  • New Corn and Soybean Herbicides for Year 2001
  • Crop Conference Ofers Timely Tips, Future Forecast
This will be your last P&C Newsletter if you haven't paid for your subscription for 2002!
Insects, Mites, and Nematodes

Mild Winter Temperatures and Field Crop Insects– (John Obermeyer, Rich Edwards, and Larry Bledsoe)

  • Temperature is just one factor that impacts an insect's winter survivability.
  • Spring temperatures and moisture generally have a greater influence on insect numbers and subsequent crop damage.
  • Production practices, such as date of planting, tillage type, and herbicide application, are often what makes or breaks an insect infestation.

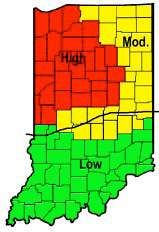
Even the most casual weather observer can’t ignore the fact that the weather this fall and winter, at least up to this week, has been mild. Data on ambient and soil temperatures back this up. Will this equate to large insect populations and serious crop damage this coming season? As you probably already guessed...it depends! Insect predictions are as reliable as NCAA basketball tournament picks. Although we can’t tell you for sure what will happen with these critters coming out of this winter, we can give you some information on insect/environment/crop interactions that might clear the picture some:

Above Ground Insects:

Bean Leaf Beetle
Overwintering stage – adults under leaf litter, grass clumps, etc.
Expected overwintering success – excellent
Crop damage increases with – early planted/emerging soybeans. Early in the spring beetles will feed on wild and cultivated legumes. Bean leaf beetle will then colonize the first emerging soybeans.
Concerns – besides potential reduced stands from damage to hypocotyls, cotyledons, and unifoliolate leaves, this beetle is a vector of the Bean Pod Mottle Virus. Early season inoculation of this disease will have the greatest impact on yield.
Considerations – beetle numbers were relatively low going into overwintering.

Corn Flea Beetle
Overwintering stage – adults in grassy areas or wood lots
Expected overwintering success – excellent
Crop damage increases with – early planted/emerging corn. Early in the spring beetles will feed on grasses. Corn flea beetle will then colonize first emerging corn. Some corn hybrids and inbreds are more susceptible than others.
Concerns – besides potential reduced stands from damage to emerging seedlings, this beetle is a vector of Stewart’s disease. Stewart’s disease is a greater threat to certain inbred lines of corn, some pop/sweet corn varieties, but rarely a concern in yellow dent corn.
Considerations – beetle numbers were relatively low going into overwintering.

European Corn Borer
Overwintering stage – larvae in corn stalks and possibly stalks of weed residue
Expected overwintering success – excellent
Crop damage increases due to first generation corn borer with – early planting and the tallest corn within an area, usually around the first week of June.
Concerns – high yield potential corn (“race horse”) is often targeted by first generation egg laying moths.
Considerations – except for northwestern Indiana, and to a somewhat lesser degree west central and northeastern Indiana, populations going into overwintering were relatively low. A mild, moist spring may encourage corn borer diseases that could drastically reduce overwintering larval numbers. Rainy, stormy weather during the mating and egg-laying period is detrimental to moths.

Black Cutworm
Overwintering stage – doesn’t overwinter in the Midwest
Crop damage increases with – large moth flights into Indiana. Moths carried into the state on storm fronts from the southwestern United States and Mexico.
Concerns – winter annuals growing on agricultural lands are targeted egg laying sites for arriving female moths. Burn-down herbicides applied during or shortly after planting will force hatching black cutworm larvae to move from the dying weeds to emerging crops.
Considerations – a hard freeze after egg laying may reduce black cutworm survivorship. Timing and number of moths arriving into the state is quite variable from year to year. Clean fields less likely to have problems.

Alfalfa Weevil
Overwintering stage – adults under crop residue and eggs in stems
Expected overwintering success – highly variable, depends on freezing and thawing cycles.
Crop damage increases with – unseasonably warm spring temperatures
Concerns – mild winter and spring temperatures will accelerate spring egg hatch and adult egg laying. This will increase the number of weevil larvae feeding over a longer period of time. However, extreme temperatures can kill exposed adults and newly hatched larvae and can decrease concerns.
Considerations – a hard freeze after early spring growth may reduce early hatching larval populations.

Below Ground Insects:

Western Corn Rootworm
Overwintering stage – eggs in the soil (from just below the soil surface up to a foot or more deep)
Expected overwintering success – excellent
Crop damage increases with – where rootworm beetles laid numerous eggs in either last year’s corn, soybean, or alfalfa crop and the crop will be in corn in 2002.
Concerns – large numbers of western corn rootworm beetles were observed in soybean fields last summer, especially in northwestern and north central counties of Indiana (see map of “Perceived Corn Rootworm Risk Area, 2002”)
Considerations – soil insecticides applied during early corn planting may have reduced efficacy by the time the rootworm eggs hatch in late May to early June.

White Grubs
Overwintering stage – larvae/grubs in the soil
Expected overwintering success – excellent
Crop damage increases with – early planting. Delayed crop emergence and growth will increase the opportunity for grubs to come into contact with and feed-on seedling roots.
Concerns – Japanese beetle is the predominant grub species in cultivated cropland in Indiana. Areas that experienced high numbers of Japanese beetles last year potentially have a higher risk of grub damage this spring.
Considerations – High organic matter soils may sustain large grub populations without significant crop damage since grubs can feed on dead and/or decaying plant matter.

Perceived Corn Rootworm Risk Area, 2002

back to top

divider

Rootworm Insecticide Classifications and Consistency of Performance - (John Obermeyer, Rich Edwards, and Larry Bledsoe)

  • Below are registered rootworm soil insecticides by chemical class.
  • Follow label uses and restrictions.
  • Many factors should be considered before selecting a product

Click for Table.
Factors to Consider When Choosing a Corn Rootworm Soil Insecticide.

back to top

divider

Plant Diseases

Virus Diseases of Wheat- (Gregory Shaner)

  • Wheat fields may show a yellow mosaic as spring regrowth starts

As wheat begins to grow, we may see widespread yellowing that looks like nutrient deficiency. It is possible that these symptoms will be the result of infection by either to of two soilborne viruses of wheat are widespread in Indiana soils, rather than to a deficiency of nitrogen. These viruses are Wheat spindle streak mosaic virus (WSSMV) and Soilborne wheat mosaic virus (SBWMV). Both viruses persist in a common soilborne fungus, Polymyxa graminis. Spores of this fungus infect wheat roots and in so doing transmit the virus to the wheat plant. Cool, wet soils favor infection. Much of the state experienced those conditions last fall, so there is a good chance that these diseases will appear this spring. Weather conditions in the spring are also critical for symptom expression. These diseases are often most conspicuous when a period of unusually warm weather early in the spring is followed by a return to cooler weather. At that time, symptoms can suddenly appear in many wheat fields.

The symptom to look for is a pale green to yellow mosaic on young leaves. SBWMV, as its name implies, causes a mosaic – narrow, pale green to yellow, wavy-margined streaks on the leaf blade. Symptoms of WSSMV infection are similar, but the streaks tend to taper at both ends, hence the name “spindle.”  From a distance, fields or parts of fields have a pale green or yellow appearance, as though they are deficient in nitrogen.

In practice, it is very difficult to distinguish these two diseases based on symptoms. Both viruses may be found in the same field, and both viruses may infect the same plant. Wheat spindle streak is reported to be more uniformly distributed throughout fields than is soilborne wheat mosaic virus.

Most varieties of soft red winter wheat grown in Indiana have some degree of resistance to these viruses. They may show some yellowing during periods of fluctuating temperatures during the spring, but once the cold weather is past, these varieties tend to outgrow the symptoms on lower leaves and there is probably little damage. A few varieties are more susceptible. The intensity of yellowing is greater, and is accompanied by stunting, reduced tillering, and death of some plants in the field. These varieties will suffer economic damage from these diseases. There is no remedial action that can be taken at this stage. If a variety develops severe symptoms, don’t plant it again next year. There are plenty of varieties with good resistance.

back to top

divider

Risk of Yellow Dwarf in Wheat – (Gregory Shaner)

  • Warm fall means that yellow dwarf may be a problem

Yellow dwarf is caused by either of two closely related viruses: Barley Yellow Dwarf Virus (BYDV) and Cereal Yellow Dwarf Virus (CYDV). Until recently, these two viruses were considered to be one species (BYDV), consisting of different serotypes. Two of the serotypes have now been transferred to a “new” virus, CYDV. These viruses can only be transmitted to wheat by certain species of aphids. If an aphid feeds on an infected plant, it acquires the virus, and then can transmit it to another plant when it feeds there.

Infection can occur in the fall or in the spring. Fall infections are more damaging, although they may not result in conspicuous leaf discoloration symptoms. However, plants infected in the fall will be stunted, won’t tiller well, and may be more subject to heaving and winterkilling than uninfected plants. Leaves tend to be upright and less flexible than healthy leaves. On cultivars that do show yellowing leaves, the symptoms may look like a nutrient deficiency.

BYDV and CYDV survive in living host plants (cereals or various grasses). Aphids that feed on infected grasses or volunteer cereals in the fall and then move into the newly emerging wheat crop can transmit the viruses. The extent of infection by these viruses depends on aphid activity and population sizes.. Once infection is established in a field, more plants can become infected as aphids move from plant to plant. I saw symptoms that looked like yellow dwarf last November in some early-planted wheat. One of the reasons for observing the fly-free date for wheat sowing is to reduce the likelihood of infection by BYDV or CYDV. The cooler temperatures that normally occur after the fly-free date mean than aphids are less active. However, the long, warm fall of 2001 provided opportunity for aphids to remain active longer than normal and move into wheat that was sown even after the fly-free date. So, this spring, we may see yellow dwarf on wheat sown over a wide range of dates.

There are no remedial steps that can be taken at this stage against yellow dwarf. Cultivars differ in susceptibility. Most cultivars have some resistance. If yellow dwarf is suspected, the only reliable means of diagnosis is a serological test that detects the viruses in plant sap. Suspect samples can be sent to the Purdue Plant Diagnostic Lab or diagnostic labs in other states for confirmation of yellow dwarf.

back to top

divider

Growth Stages of Wheat– (Gregory Shaner)

  • Assessing wheat growth stage is important for making management decisions

For effective management of wheat, it is important to recognize the stages of growth as the crop develops. Heading date is a commonly-recognized indicator of relative maturity, but the ability to recognize other growth stages is important for judging the progress of the crop and making management decisions, such as application of fertilizer, herbicides, or fungicides, and for predicting the consequences of disease or injury to the crop.

Two scales are commonly used to record the growth stage of wheat: the Feekes scale and the Decimal (Zadoks) scale. The Feekes scale is older and has been used widely since the early 1950s. The Decimal scale is designed to make finer distinctions among stages of crop growth, and is probably used more in Europe than in the US, although pesticide labels in the US are starting to use both scales.

In the Feekes scale, growth stages are divided into 11 major categories. Head emergence, flowering, and grain filling (Feekes Growth Stages 10 and 11) are further subdivided. The Feekes Growth Stage scale is presented below, with a description of crop development stage that corresponds to each number. Corresponding Decimal Growth Stages are given in brackets.

Feekes Growth Stages for Wheat
FGS Description
  Tillering
1

One shoot [DGS 10-1x;x=no. leaves on main stem]

2

Beginning of tillering [DGS 21]

3

Tillers formed [DGS 2x; x=number of tillers]

4

Beginning of erection of the pseudo-stem, leaf sheaths beginning to lengthen [DGS 30]

5

Pseudo-stem (formed by leaf sheaths) strongly erected [DGS 30]


Stem extension

6

First node visible at base of shoot (1 cm between crown and next node above the crown) [DGS 31]

7

Second node of stem formed (distance between first and second above ground nodes), next-to-last leaf just visible [DGS 32]

8

Flag leaf visible, but still rolled up, head beginning to swell [DGS 37]

9

Ligule of flag leaf just visible [DGS 39]

10

Sheath of flag leaf completely grown out, head swollen in boot but not yet visible [DGS 41-49]

  Heading
10.1

Heads just visible (head escaping through slit in sheath) [DGS 50]

10.2

Heads one-fourth emerged [DGS 53]

10.3

Heads one-half emerged [DGS 55]

10.4

Heads three-quarters emerged [DGS 57]

10.5

Heads fully emerged [DGS 59]

  Flowering
10.5.1

Beginning of flowering [DGS 61]

10.5.2

Flowering complete to top of head [DGS 65]

10.5.3

Flowering over at base of head [DGS 67]

10.5.4

Flowering over, kernel watery ripe [DGDS 69-71]

  Ripening
11.1

Kernels milky ripe [DGS 73-77]

11.2

Kernels mealy ripe, contents of kernels soft but dry (soft dough) [DGS 83-85]

11.3

Kernels hard, difficult to divide (hard dough) [DGS 87-89]

11.4

Ripe, straw dead, ready for harvest [DGS 92]

There are 9 major divisions (1-9) in the Decimal scale, with 10 possible subdivisions (0-9) for each major division. For example, the tillering stage is denoted by 2 in the Decimal scale, and the second digit indicates the number of tillers per plant. The Feekes scale simply notes whether tillers have begun forming (FGS 2), or whether tillering is essentially completed (FGS 3), without requiring the counting of tillers, although tiller number per plant could be appended after the “2”, e.g. FGS 2.4.

In winter wheat, the period from beginning of tillering to completion of tillering may extend for a considerable time, from autumn into the following spring. Likewise, the precise limits of FGS 4 and 5 are not clear. Depending on planting date, variety, and weather in the fall, plants may reach the pseudostem erection stage in the fall, or only in the spring as the crop comes out of dormancy.

Jointing (FGS 6)  can be clearly determined. The original Feekes scale simply defined stage 6 as when the first node was visible at the base of the shoot. The Decimal scale provides a more precise definition for this stage, namely when the distance between the crown and the first stem node is at least 1 cm (0.4 in.), and I have included this in the growth stage table. When the second aboveground node is at least 2 cm (0.8 in.) above the first node, the plant has reached FGS 7.

The stage when the flag leaf first appears  (FGS 8) is important for application of a foliar fungicide. Soft red winter wheats in Indiana typically have 4 aboveground nodes when fully developed. The sheath of the uppermost leaf (flag leaf, F) arises from the top node. The leaf below the flag leaf (F-1) arises from the next node down, etc. Thus, leaf F-3 arises from the lowest aboveground node. The lowest aboveground node is near the ground when it first appears, but will move upward somewhat as the stem elongates. At FGS 8, there are usually two clearly differentiated nodes on the stem. The lowest will average about 7 cm (2-3/4 in.) above the soil line. The second node (from which leaf F-2 arises) will be about 15 cm (6 in.) above ground. The third node will usually be visible, but because it is only about 1 cm (0.4 in.) above node 2, it is not counted. As the wheat continues to grow, the distance between nodes increases, and the fourth node becomes evident.
Once the flag leaf blade has fully emerged, the flag leaf sheath extends. By this time, the head enclosed in this leaf sheath is swelling, and the plant enters the boot stage (FGS 10). The heads of all plants in a field will not emerge from the boot synchronously. Stages 10.1 through 10.5 are best assigned according to when heads on about half the plants have reached the indicated degree of emergence.

Flowering in wheat begins roughly in the middle of the head and progresses both upward and downward. Flowering at a given position in the head can be judged by the presence of extruded anthers.

Ripening is judged by removing developing kernels from the center of several heads and determining whether the contents are watery, milky, or at the soft or hard dough stages.

By the time wheat has reached FGS 8, leaves F-5 and below are usually withered, from infection by Septoria, Stagonospora, and other fungi. The next leaf up (F-4) usually withers about the time heads have fully emerged. In the absence of Septoria and Stagonospora blotches, powdery mildew, or other foliar diseases, leaves F-3 through F should remain green until the wheat approaches maturity. Often, however, disease destroys leaves at each layer of the canopy prematurely. Fungicide control is aimed at maintaining these leaves, particularly F and F-1, in a healthy condition.

If a grower is planning to apply a fungicide at flag leaf emergence (FGS 8), it would be helpful to know when that stage will be reached, relative to some earlier, easily determined growth stage. The jointing (FGS 6) and 2-node (FGS 7) stages can be determined with precision if a wheat field is monitored frequently. The time required for a plant to progress from either of these stages to FGS 8 is not constant. It depends on weather conditions, particularly temperature. Over many years, we have monitored wheat crop development in various field trials, and the following observations can give some guidelines for the average and ranges of times required for plants to progress from one growth stage to another. We found that it takes about a week to progress from FGS 6 to FGS 7, and another 8 days to go from FGS 7 to FGS 8 (with a range of 5 to 10 days). It can take from 3 to 8 days for the flag leaf blade to fully expand (going from FGS 8 to FGS 9). It can take from 9 to 16 days to progress from FGS 9 to full head emergence (FGS 10.5) or the beginning of flowering (FGS 10.5.1).

back to top

divider

Agronomy Tips

Wheat Update– (Charles Mansfield and Ellsworth Christmas, Agronomy Dept.)

Wheat in southern Indiana is already out of dormancy and beginning to grow. There is some concern about susceptibility to cold damage and survivability of wheat should cold weather occur. Wheat that is completely dormant can withstand temperatures down to approximately -10 oF. Once out of dormancy some winter hardiness is lost and temperatures in the low teens can cause injury. See Table 1 for specific growth stages and critical temperatures that could cause injury. Plant response is based on exposure of wheat to these temperatures for at least two hours.

Table 1. Temperatures that cause freeze injury to wheat at spring growth stages, and symptoms and yield effect of spring freeze injury.
Growth Stage
Approx. Injurious Temperature (2 hours)
Primary Symptoms
Yield Effect
Tillering 12°F (-11°C) Leaf chlorosis; burning of leaf tips; silage odor; blue cast to field Slight to Moderate
Jointing

24°F (-4°C)

Death of growing point; leaf yellowing or burning; lesions, splitting, or bending of lower stems; odor Moderate to Severe
Boot

28°F (-2°C)

Floret sterility; head trapped in boot; damage to lower stem; leaf discoloration; odor Moderate to Severe
Heading

30°F (-1°C)

Floret sterility; white awns or white heads; damage to lower stem; leaf discoloration Severe
Flowering

30°F (-1°C)

Floret sterility; white awns or white heads; damage to lower stems; leaf discoloration Severe
Milk

28°F (-2°C)

White awns or white heads; damage to lower stems; leaf discoloration; shrunken, roughened, or discolored kernels Moderate to Severe
Dough

28°F (-2°C)

Shriveled, discolored kernels; poor germination Slight to Moderate


Another source of concern has to do with deciding whether or not to keep less than optimal stands. Some fields have rather thin stands that likely occurred due to excessive rainfall after planting. This led to poor seedling emergence and less than optimal stand. Ideally one would like to see 25 to 30+ plants per square foot. Lesser plant populations can produce good yields if adequate tillers develop and produce heads. However, the largest heads are usually found on the main stems so thicker stands usually produce the highest yield. Table 2 illustrates potential yield as a function of plant population and tillers per plant. To use the table one must first determine the number of plants per square foot. For example, if wheat is drilled in 7” spacing then counting the plants in 19º” of row length will give plants per square foot. Once several counts have been made in representative areas, heads per plant is assigned; and the number of heads per square foot and yield potential can be read from the table.

From the table one can see that if there is an average of less than 15 plants per square foot, that field is not a likely candidate for good yield. Weed pressure would also be a real concern in thin stands. On the other hand, if there are 25+ plants per square foot, the outlook is much better for high yield potential. Between 15 and 25 plants per square foot the potential outcome becomes less clear, and other factors like weed species, weed pressure, alternate use of the land, etc.. play more important roles in the decision making process.

Table 2. Estimating wheat grain yield
Plants per sq. ft
Heads per plant
Heads per sq. ft.
Yield potential bu. per acre
10
10
10
10
10
1.0
1.5
2.0
2.5
3.0
10
15
20
25
30
15
22.5
30
37.5
45
15
15
15
15
15
1.0
1.5
2.0
2.5
3.0
15
22.5
30
37.5
45
22.5
33.5
45
56
67.5
20
20
20
20
20
1.0
1.5
2.0
2.5
3.0
20
30
40
50
60
30
45
60
75
90
25
25
25
25
25
1.0
1.5
2.0
2.5
3.0
25
37.5
50
62.5
75
37.5
56
75
93.5
112.5
30
30
30
30
1.0
1.5
2.0
2.5
30
45
60
75
45
67.5
90
112.5
35
35
35
1.0
1.5
2.0
35
52.5
70
52.5
78.5
105

1) Estimate plants per square foot.

8" drill row spacing- average plant count per 18" row
7" drill row spacing- average plant count per 19" row
7" drill row spacing- average plant count per 20" row
6" drill row spacing- average plant count per 24" row

2) then estimate heads per plant to get heads per square foot
3) Multiply the result by 1.5 to calculate potential yield.

Bits & Pieces
PURDUE EXTENSION SPECIALISTS
Telephone, E-mail Addresses and Specialty
Entomology
Yaninek, Steve (765) 494-4554 Head, Dept. of Entomology
Blackwell, Ron (765) 494-4579 Pest Survey Specialist
Bledsoe , Larry (765) 494-8324 Field Crop Insects
Edwards, C. Richard (765) 494-4562 Field Crop Insects & IPM
Hunt, Greg (765) 494-4605 Bee Specialist
Lam, Frankie (812) 886-0198 Insect Pest Mgmt. Specialist, SWPAC
Loven, Judy (765) 494-8721 USDA, APHIS, Animal Damage
Mason, Linda J. (765) 494-4586 Food Pest Mgmt. & Stored Grain
Obermeyer, John L. (765) 494-4563 Field Crop Insects & IPM Specialist
Tammy Luck (765) 494-8761 Administrative Assistant
FAX: (765) 494-2152

Dept. Web Site: http://www.entm.purdue.edu/entomology/ext/index.htm

Agronomy
Beyrouty, Craig (765) 494-4774 beyrouty@purdue.edu Head, Dept. of Agronomy
Brouder, Sylvie (765) 496-1489 sbrouder@purdue.edu Plant Nutrition, Soil Fertility, Water Quality
Christmas, Ellsworth (765) 494-6373 echristmas@purdue.edu Soybeans, Small Grains, Specialty Crops
Eck, Kenny (812) 482-1171 keck@purdue.edu Conservation Program Specialist
Evans, Mark (765) 653-2996 mevans@purdue.edu Conservation Program Specialist
Gauck, Brian (317) 392-1394 bgauck@purdue.edu Conservation Program Specialist
Joern, Brad (765) 494-9767 bjoern@purdue.edu Soil Fertility, Waste Mgmt.
Johannsen, Chris (765) 494-6248 johan@purdue.edu Remote Sensing, Precision Agriculture
Johnson, Keith D. (765) 494-4800 johnsonk@purdue.edu Forages
Krejci, James (765) 494-4795 jmkrejci@purdue.edu Coordinator, Soil and Water Quality Program
Lake, James (260) 426-4637 jlake@purdue.edu Conservation Program Specialist
Lee, Brad (765) 496-6884 bdlee@purdue.edu Soils and Land Use, Septic Systems.
Mansfield, Charles (812) 888-4311 cmansfie@purdue.edu Small Grains, Soybean, Corn
Matzat, Eugene (219) 324-0838 ematzat@purdue.edu Conservation Program Specialist
Nielsen, Robert L. (765) 494-4802 rnielsen@purdue.edu Corn, Sorghum, Precision Agriculture
Steinhardt, Gary (765) 494-8063 gsteinha@purdue.edu Soil Mgmt., Tillage, Land Use
Vyn , Tony (765) 496-3757 tvyn@purdue.edu Cropping Systems & Tillage
West, Terry (765) 494-4799 twest@purdue.edu Soil Mgmt. & Tillage
Willoughby, Greg (765) 494-7731 gregw@purdue.edu Director, Crop Diagnostic Training & Res. Ctr.
Carol Summers

(765) 494-4783

csummers@purdue.edu Extension Secretary
FAX: (765) 496-2926
Botany and Plant Pathology
Martyn, Ray (765) 494-4614 rmartyn@purdue.edu Head, Dept. Botany & Plant Pathology
Bauman, Tom T. (765) 494-4625 bauman@btny.purdue.edu Weed Science
Nice, Glenn (765) 496-2121 nice@btny.purdue.edu Weed Science
Rane, Karen (765) 494-5821 rane@btny.purdue.edu Plant & Pest Diagnostic Lab
Ruhl, Gail (765) 494-4641 ruhl@btny.purdue.edu Plant & Pest Diagnostic Lab
Sellers, Peggy (765) 494-8081 sellers@btny.purdue.edu Plant & Pest Diagnostic Lab
Shaner, Greg (765) 494-4651 shaner@btny.purdue.edu Diseases of Field Crops
Whitford, Fred (765) 494-4566 whitford@btny.purdue.edu Purdue Pesticide Programs
Woloshuk, Charles (765) 494-3450 woloshuk@btny.purdue.edu Mycotoxins in Corn
Ellen Kresovsky (765) 494-9871
kresovsky@btny.purdue.edu Extension Secretary
FAX: (765)494-0363
Agricultural & Biological Engineering
Bralts, Vincent (765) 494-1162 bralts@ecn.purdue.edu Head, Dept. of Ag. & Bio. Engineering
Ess, Daniel R. (765) 496-3977 ess@ecn.purdue.edu Precision Ag., Ag System Mgmt.
Frankenberger, Jane (765) 494-1194 frankenb@ecn.purdue.edu GIS and Water Quality
Heber, Al (765) 494-1214 heber@ecn.purdue.edu Air Quality
Jones, Don (765) 494-1178 jonesd@ecn.purdue.edu Extension Coord., Bldg. Environ. Control
Maier, Dirk (765) 494-1175 maier@ecn.purdue.edu Post Harvest Engineering
Mack, Strickland R. (765) 494-1222 strick@ecn.purdue.edu Precision Farming Appl.
Carol Sikler (765)494-1174 sikler@ecn.purdue.du Extension Secretary
FAX: (765) 496-1356

Bug Scout

Bug Scout

back to top

divider