What is Landscape IPM and How to Use it in Your Business
Clifford S. Sadof
Department of Entomology
 Landscape Integrated Pest Management (IPM) is a systematic approach to managing
pest problems that improves the quality of plant care you deliver to your
clients while minimizing pesticide use. This process helps you locate potential
pest problems early in the season before extensive damage occurs and when
better control can be achieved. It also enables you to identify problems
that are most important to your client base so you can focus your efforts on
critical issues. Full-blown IPM programs can be expensive because they require
that you visit and inspect landscape properties at least twice a month during
the growing season. As such this service is usually affordable to only
high-end clients, or institutions with a resident staff that maintains the
property. Many of the benefits of an IPM program can be obtained through
scaled-down programs that meet the budget of less affluent customers. In
this chapter I will discuss the key components of Landscape IPM and how you can
use both full-blown and scaled down programs to reap the benefits of an IPM
philosophy.
Landscape Integrated Pest Management (IPM) is a systematic approach to managing
pest problems that improves the quality of plant care you deliver to your
clients while minimizing pesticide use. This process helps you locate potential
pest problems early in the season before extensive damage occurs and when
better control can be achieved. It also enables you to identify problems
that are most important to your client base so you can focus your efforts on
critical issues. Full-blown IPM programs can be expensive because they require
that you visit and inspect landscape properties at least twice a month during
the growing season. As such this service is usually affordable to only
high-end clients, or institutions with a resident staff that maintains the
property. Many of the benefits of an IPM program can be obtained through
scaled-down programs that meet the budget of less affluent customers. In
this chapter I will discuss the key components of Landscape IPM and how you can
use both full-blown and scaled down programs to reap the benefits of an IPM
philosophy.
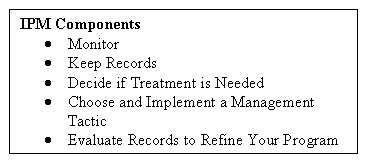
Monitor
---------Visually inspect all plants in the landscape once in the dormant season and then every two weeks from spring flush through leaf drop. Regular inspection of plants helps you find and treat pests before they cause unacceptable damage. More importantly because you know you will be returning to the site to monitor again, it allows you the opportunity to put off pesticide sprays until they are absolutely necessary.
Improve efficiency by focusing your monitoring on plants that are likely to have pest problems. This can be determined by knowing when pests are active and which plants they are likely to feed on. Tables of pest activity based on degree days and plant development in the landscape have been prepared to help guide your scouting emphasis during your first season. In later years you can use your summarized monitoring records to help predict where and when pests are likely to be active.
Use readily available sampling tools to determine stage and extent of pest populations.
� Hand magnifying lens
Carry a 10-15x had lens to help you diagnose pest problems and determine the life stages that are present. High quality glass 10X doublet lenses can be purchased for less than $10.
� Sex pheromone traps
These traps are baited with a scent that attracts only the males of a
species. They are critical for timing the controls of several
pests. For example, insecticides for most clearwing borers (lilac, ash,
dogwood, peachtree, etc.) should be applied 10 days
after the first male is caught in a trap. Sex pheromone traps are also
available for
�Beating sticks, clip boards and white paper
For many plants you can quickly determine what is feeding on their limbs when you tap the branches with a stick over a white sheet of paper. This is especially useful for small pests such as spider mites, scale crawlers, thrips, and some leaf hoppers. After pests are identified with a hand-magnifying lens, the population can be estimated by counting the number of moving insects on a sheet.
Keep Records
Make a map of the landscape. Maps that
locate plants can become a reliable guide to where problems have been reported.
This can be accomplished with simple paper and pencil or with global
positioning system (
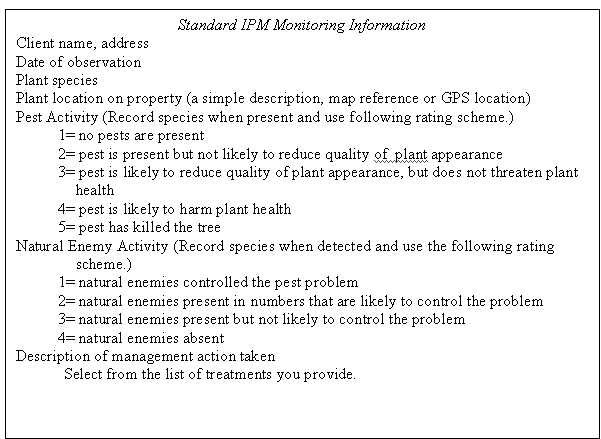 Make a standard
IPM observation form. Record your information in a standardized
format either on paper or via hand-held data collection devices associated with
your data collection software (see insert). This will help you generate useful
summaries of your scouting information.
Make a standard
IPM observation form. Record your information in a standardized
format either on paper or via hand-held data collection devices associated with
your data collection software (see insert). This will help you generate useful
summaries of your scouting information.
Decide If Treatment Is Needed
The need for treatment is determined by both the biology of the pest and the preferences of your client. With respect to biology, pests associated with medium and high risks of plant mortality are most likely to need treatment. As far as your clients are concerned, some have low tolerance for injury whereas others have high tolerance. Other clients may simply be most concerned about the appearance of a few favorite plants. It is important for you to get a feel for their sensitivity during your preliminary client consultation. As a starting point, however, research has shown that 0% relative defoliation, distortion or discoloration is enough to worry most clients. Treat plants only when pests are in a vulnerable stage and they threaten plant appearance or health (see rating scheme from insert).
Most pests have definite times of the year when they can cause problems. Two-spotted spider mites are a good example because they thrive in hot and dry weather. High numbers of spider mites on deciduous trees in July pose a greater threat to your plants than large numbers in September when leaf drop is imminent. Use your scouting records to identify trends of pest activity in your area.
Choose a Management Tactic
Once you have determined the need for taking action select tactics that are appropriate to the scale of your problem. This will help preserve natural enemies that are already present in the landscape feeding on pests (Chapter 5). Consider cultural or mechanical controls such as replacing problem-prone plants with species that are resistant to common pests (Chapter 6). When pesticides are needed, treat the smallest possible area. When possible, choose biorational pesticides (Chapter 7). When you inspect your plants every 2 weeks, you usually do not need to use long-lasting materials because you have many opportunities to intervene before plants are damaged.
Evaluate Records to Refine Your Program
Use a spread sheet or database program to sort your pest management records to identify trends over time to help you target your pest management efforts against the most important problems.
Key Pests. These are the pests that are most common in the landscapes you manage. Most IPM programs indicate that most problems are caused by fewer than 10 pests. These pests are usually the ones your clients will use to test your ability to provide effective pest control. Identifying key pests can help you target future education and management efforts to address the problems that are most important to your business.
- Sort your records by pest and count the number of times each each pest was the cause for applying a treatment .
Key Plants. These are the plant species most likely to have problems. As with key pests, these species your clients will judge your performance based on how well you take care of these plants. In addition to targeting management and education efforts, this information can be used to steer clients away from planting highly susceptible plants.
- Sort your records by plant species and count the number of times plants needed treatment.
Key Clients or Properties. These are the clients or properties that require the most extensive pest management activities. This list will help you identify clients or properties with the greatest pest management needs. Similarly, you can use this kind information to determine the types of clients that are most profitable for your business.
- Sort your records by clients, or properties and count the number of treatments they received.
Key Management Tactics. These are the tactics that you most commonly use. This will help you project future needs for materials, and specialized training in pest management tactics.
- Sort your records by the tactics you use and count the number of times each tactic was implemented.
Determine Seasonality of Key Pests, Key Plants, Key Clients, and Key Management Activities to predict next year's sequence of pest problems. Analysis of your most common management activities could help you spread out your work more evenly over the course of a year.
- Sort your problem records by one of the 4 categories (eg. pest) and observation, or date of management activity.
- Count the number of times each of the 5 most frequent items in a category (eg. top 5 key pests) were seen in 2 week intervals throughout the season.
- Plot these counts over time for each of the top 5 items (e.g. key pests).
A Scaled-Down IPM Approach For Clients Who Cannot Afford Monitoring
Without a regular monitoring program you lose the advantages you gain from being able to modify your pest management strategy during regular visits to each landscape over the course of the season. As such, it can be more difficult to reduce pesticide use with the same degree of confidence you would have in an IPM program. Nevertheless, by including the following information in your client billing system you can summarize your records to reap many of the benefits achieved in an IPM program.
� Inspect plants and treat only those with pest problems.
� Develop a billing form that records the plant species, the pest species, the date and kind of treatment each client receives.
� Enter billing records into a database.
� Summarize these records as described for an IPM program at the end of the season.
Other ways of predicting
insect activities
Degree days
Because insects are poikilothermic their rate of development varies with temperature. Just like plants they develop earlier in the year during warm springs than cooler springs.� As such, the calendar date of the previous year�s emergence is often inadequate to predict insect activity. Two tools are commonly used to predict emergence Degree Days, and Phenological Indicators. Degree days measure the accumulated heat units above a critical threshold. Phenological Indicators use plants as biological clocks to estimate how warm it has been . Both are correlated with insect development.
A simple way to calculate Degree Days is the MAXMIN method.
Daily (Max T + Min T)/2�� - Threshold == Degree days at the threshold temperature.
Phenological Indicators
The following link to Phenological indicators and Degree Days of Ohio shows you the relationship between Degree Days and Phenological indicators.�
Review the chapter by Herms for a good reference on this topic.
http://www.entomology.umn.edu/cues/Web/049DegreeDays.pdf
Review Questions for this lecture (see slides and these notes):
- What 3 characteristics of insect contribute to their ability to invade a planting of plants?
- What are 3 characteristics of landscapes that affect the way insects can invade a planting of plants?
- What is integrated pest management?
- What are the 5 components of integrated pest management?
- How can scouting and record keeping be used to fine tune your pest management program?
- How can knowing key pests, key plants and problematic properties influence your ability to deliver a pest management service to your clients.
- Distinguish between how simple calendars, degree days and phonological indicators can be used to time pest management activity.