Pest & Crop
Newsletter
Purdue Cooperative Extension Service
Purdue Cooperative Extension Service
Issue 6, May 5, 2017 • USDA-NIFA Extension IPM Grant
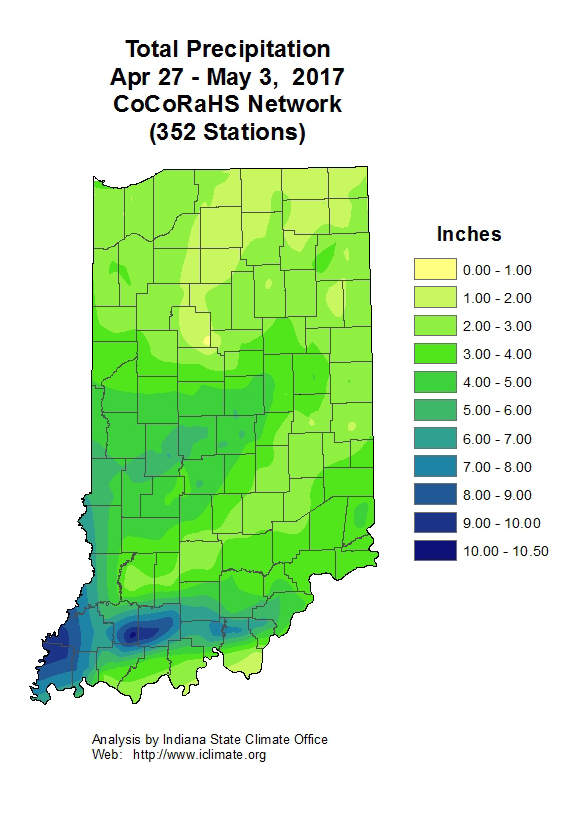
Like the armyworm story we’ve been following, black cutworm moth catches in pheromone traps throughout the state have been rather impressive over the last month (see “Black Cutworm Adult Pheromone Trap Report”), and this rainy spring has hindered herbicide applications to some weedy and/or cover crop fields. Also, consider that the moths continue to arrive, and that will be the case for weeks to come. That is why we continue to monitor until most corn is not only planted, but up to and including the 3-leaf stage to cover the vulnerable part of the growing season.
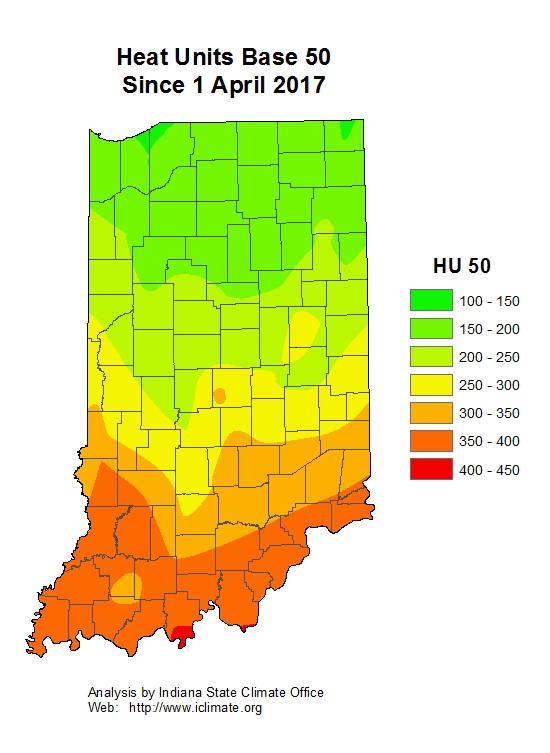
Hatched larvae (“worms”) grow and feed anytime it is above 50oF, likely on the plant they were laid on or nearby, e.g., winter annual weeds. Black cutworms are generalists and feed on a wide variety of hosts, although chickweed is a favorite. Corn is not a preferred food but larvae will switch their diet to corn as weeds are killed by herbicide application and the emerging crop is the only nutrition available. Before we can detect their presence in corn, they must develop to a size that allows them to feed on corn leaves. Refer to the following map (“Heat Units Base 50”), where we are tracking black cutworm development from the date of significant arrival (intensive capture of adults in pheromone traps), to when we expect first cutting/damage. Based on the growth development model, it takes approximately 300 heat units (50oF base) from egg hatch to early 4th instar; this is the life stage when black cutworm larvae begin to cut plants. As you can see, from April 1 (intensive captures) to May 3 (map created), ≥ 300 heat units (base 50) have accumulated in many southern counties of Indiana, so readers in that area with corn emerged will want to have a look for this pest and feeding. These maps will be updated and posted weekly in the Pest&Crop.
Happy Scouting!
| County/Cooperator | Wk 1 | Wk 2 | Wk 3 | Wk 4 | Wk 5 | Wk 6 | Wk 7 | Wk 8 | Wk 9 | Wk 10 | Wk 11 | Wk 12 |
|---|---|---|---|---|---|---|---|---|---|---|---|---|
| Dubois/SIPAC Ag Center | 0 | 0 | 0 | 101 | 193 | 16 | 0 | |||||
| Jennings/SEPAC Ag Center | 0 | 1 | 1 | 56 | 57 | 9 | 4 | |||||
| Knox/SWPAC Ag Center | 0 | 13 | 26 | 42 | 189 | 57 | 2 | |||||
| LaPorte/Pinney Ag Center | 0 | 0 | 3 | 352 | 936 | 382 | 154 | |||||
| Lawrence/Feldun Ag Center | 4 | 108 | 216 | 246 | 650 | 348 | 112 | |||||
| Randolph/Davis Ag Center | 0 | 29 | 41 | 528 | 1232 | 300 | 72 | |||||
| Tippecanoe/Meigs | 0 | 2 | 15 | 107 | 730 | 243 | 98 | |||||
| Whitley/NEPAC Ag Center | 0 | 34 | 90 | 537 | 1689 | 1349 | 855 |
Wk 1 = 3/16/17 - 3/22/17; Wk 2 = 3/23/17 - 3/29/17; Wk 3 - 3/30/17 - 4/5/17; Wk 4 - 4/7/18 - 4/12/17; Wk 5 - 4/13/17 - 4/19/17; Wk 6 - 4/ 20/17 - 4/26/17; Wk 7 = 4/27/17 - 5/3/17
| County | Cooperator | BCW Trapped | |||||
|---|---|---|---|---|---|---|---|
Week 1
|
Week 2 3/30/17-4/5/17 |
Week 3 4/5/17-4/12/17 | Week 4 - 4/13/17 - 4/19/17 | Week 5 - 4/20/17-4/26/17 | Week 6 - 4/27/17-5/3/17 | ||
| Adams | Kaminsky/New Era Ag | 13 | 35 | 61* | 48* | ||
| Adams | Roe/Mercer Landmark | 11 | 17* | 7 | 42 | 28* | 35* |
| Allen | Anderson/Syngenta Seed | 0 | |||||
| Allen | Gynn/Southwind Farms | 2 | 1 | 0 | 15 | 21* | 52* |
| Allen | Kneubuhler/G&K Concepts - Trap 1 | 0 | 19* | 36 | 60* | 41* | |
| Allen | Kneubuhler/G&K Concepts - Trap 2 | 9 | 2 | 0 | 10 | ||
| Bartholomew | Bush/Pioneer Hybrids | 1 | 13* | 13 | 17 | 28* | 36* |
| Clay | Bower/Ceres Solutions - Clay City | 0 | 0 | 7 | 4 | 2 | 4 |
| Clay | Bower/Ceres Solutions - Bowling Green | 0 | 0 | 0 | 1 | 1 | |
| Clay | Bower/Ceres Solutions - Brazil | 0 | 0 | 0 | 0 | 0 | |
| Clinton | Emanuel/Boone Co. CES | 8 | 9 | 6 | 10 | 5 | 8 |
| DeKalb | Hoffman/ATA Solutions | 0 | 0 | 0 | 1 | 0 | 3 |
| Dubois | Eck/Purdue CES | 14 | 28* | 41* | 4 | 4 | 40* |
| Elkhart | Kauffman/Crop Tech Inc. | 0 | 0 | 6 | 16 | 28* | 36* |
| Fayette | Schelle/Falmouth Farm Supply Inc. | 5 | 33* | 5 | 3 | 10 | |
| Fountain | Mroczkiewicz/Syngenta | 7 | 18* | 31* | 93* | 43* | 44* |
| Fulton | Jenkins/N. Central Coop - Talma | 0 | 5 | 10 | 13 | 6 | 39* |
| Fulton | Ranstead/NCC Coop - Rochester | 0 | 0 | 0 | 3 | 6 | 11 |
| Gibson | Schmitz/Gibson Co. CES | 0 | 0 | ||||
| Hamilton | Campbell/Beck's Hybrids | 14 | 13 | 18 | 55* | 30* | 45* |
| Hamilton | Truster/Reynolds Farm Equipment | 1 | 1 | 2 | 4 | ||
| Hendricks | Nicholson/Nicholson Consulting | 0 | 3 | 4 | 11 | 17* | |
| Jasper | Overstreet/Jasper Purdue CES | 2 | 5 | 0 | 5 | 10 | 12 |
| Jasper | Ritter/Brodbeck Seeds | 1 | 3 | 10 | 32 | 28* | |
| Jay | Boyer/Davis PAC | 3 | 14 | 19 | 19 | 43* | |
| Jay | Shrack/Ran-Del Agri Services | 1 | 3 | 5 | 9 | 8 | 9 |
| Jay | Temple/Jay County CES | ||||||
| Jennings | Bauerle/SEPAC | 0 | 0 | 0 | 0 | 0 | 0 |
| Knox | Bower/Ceres Solutions - Freelandville | 0 | 0 | 0 | 13* | 4 | 3 |
| Knox | Bower/Ceres Solutions - Vincennes | 0 | 0 | 0 | 2 | 2 | |
| Kosciusko | Klotz/Etna Green | 0 | 0 | 4 | 9 | 5 | 41* |
| Lake | Kleine/Kleine Farms | 4 | 16* | 60* | 83* | 90* | 62* |
| Lake | Moyer/Dekalb Hybrids - Shelby | 5 | 5 | 20* | 27 | 6 | 5 |
| Lake | Moyer/Dekalb Hybrids - Schneider | 2 | 5 | 5 | 12 | 20 | 12 |
| LaPorte | Rocke/Agri-Mgmt Solutions | 4 | 41 | 9 | 38* | ||
| Madison | Truster/Reynolds Farm Equipment | 0 | 0 | 0 | 0 | ||
| Marshall | Harrell/Harrell Ag Services | 0 | 0 | 0 | 0 | 0 | |
| Marshall | Klotz/SR 10 & SR 331 | 0 | 0 | 0 | 8 | 9 | 20* |
| Marshall | Miller/North Central Coop | 0 | 0 | 0 | 2 | 1 | 9 |
| Miami | Early/Pioneer Hybrids | 0 | 0 | 0 | 3 | 2 | 3 |
| Newton | Moyer/Dekalb Hybrids - Lake Village | 2 | 6 | 2 | 8 | 8 | 21 |
| Porter | Leuck/PPAC | 5 | 3 | 18 | 25 | 8 | 22 |
| Pulaski | Capouch/M&R Ag Services | 0 | 0 | 1 | 10 | 10 | |
| Pulaski | Leman/North Central Coop | 0 | 10 | 21 | 30* | 23 | |
| Putnam | Nicholson/Nicholson Consulting | 2 | 6 | 2 | 8 | 2 | |
| Randolph | Boyer/DPAC | 1 | 0 | 1 | 2 | 4 | |
| Rush | Schelle/Falmouth Farm Supply Inc. | 6 | 10 | 1 | 3 | 17* |
|
| Shelby | Fisher/Shelby County Co-op | 2 | 3 | 5 | 5 | 0 | 10 |
| Shelby | Simpson/Simpson Farms | 7 | 49* | 41* | 67* | 37 | 41* |
| Starke | Capouch/M&R Ag Services | 0 | 0 | 6 | 28 | 21* | |
| Starke | Wickert/Wickert Consulting - California Twnshp | 1 | 1 | 3 | 4 | 11 | 37* |
| Starke | Wickert/Wickert Consulting - Railroad Twnshp | 0 | 0 | 0 | 0 | 9 | 17* |
| St. Joseph | Barry/Helena | 1 | 3 | 15* | 20* | ||
| Sullivan | Bower/Ceres Solutions - Farmersburg | 0 | 1 | 2 | 14 | 18* | 6 |
| Sullivan | Bower/Ceres Solutions - Sullivan | 6 | 21* | 14* | 16* | 6 | 7 |
| Tippecanoe | Bower/Ceres Solutions | 0 | 0 | 0 | 7 | 3 | 12* |
| Tippecanoe | Westerfield/Monsanto Research Farm | 0 | 0 | 13 | 11 | 16 | |
| Tippecanoe | Nagel/Ceres Solutions | 30 | 47* | 44* | 89 | 14 | 8 |
| Tippecanoe | Obermeyer/Purdue Entomology | 2 | 5 | 11 | 5 | 20* | 9 |
| Tipton | Campbell/Beck's Hybrids | 10 | 17 | 11 | 73* | 33* | 119* |
| Vermillion | Bower/Ceres Solutions | 0 | 0 | 0 | 0 | ||
| Wabash | Enyeart/North Central Coop | 0 | |||||
| Whitley | Walker, Richards/NEPAC1 - Main | 10 | 28* | 37* | 81* | 87* | 149* |
| Whitley | Walker, Richards/NEPAC2 - Kyler | 3 | 8 | 17* | 36* | 33* | 79* |
* = Intensive Capture...this occurs when 9 or more moths are caught over a 2-night period
Conventional wisdom says that the prime planting window to maximize corn yields in much of Indiana opens about April 20 and closes about May 10. This “window” typically opens about one week later across the northern tier of Indiana counties (later warmup) and about one week earlier across the southern tier of Indiana counties (earlier warmup).
The 2017 planting season for corn in Indiana is off to a curious start. Good planting progress in late April (45% planted as of 30 Apr) was brought to a screeching halt at the end of the month by widespread rainfall over the course of a week or so. As I update this article on 5 May, some forecasts are suggesting that field activities will continue to be limited for almost another 2 weeks (https://www.morningfarmreport.com). Clearly, the remainder of the state's corn crop will be planted later than normal and later than most desire because of "the certainty of lower yields with later planting".
But, hold on... How certain are the consequences of late planting of corn? How important a predictor of statewide corn yield is planting date anyway? Does late planting in and of itself guarantee lower than normal yields? Good questions, but the effect of planting date on statewide average corn yield is simply not clearcut. If one reviews USDA-NASS crop progress reports for the past 20 years (USDA-NASS, 2017b), there is NOT a strong relationship between planting date and absolute yield on a statewide basis for Indiana. Specifically, percent departures from annual trend yields are not strongly related to corn planting progress. Figures 1 and 2 illustrate this relationship for two measures of statewide planting progress; percent acres planted by April 30 or by May 15. Even though one can statistically define mathematical relationships between departures from statewide trend yield and statewide planting progress by April 30 or May 15, the relationships only account for 9 to 16% of the variability in trend yield departures from year to year. In other words, a number of yield influencing factors (YIFs) in addition to planting date also affect the ultimate absolute yield for a given year.

Conundrum.
Why is it that every corn agronomist worth their salt preaches about the importance of timely planting and yet the statewide statistical data suggest that planting date accounts for less than 20% of the variability in statewide yields from year to year? Let's look more closely at this apparent conundrum.
It is true that relative grain yield potential of corn declines with delayed planting after about May 1 (Myers & Wiebold, 2013, Nafziger, 2008; Nafziger, 2011). Estimated yield loss per day with delayed planting varies from about 0.3% per day early in May to about 1% per day by the end of May. Yield potential goes down with delayed planting because of a number of factors, including a shorter growing season, greater insect & disease pressure, and higher risk of hot, dry conditions during pollination.
However, the good news is that planting date is only one of many YIFs for corn. What is important to understand is that yield loss due to delayed planting is relative to the maximum possible yield in a given year.
In other words, if all the other YIFs work together to determine that the maximum possible yield this year for the optimum planting date is 220 bu/ac, then the consequence of a 10-day planting delay beyond April 30 (at 0.3% decrease per day) would be a yield potential of about 213 bu/ac (i.e., 220 bushel potential minus [10 days x 0.3%] due to delayed planting). However, if all the other YIFs work together to determine that the maximum possible yield this year for the optimum planting date is only 150 bu/ac, then the consequence of a 10-day planting delay beyond May 1 (at 0.3% decrease per day) would be a yield potential of about 146 bu/ac (i.e., 150 bu/ac potential minus [10 days x 0.3%] due to delayed planting). Make sense?
Consequently, it is possible for early-planted corn in one year to yield more than, less than, or equal to later-planted corn in another year depending on the exact combination of YIFs for each year. Figure 3 illustrates this often confusing concept. In that graph, a delayed planting of corn in an otherwise high yielding year (B) may still be higher yielding than a crop planted on the optimum planting date in an otherwise lower yielding year (C). Farmers know this to be true because some have had June-planted crops in recent years that ultimately yielded better than any crop they have ever had.............. because the remainder of the growing season following the delayed planting was exceptional.
For example, the crop years 2012 and 2009 represent early and late planting date years respectively in Indiana. About 94% of the state's corn crop was planted by May 15 in 2012, but only 20% of the crop was planted by May 15 of 2009 (Fig. 2). Yet, the earlier planted 2012 crop yielded 38.2% BELOW trend yield for that year and the later planted 2009 crop yielded 10.3% ABOVE trend yield. Why? Important differences in YIFs between the years other than simply the planting dates.
Let's not succumb quite yet to fearmongering triggered by the frustrations of planting the 2017 corn crop. “Mudding in” a crop early to avoid planting late will almost always end up being an unwise decision.
Furthermore, since delayed planting by itself is no guarantee of lower ABSOLUTE grain yield, I see little reason to change any crop inputs because of delayed planting, other than possibly seeding rates. Delayed planting generally coincides with warmer soil temperatures compared to early planting. Consequently, stand establishment may be more successful with delayed planting, resulting in established plant populations that are closer to actual seeding rates than the usual 90 to 95% success rate with earlier planting dates. So, you might consider slightly reducing your seeding rates with delayed planting.
When faced with prospects of delayed planting, one should certainly look for ways to expedite the planting process by eliminating unnecessary tillage trips or delaying some field operations (Thomison et al., 2015) because there is no reason to purposefully plant any later than necessary.
Myers, Brent and Bill Wiebold. 2013. Planting Date 2013. Univ of Missouri Extension [On-line] http://ipm.missouri.edu/IPCM/2013/4/Planting-Date-2013. [URL accessed May 2017].
Nafziger, Emerson. 2008. Thinking About Corn Planting Date and Population. The Bulletin (No. 2, Article 7, April 4), Univ. of Illinois Extension. [On-line]. http://http://bulletin.ipm.illinois.edu/article.php?id=890. [URL accessed May 2017].
Nafziger, Emerson. 2011. Corn Planting: Optimism on Hold. The Bulletin (No. 3, Article 9, Apr 22), Univ. of Illinois Extension. [On-line]. http://bulletin.ipm.illinois.edu/article.php?id=1469 [URL accessed May 2017].
Nielsen, RL (Bob). 2015. Corn & Soybean Planting Progress in Indiana Over the Years. Corny News Network, Purdue Extension. [On-line]. http://www.kingcorn.org/news/timeless/PlantingPace.html [URL accessed May 2017].
Thomison, Peter, Steve Culman, & Mark Loux. 2015. Adjusting Corn Management Practices for a Late Start. C.O.R.N. Newsletter, Ohio State Extension. [On-line] http://agcrops.osu.edu/newsletter/corn-newsletter/2015-11/adjusting-corn-management-practices-late-start [URL accessed May 2017].
USDA-NASS. 2017a. Crop Progress (1 May 2017). USDA, National Agricultural Statistics Service. [On-line]. http://usda.mannlib.cornell.edu/usda/nass/CropProg//2010s/2017/CropProg-05-01-2017.pdf. [URL accessed May 2017].
USDA-NASS. 2017b. Crop Progress (archives). USDA, National Agricultural Statistics Service. [On-line]. http://usda.mannlib.cornell.edu/MannUsda/viewDocumentInfo.do?documentID=1048. [URL accessed May 2017].
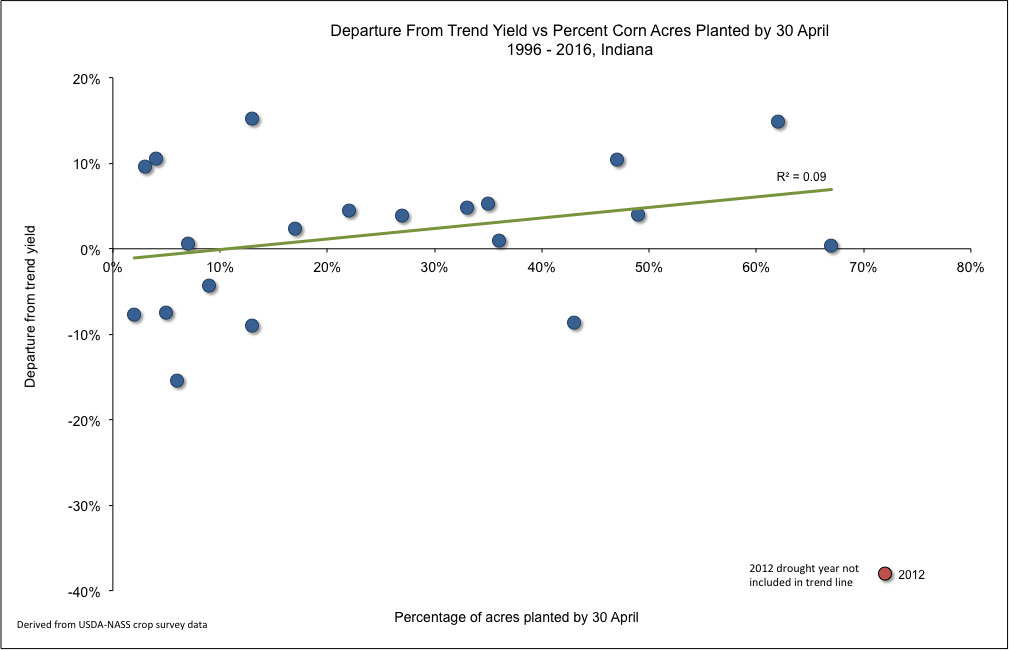
Fig. 1. Percent departure from statewide trend yield versus percent of corn acres planted by April 30 in Indiana, 1996-2016.
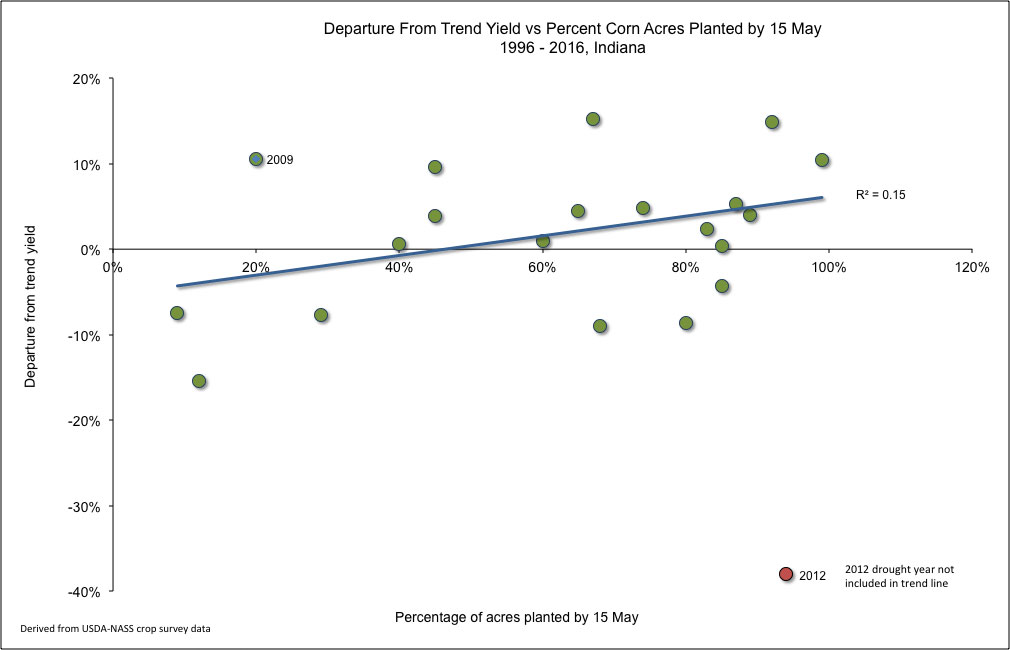
Fig. 2. Percent departure from statewide trend yield versus percent of corn acres planted by May 15 in Indiana, 1996-2016.
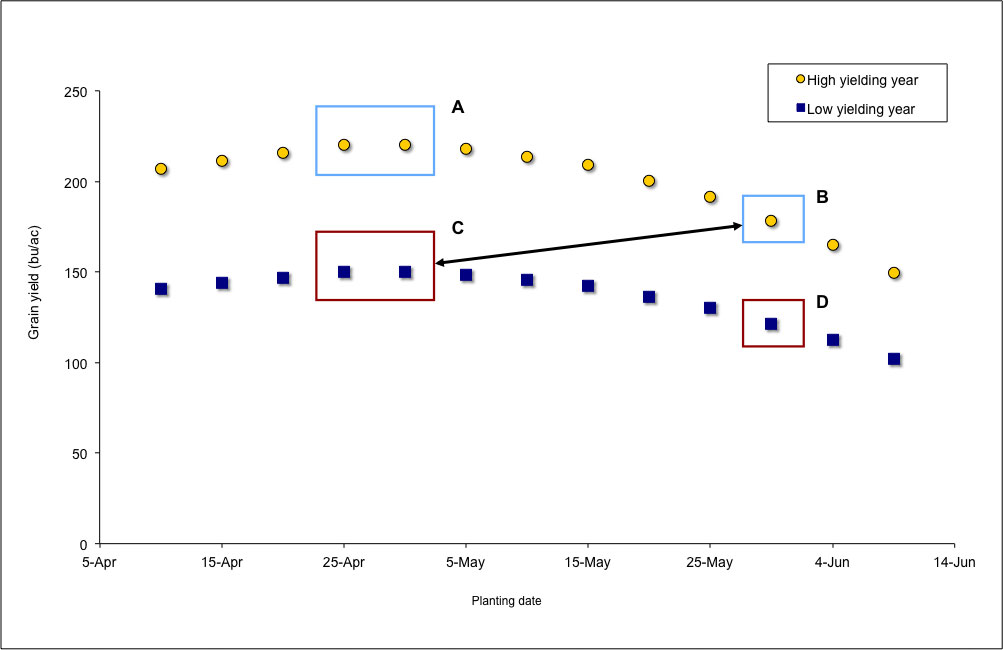
Fig. 3. The planting date conundrum relative to absolute yield potential: A delayed planted crop in one year (B) can yield better than a crop planted on the optimum date in another year (C).
The number of 30-, 40-, and 60-ft wide (or larger) field crop planters across the U.S. Midwest is greater today than, say, twenty years ago. Certainly, individual farmers can plant more acres of corn and soybean per day with today's large field equipment than they could twenty years ago. This fact encourages optimism that planting season delays can be overcome by the capability of today's modern planters to plant a greater percent of the state's crop per week when "push comes to shove."
As is often the case with "logical conclusions", the historical data do not necessarily support the logic. Historical planting progress data suggest that the maximum number of acres of corn and soybean planted per week has not changed much in 20 years. The accompanying figures illustrate the number of acres and percent of total acres planted during the respective weeks of maximum planting progress for corn (Fig. 1), soybean (Fig. 2), and the two crops combined (Fig. 3) for Indiana during the past twenty years.
The most corn acres planted per week in Indiana during the past twenty years occurred in 2001 when 2.9 MILLION acres or 50% of the total acreage for that year were planted in a single week (Fig. 1). To most of us, such a planting pace borders on phenomenonal. The closest we have come to matching that progress was during the 2014 planting season, when 41% of the total crop or 2.4 million acres were planting during a single week.
The most soybean acres planted in a single week in Indiana during the past twenty years also occurred in 2001 when 2.4 million acres or 42% of the total acreage for that year were planted in a single week (Fig. 2). The closest we have come since to matching that progress was during the 2016 planting season, when 32% of the total crop or 1.8 million acres were planting during a single week.
Looking at the historical planting progress of each crop individually (Fig's 1 and 2) suggests that little improvement has been made in our ability to plant a lot of crop acres quickly. Some have countered that the potential TOTAL number of combined crop acres planted per week has increased because farmers are increasingly planting soybean at the same time as they are planting corn, when historically soybean planting occurred near the end of corn planting. Well, that turns out to be not quite true either.
During the past twenty years in Indiana, the greatest number of corn AND soybean acres planted in a single week was also 2001 (no surprise), when 5.25 million acres of the two crops were planted in a single week, or 46% of the total number of corn and soybean acres planted that year (Fig. 3). During the past 20 years, the historical planting progress data suggests that the combined planting progress of the two crops has not changed to any appreciable degree.
So, given the realities of ever larger planting equipment and the fact that farmers are frequently planting both crops at the same time these days, the conundrum is this... Why has the actual weekly planting progress of the two crops changed very little over the past 20 years? The answer does not appear to be related to changes in total crop acres planted in Indiana because that number has remained fairly constant in during that time period (Fig. 4).
One answer to the large planter vs. planting progress conundrum may be the fact that the number of corn/soybean growers in Indiana has decreased over time and those remaining are farming more acres than they did twenty years ago. Even though farm machinery is larger today and cover more acres per day than twenty years ago, fewer farmers are farming more acres and so total planting progress in terms of percent of total acres per week remains fairly unchanged. Coupled with that thought is the reality that weather and soil conditions dictate the number of days available during any given week for field work and planting.
For what it's worth, that's my opinion and you are entitled to it.
Nielsen, RL (Bob). 2017. The Planting Date Conundrum for Corn. Corny News Network, Purdue Univ. online at http://www.kingcorn.org/news/timeless/PltDateCornYld.html [URL accessed May 2017].
USDA-NASS. 2017. Quick Stats. USDA Nat'l Ag. Statistics Service. online at http://www.nass.usda.gov/Quick_Stats [URL accessed May 2017].
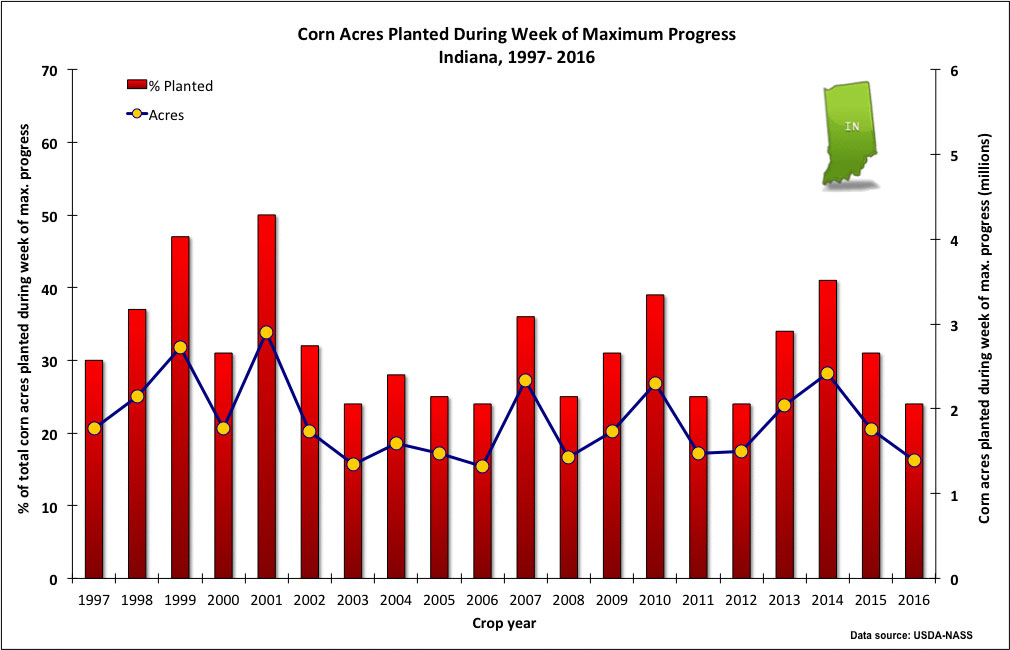
Fig. 1. Acres (actual and percent of total) of field corn planted during the week of maximum planting progress in Indiana, 1995 - 2014. Data source: USDA-NASS. Note that the exact weeks of maximum soybean planting progress may not be the same weeks as those of maximum corn planting progress.
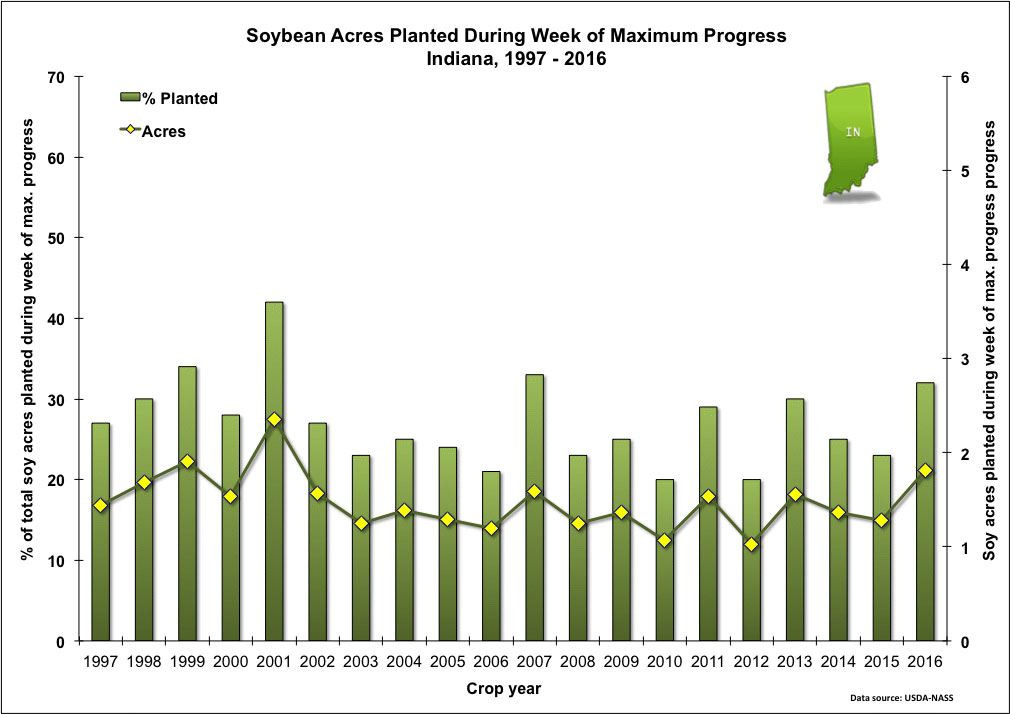
Fig. 2. Acres (actual and percent of total) of soybean planted during the week of maximum planting progress in Indiana, 1997 - 2016. Data source: USDA-NASS. Note that the exact weeks of maximum soybean planting progress may not be the same weeks as those of maximum corn planting progress.
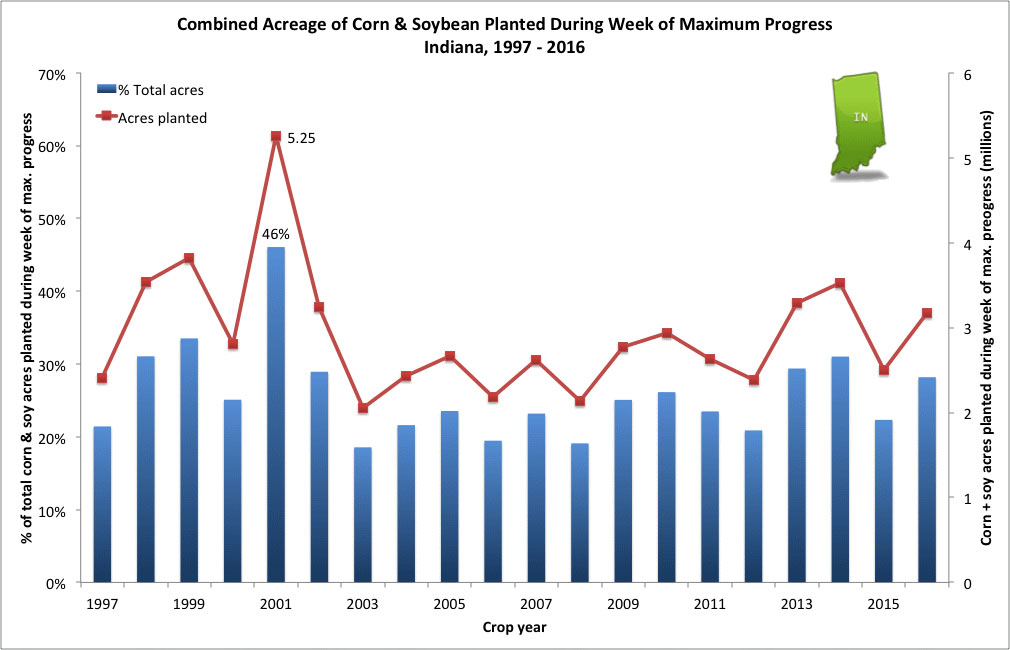
Fig. 3. Acres (actual and percent of total) of field corn plus soybean planted during the week of maximum planting progress (both crops total) in Indiana, 1997 - 2016. Data source: USDA-NASS. Note that the exact weeks of maximum single crop progress may differ from the weeks of maximum two-crop progress.
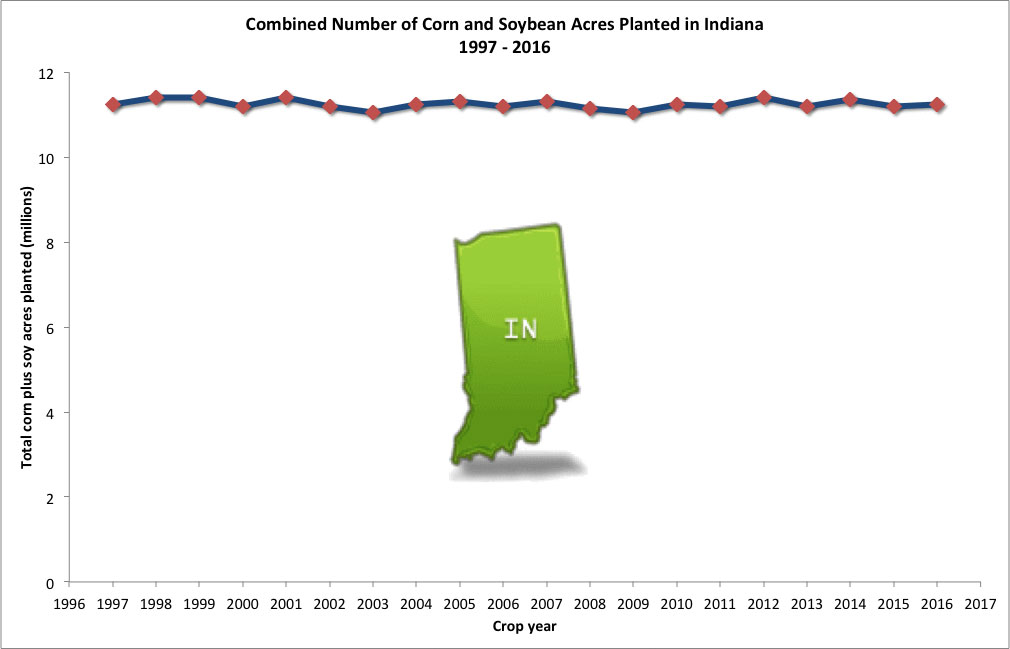
Fig. 4. Combined number of acres planted to corn and soybean in Indiana, 1997 - 2016. Data source: USDA-NASS.
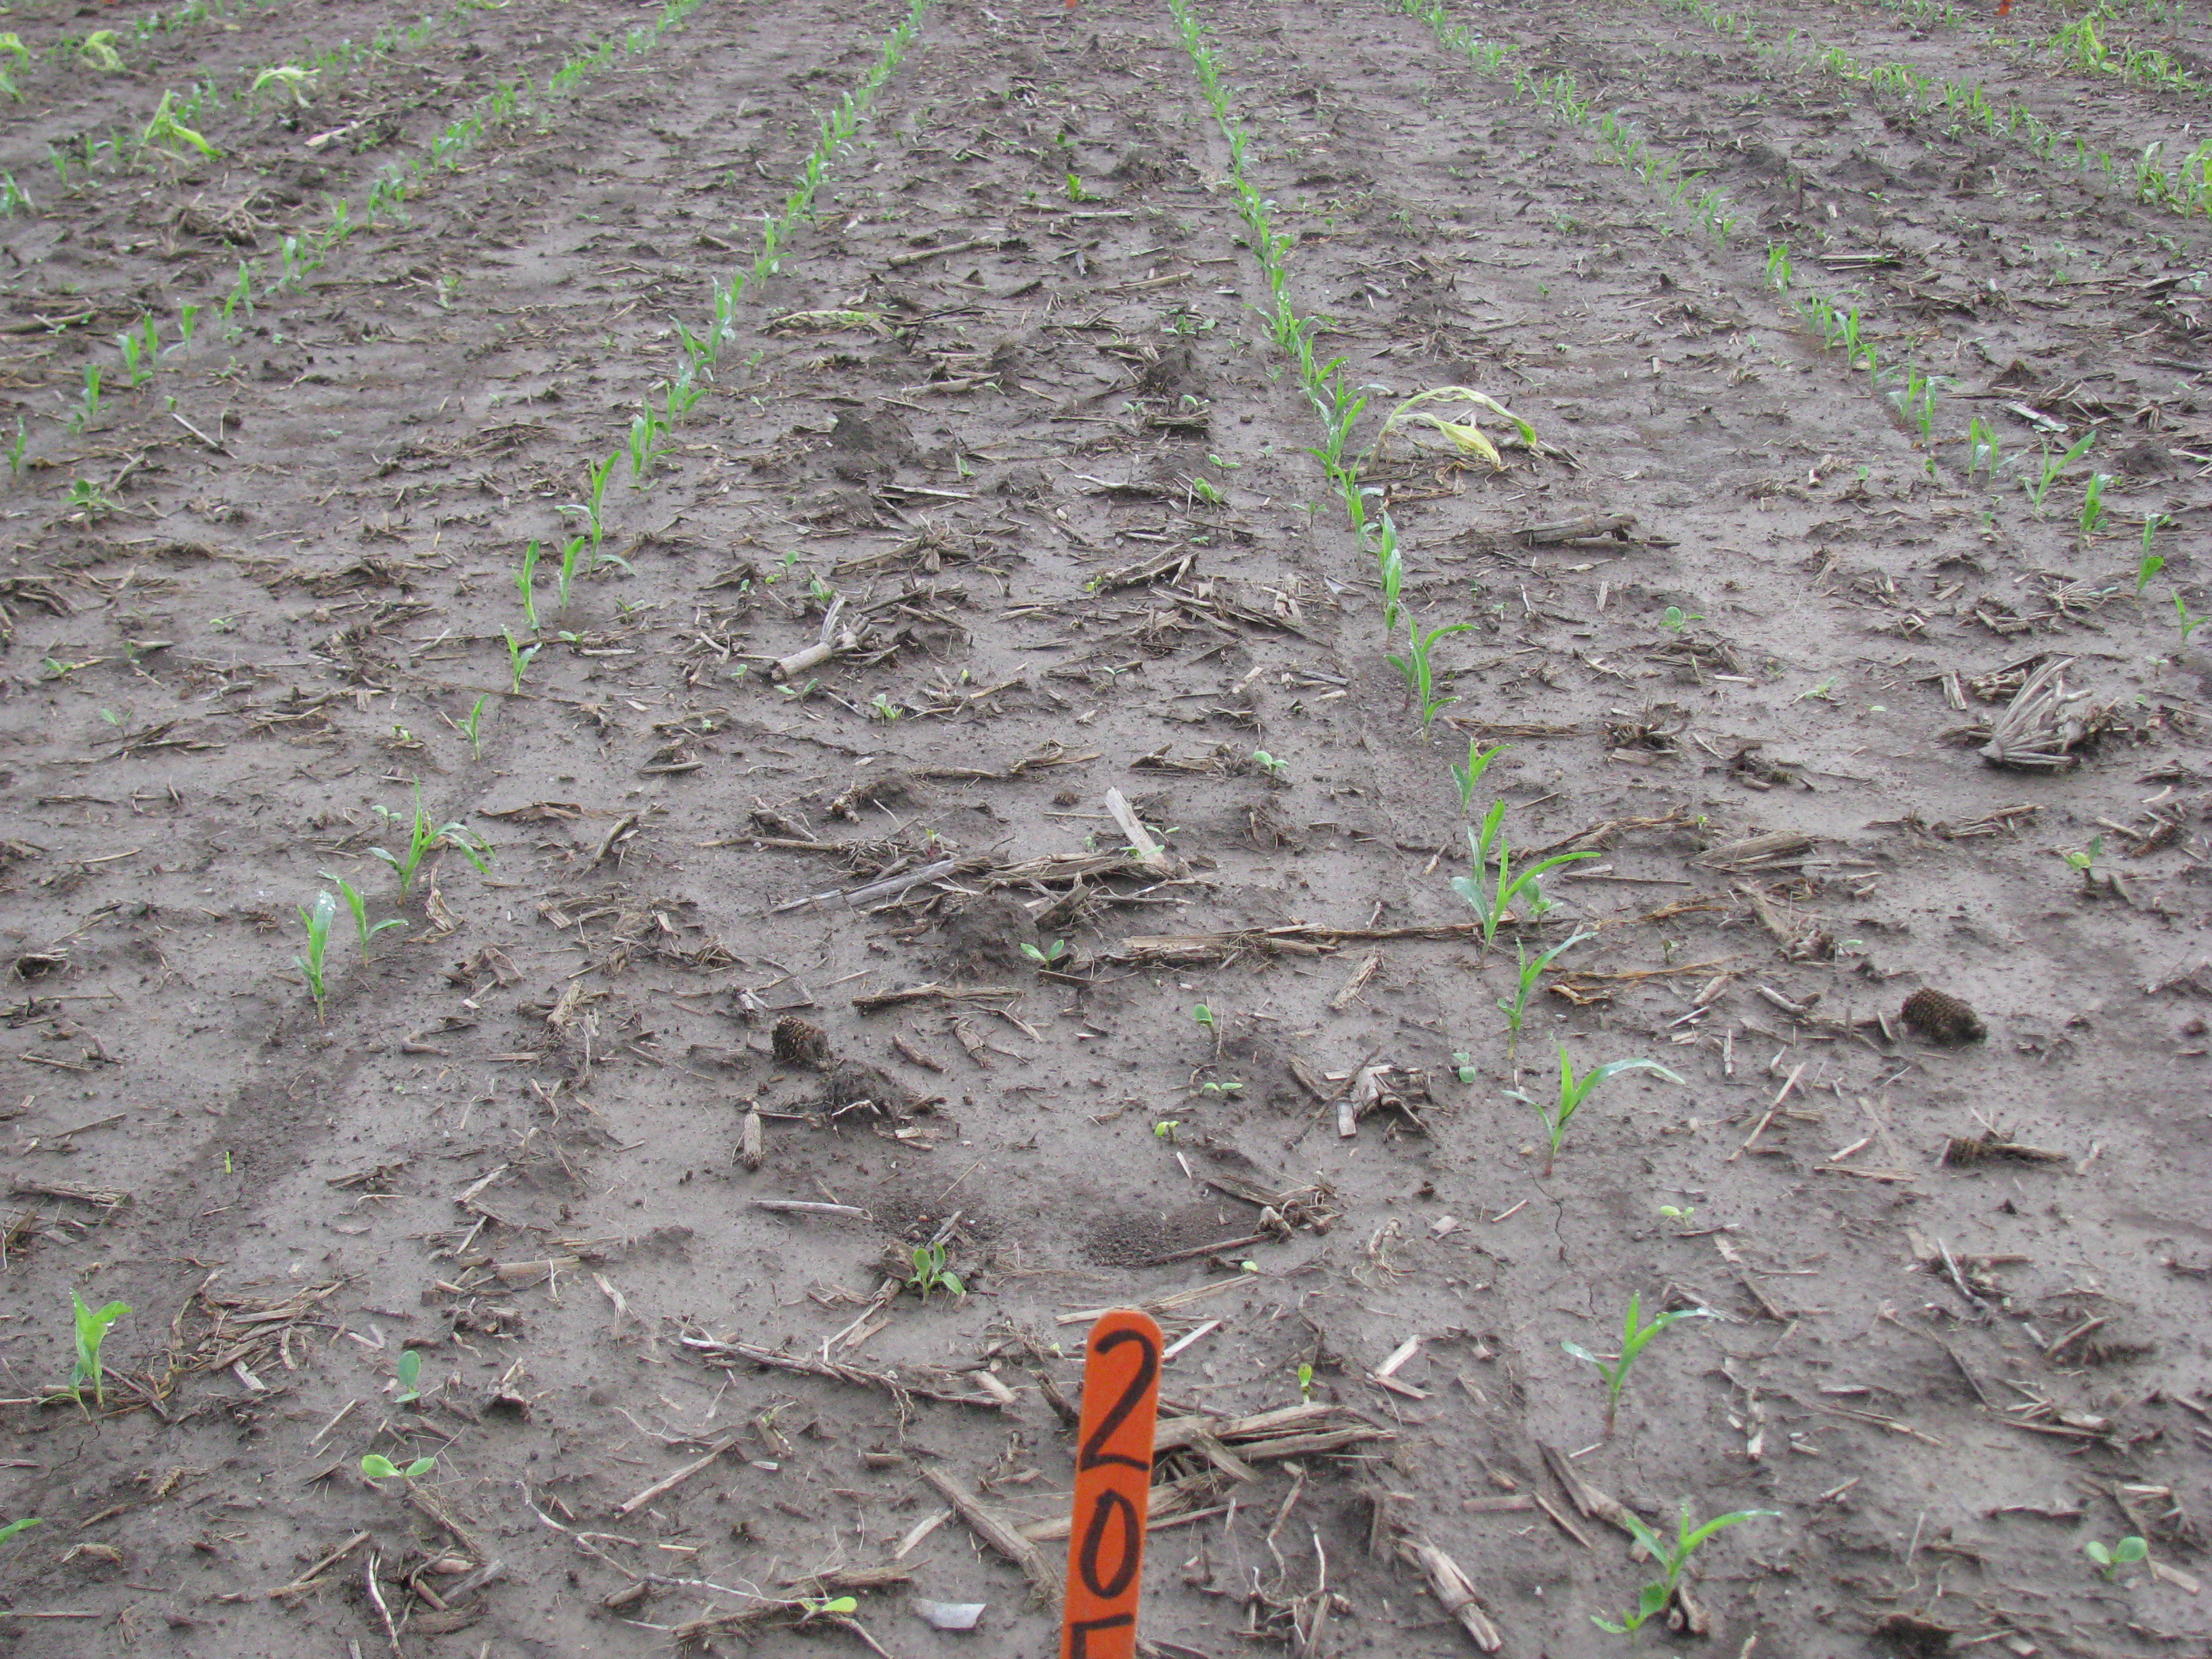
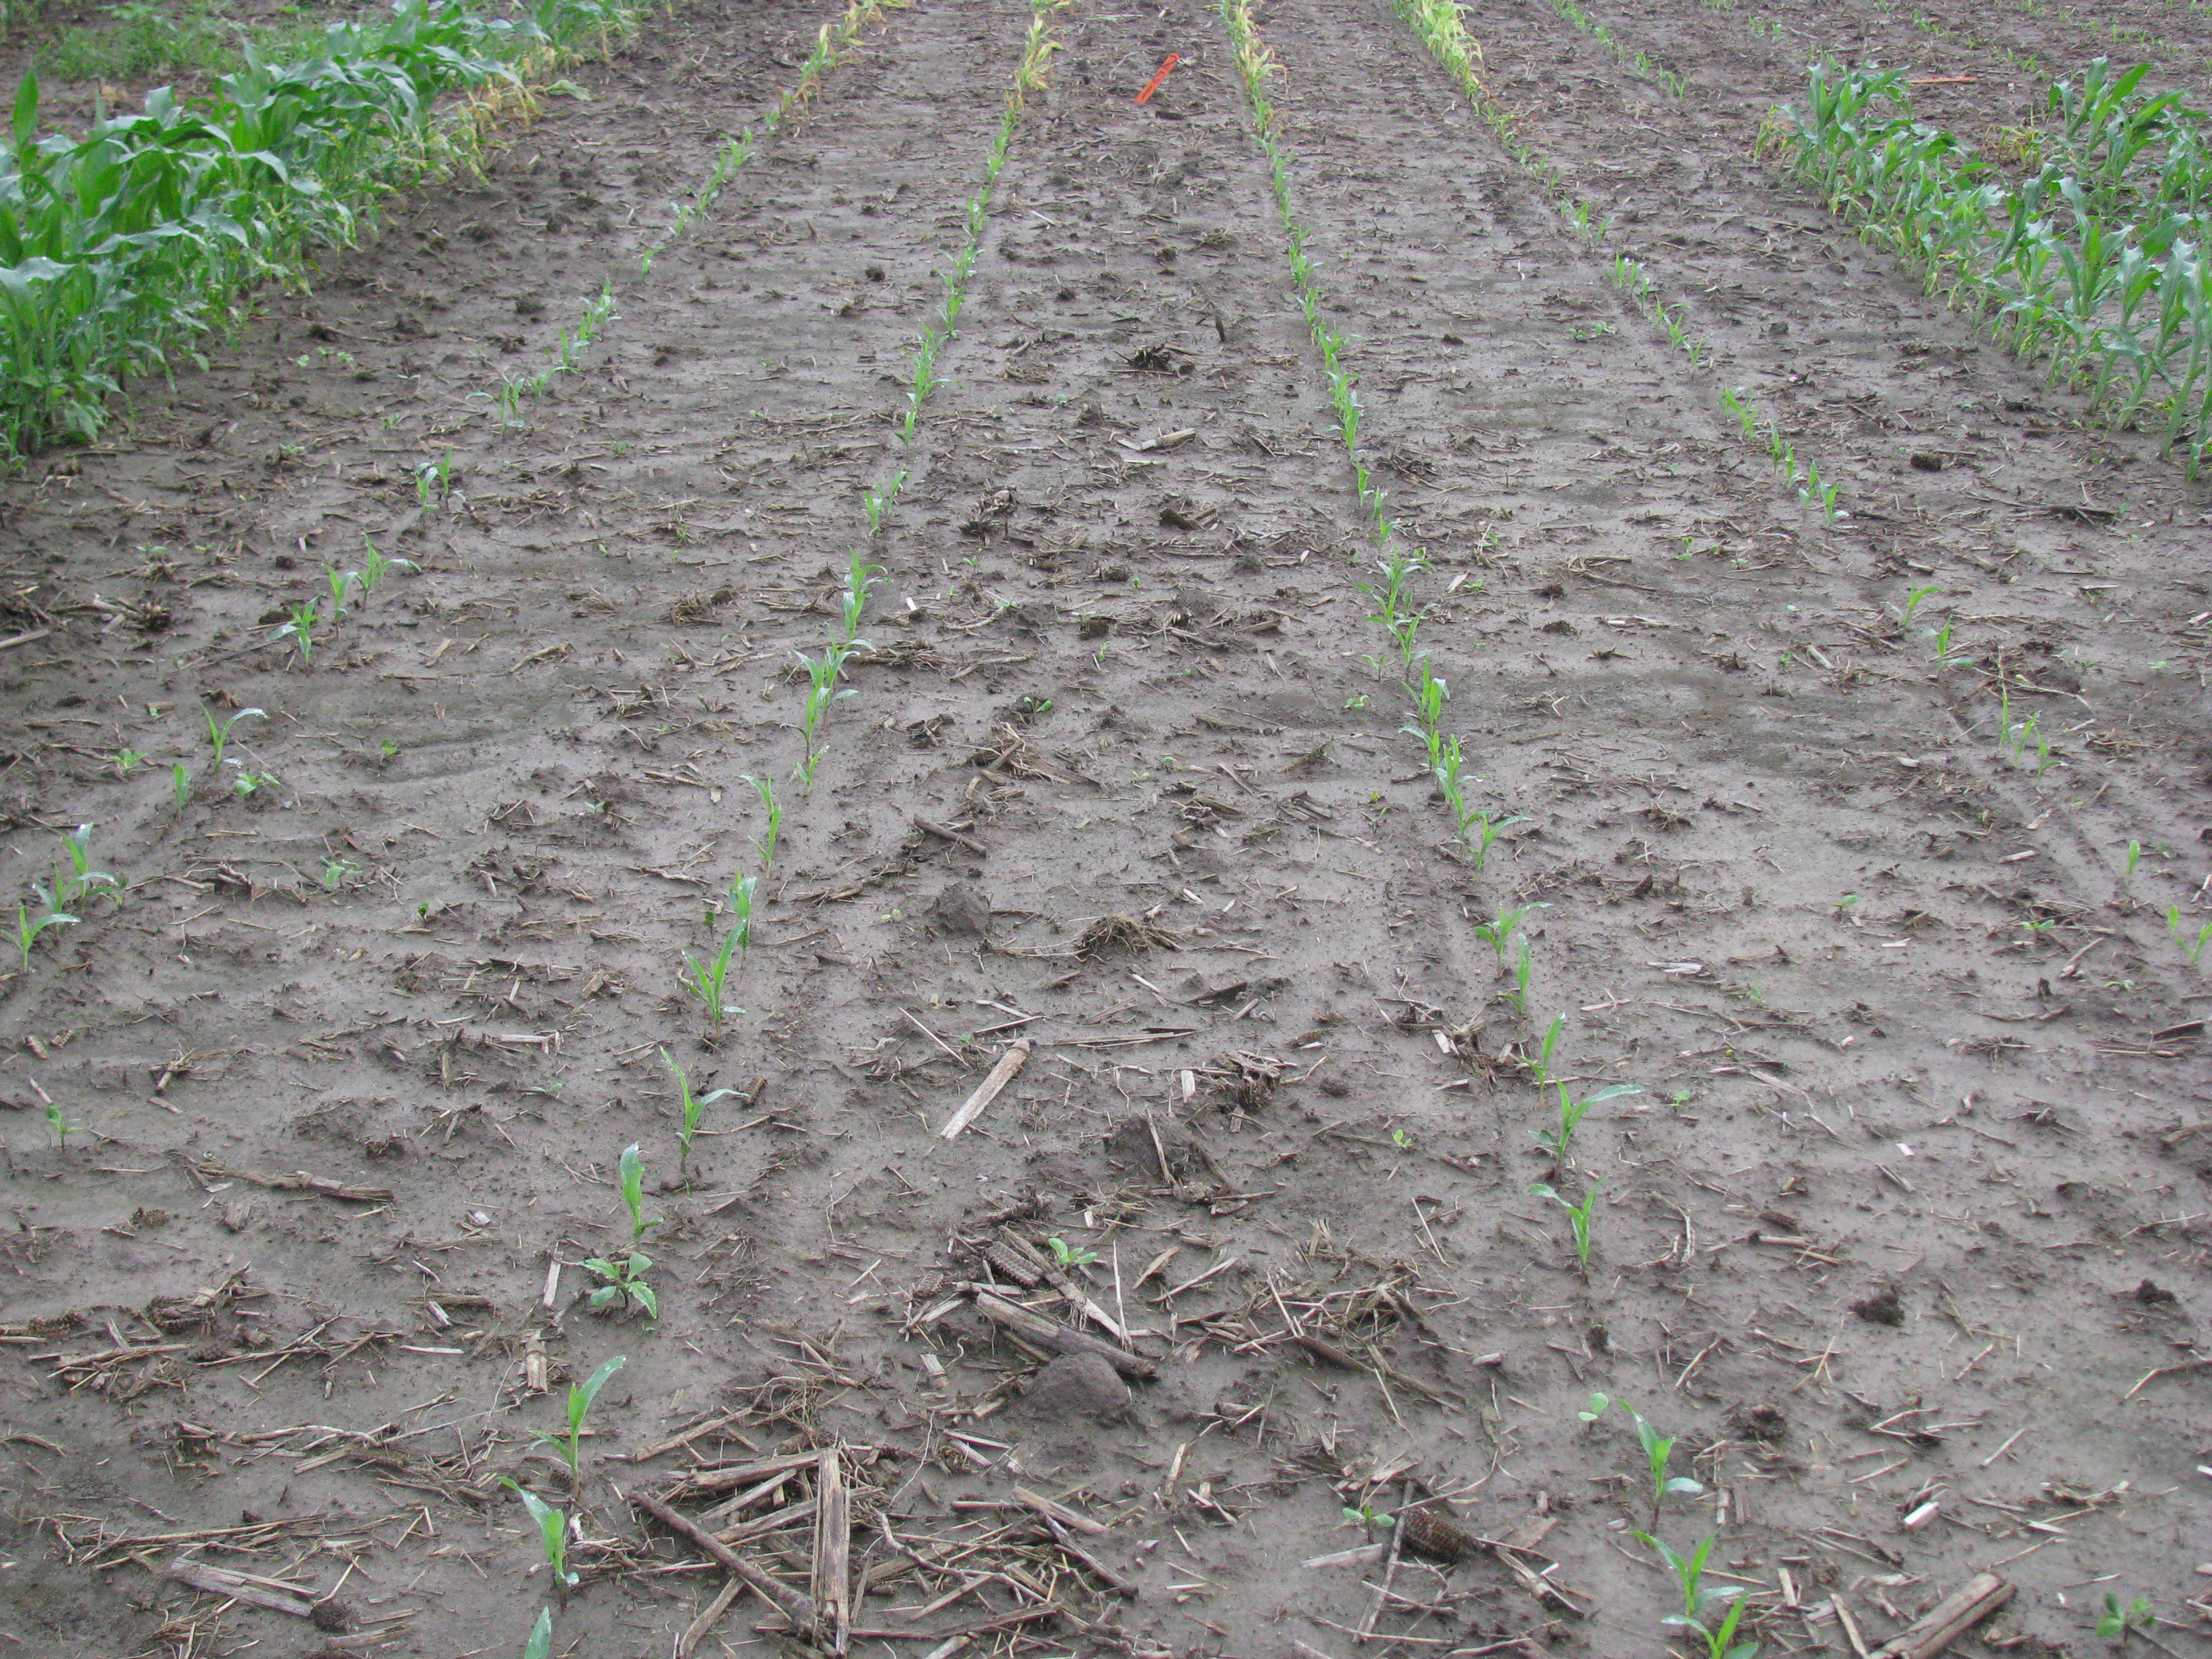
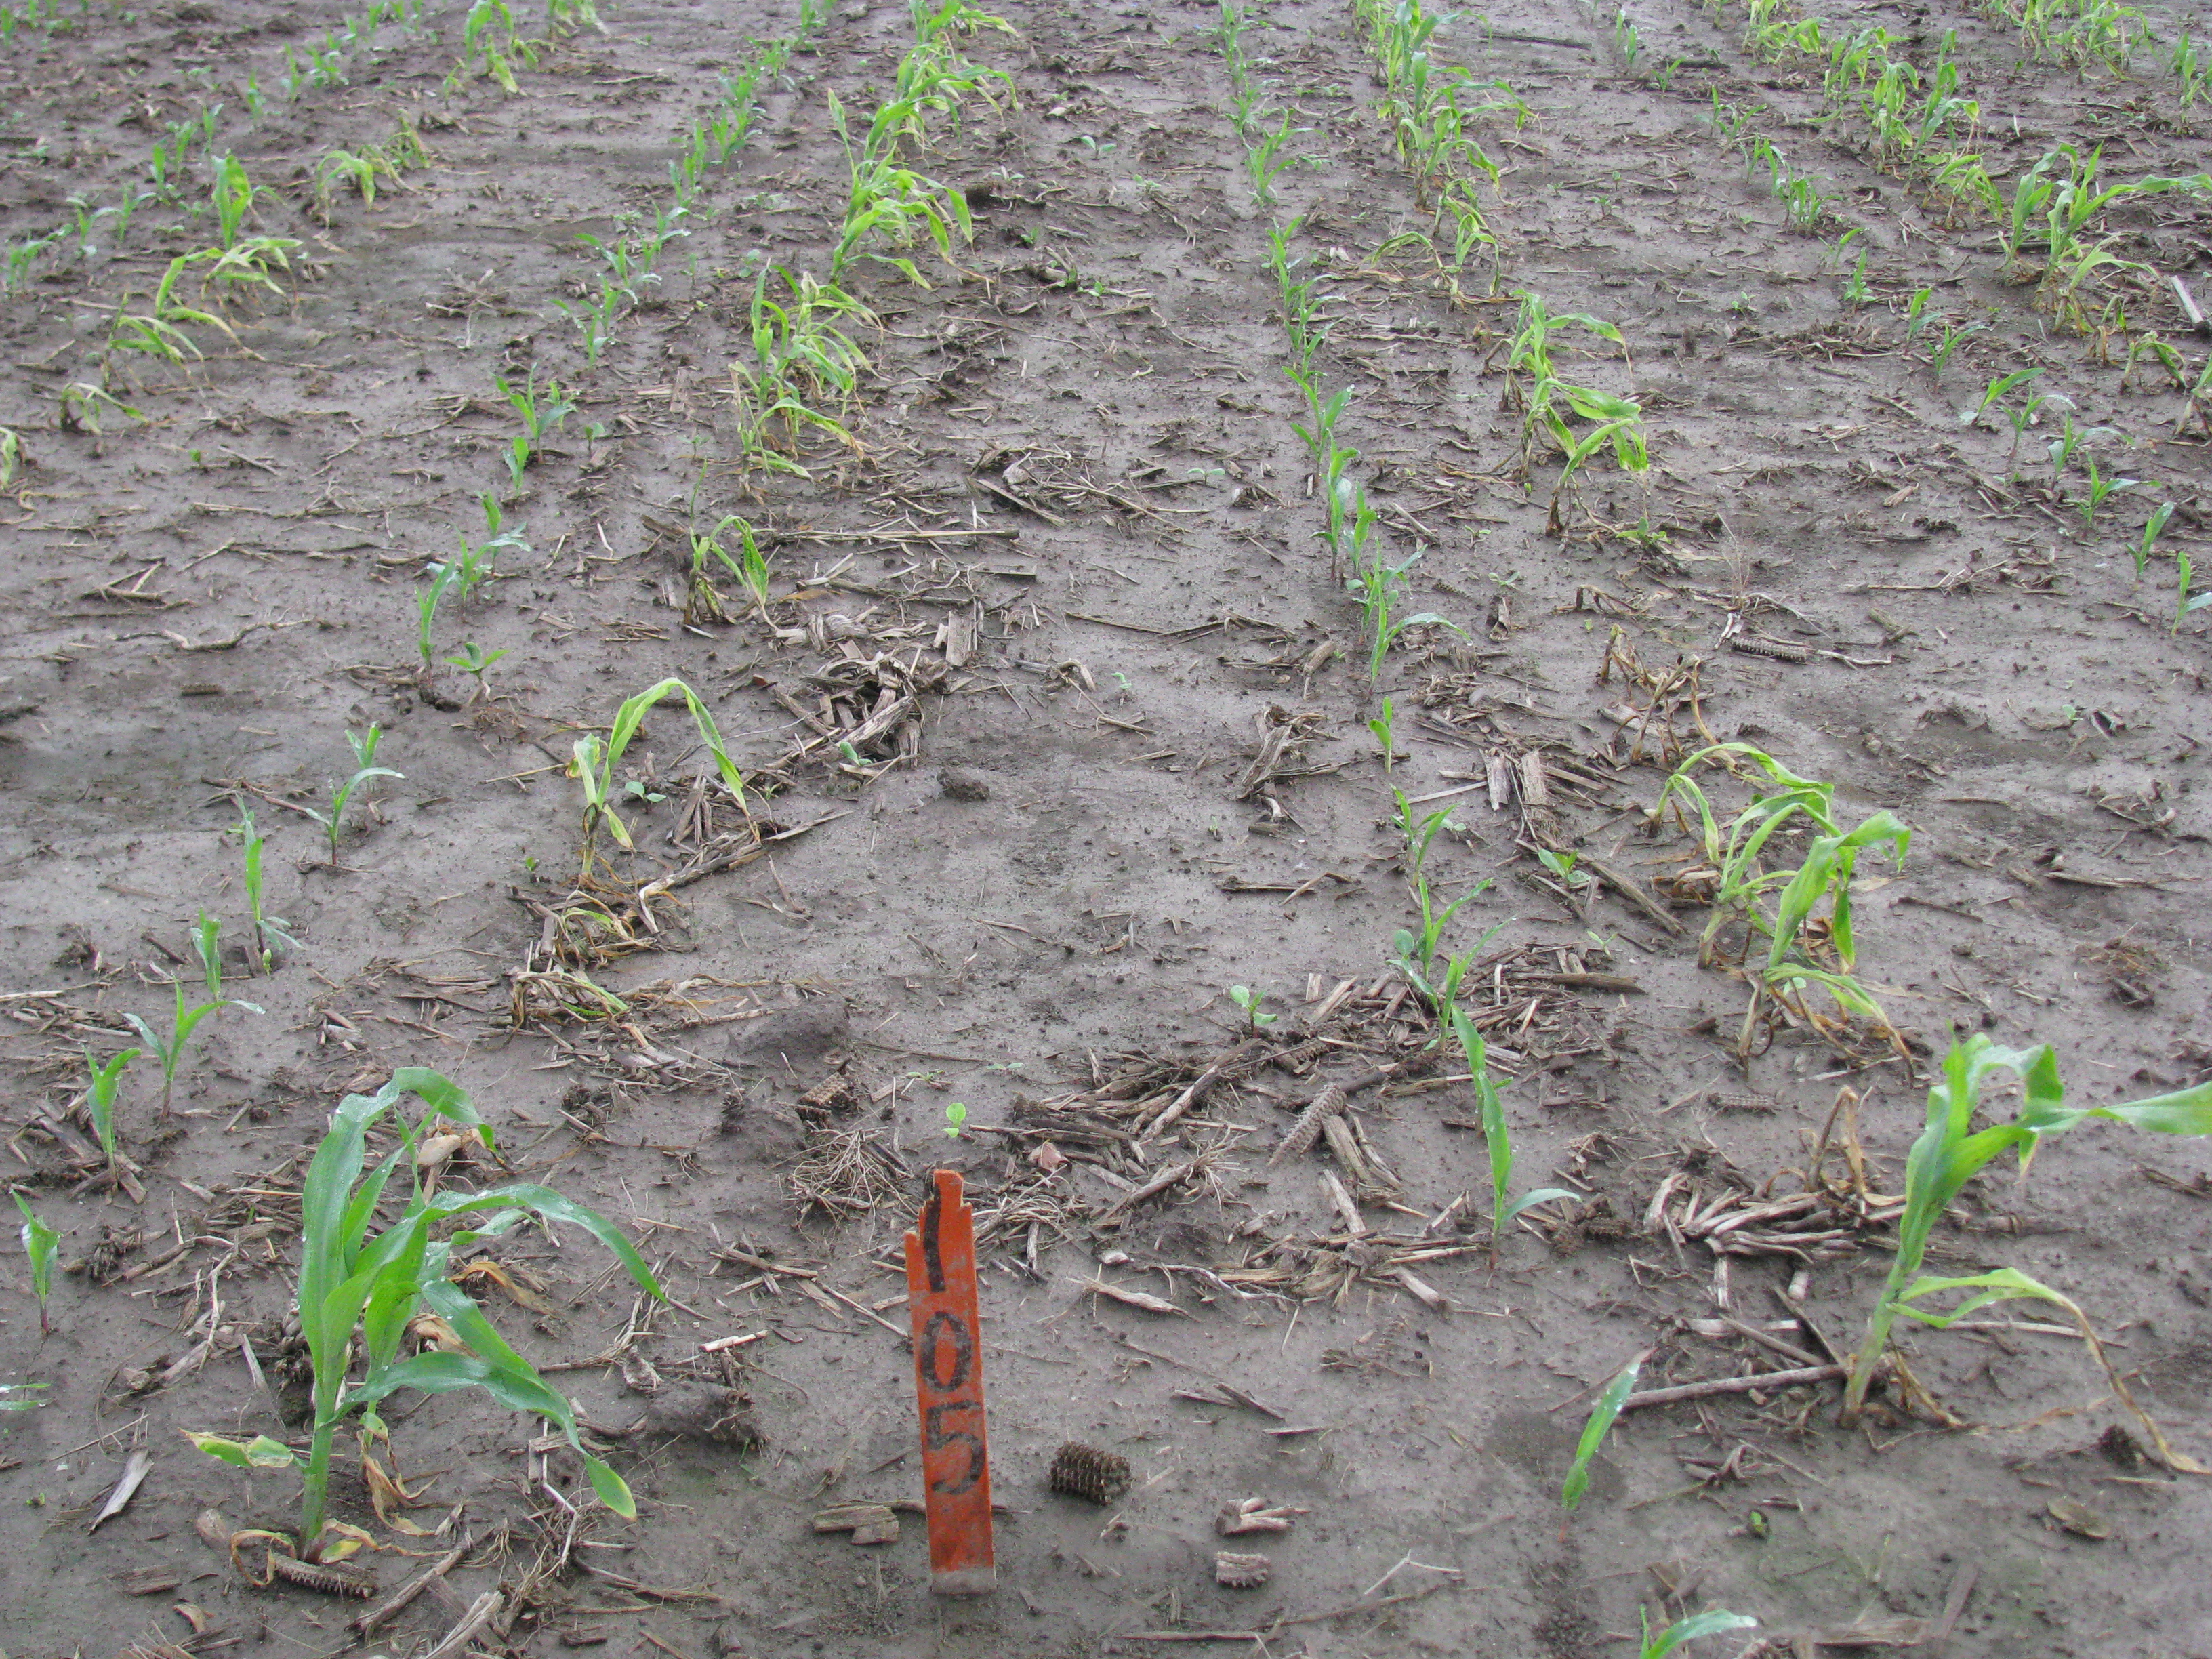
Due to the recent cold wet weather, corn planted in late April has struggled to emerge and there are a number of fields which will need to be replanted. The purpose of this article is to discuss the options to kill an existing stand of corn in a replant situation.
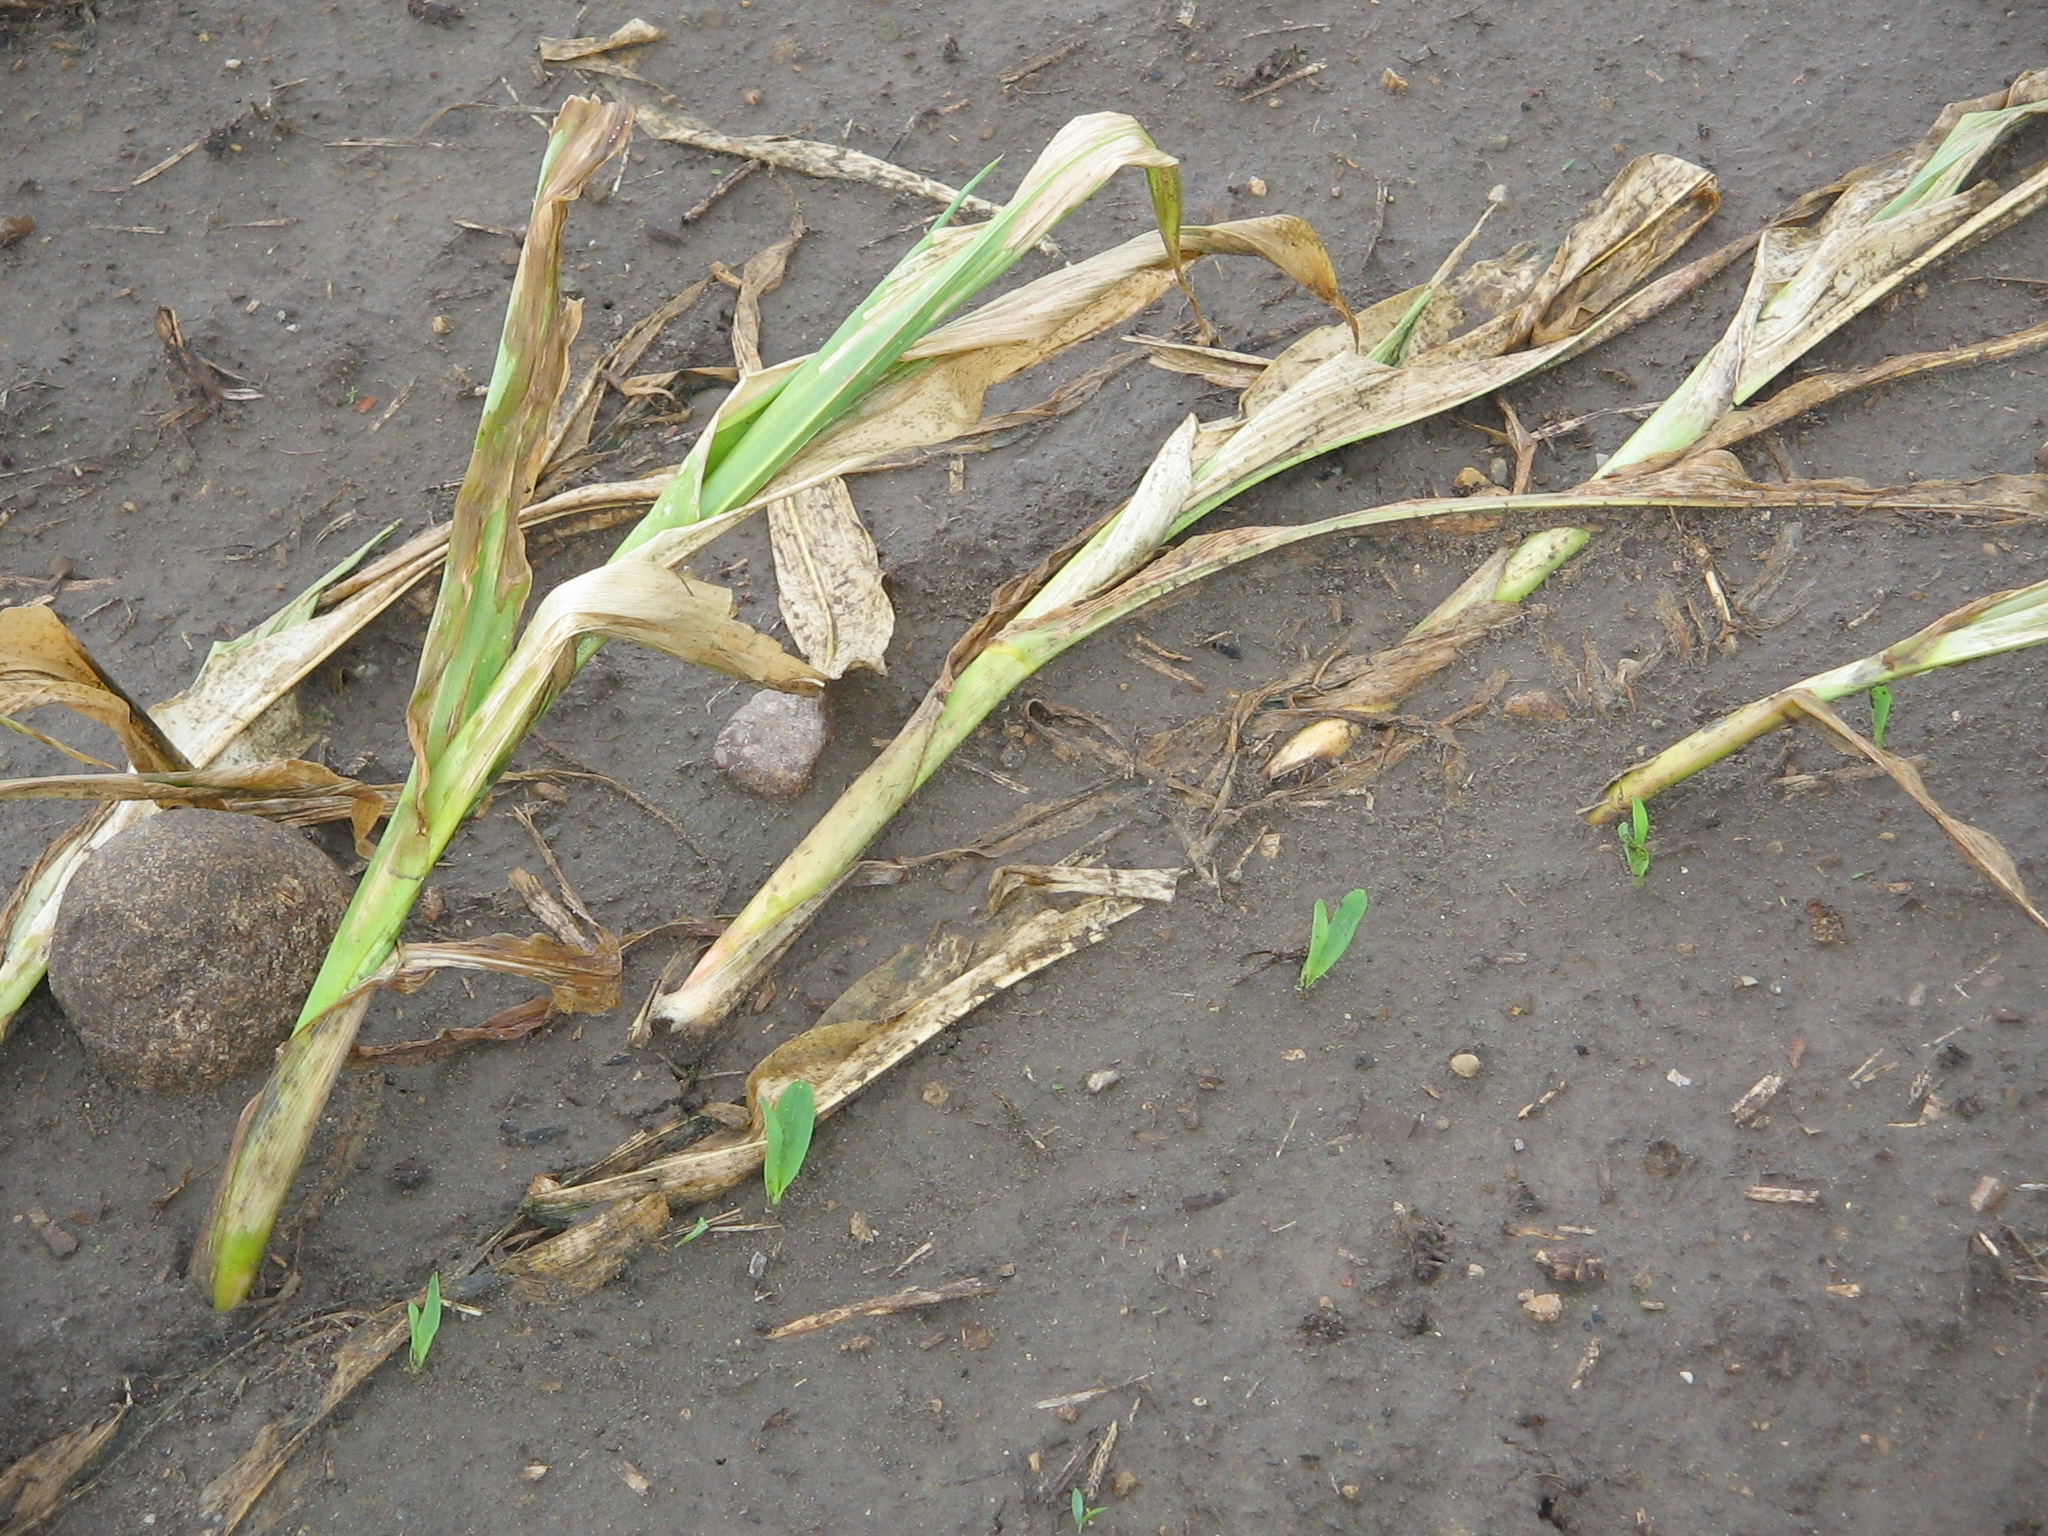
Replanted corn.
The first issue to address is what herbicide resistance traits are stacked in the corn you would like to remove from the field. If the corn is non-GMO (no herbicide-resistance traits), your options for control are tillage, glyphosate (e.g. Roundup, others), clethodim (e.g. Select Max, others), paraquat (e.g. Gramoxone, others) + metribuzin (e.g. Tricor, others), or glufosinate (e.g. Liberty, others). The best solution to control non-GMO corn will be to use tillage or glyphosate. Non-GMO corn is very sensitive to glyphosate and no waiting intervals are needed to replant. You can also use glyphosate or tillage to control Liberty Link corn hybrids (as long as the hybrid is not also Roundup Ready). For Roundup Ready corn that doesn’t carry the Liberty Link trait, tillage, Select Max, or paraquat + metribuzin (Gramoxone + Tricor) would be the logical methods for termination. Another option for corn that is not Liberty Link is to plant Liberty Link corn and apply a follow up treatment of Liberty postemergence to control plants that survived the first application. Use of 32 to 34 oz/A of Liberty has been effective for control of small corn (V1 to V3) in our research.
Gramoxone + Tricor.
If your corn is NOT non-GMO, then the options are somewhat more complicated. Many popular commercial hybrids are stacked with either Roundup Ready and Liberty Link traits, or both traits. If you have corn stacked with both traits, our experience has been that tillage will be the most reliable method, and would not have the waiting interval associated with Select Max, but tillage is not desirable for those in a long-term no-till situation, or those with cover crops in the field.
Select Max.
Numerous clethodim products, including Select Max, can be used to control the stacked trait corn in a replant situation. The use of Select Max will provide better control of corn than Gramoxone + Tricor, but you cannot plant until 6 days after the field is treated with Select Max. The directions on the label indicate that up to 6 fl oz/A can be applied and NIS at 0.25% and AMS at 2.5 to 4 lb/A should be used as the spray additives. Apply to corn that is 12 inches or less. Avoid overlapping the boom for overlaps may result in rates that can cause excessive crop injury. If you want to avoid the waiting interval to plant, your only herbicide option for termination of stacked trait corn is paraquat + metribuzin. In University research trials, 2-3 pt/A of Gramoxone + 4-6 oz/A of dry metribuzin (e.g. Tricor, others) has been effective for control of small corn (V1 to V3). Application of Gramoxone alone, without the addition of metribuzin, is likely to be less effective. Corn that has advanced past the V3 growth stage will generally be more difficult to control.
Gramoxone Alone
Information listed here is based on research and outreach extension programming at Purdue University and elsewhere. The use of trade names is for clarity to readers of this site, it does not imply endorsement of a particular brand nor does exclusion imply non-approval. Always consult the herbicide label for the most current and update precautions and restrictions.
Soybean fields planted prior to the cool, wet conditions that we are experiencing across the state may experience stand establishment problems. Poor stand establishment may be due to several factors, including seedling blight diseases. Several different organisms can cause seedling blight diseases under a range of environmental conditions. The North Central Soybean Research Program and the United Soybean Board have sponsored several publications that can help farmers and agribusiness personnel understand and manage soybean seedling diseases.
Soybean Seedling Diseases — This publication discusses the organisms that cause soybean seedling blights, the conditions that favor each disease, and general management practices for preventing seedling blights.
A VIDEO describing the symptoms of seedling blights can be found here:
Scouting for Soybean Seedling Diseases and Disorders — This two-page scouting card is an excellent reference to help distinguish seedling blight diseases from common seedling disorders, such as herbicide injury.
Fungicide Efficacy for Control of Soybean Seedling Diseases — This publication is an annually updated table that includes the efficacy of the most widely marketed fungicide seed treatments against seedling blight pathogens. Ratings are developed by a national group of soybean pathologists as part of the NCERA-137 Soybean Disease Multistate Research Project.
Remember that to accurately determine the specific organism responsible for a suspected seedling blight issue, it is necessary to submit samples to a diagnostic lab such as the Purdue Plant and Pest Diagnostic Lab.
This VIDEO demonstrates how to sample fields to diagnose seedling blight and stand establishment issues. Soybean seedling blight sampling:
Purdue Cooperative Extension Service
Purdue Extension Entomology
901 W. State Street
West Lafayette, IN, 47907
(765) 494-8761
luck@purdue.edu
@PurdueExtEnt
PurdueEntomology
If you would like to be alerted by e-mail when the current issue of the Pest&Crop is available on-line, please enter your e-mail address and click the submit button.
It is the policy of the Purdue University Cooperative Extension Service that all persons have equal opportunity and access to its educational programs, services, activities, and facilities without regard to race, religion, color, sex, age, national origin or ancestry, marital status, parental status, sexual orientation, disability or status as a veteran. Purdue University is an Affirmative Action institution. This material may be available in alternative formats.